Content
-
Weekly Highlights
- Market Commentary
- Risk
- Durable Goods


Over the last week, the steel market has shown support for the recent price increase announcements from the domestic producers. The spot HRC transaction price is up approximately $60/st over the last month, and lead times have pushed out by about 1 week as order books have filled. Mill’s seem intent on getting the HRC price above $600/st, which is about $40 away. The following two dynamics, scrap pricing and inventory restocking, will influence their ability to prolong the current price rally.
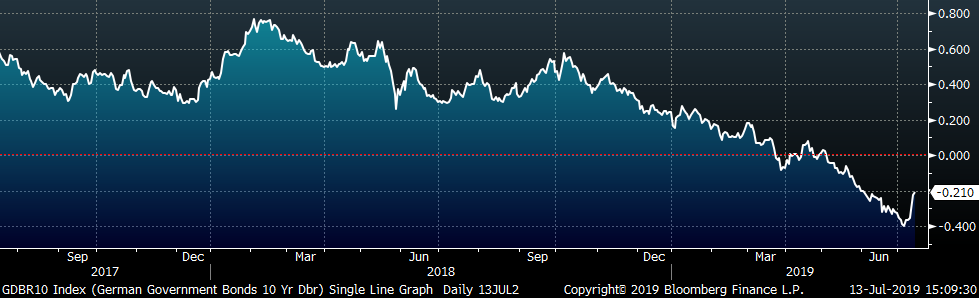
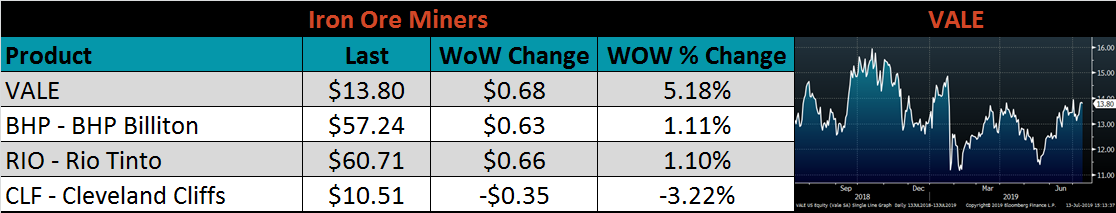
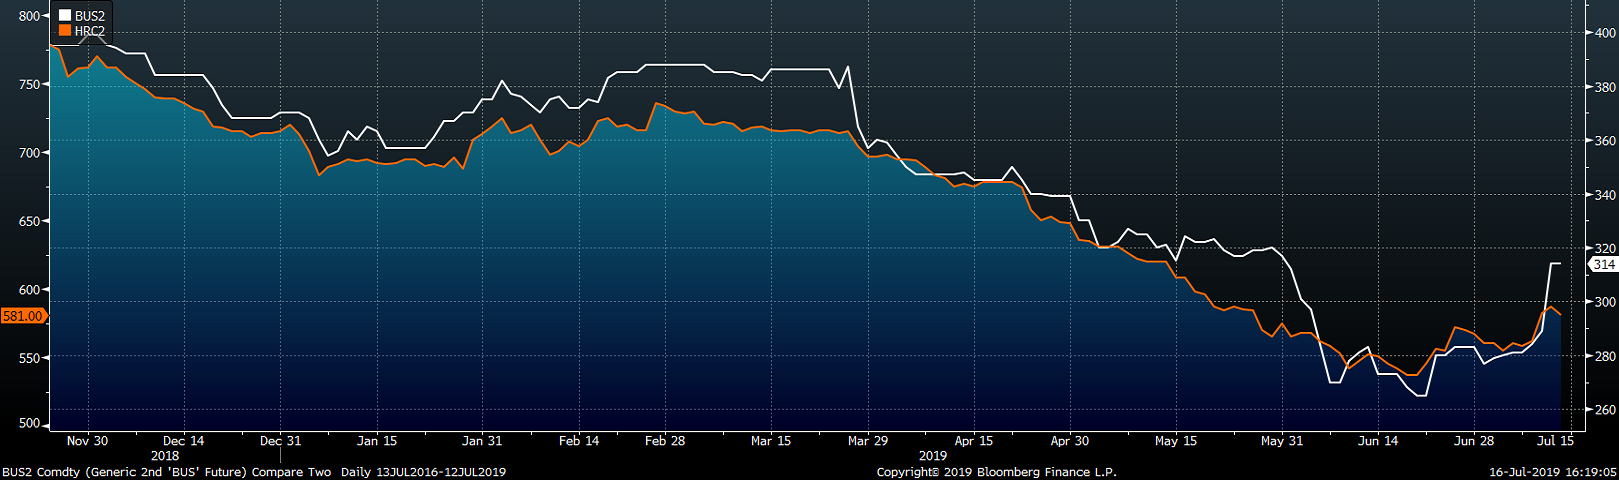
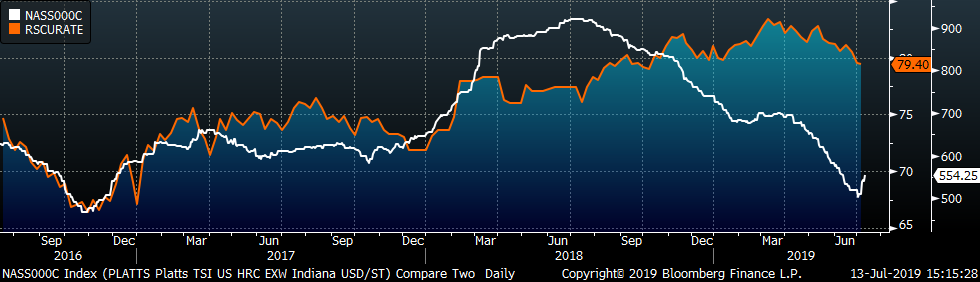
This report tracks, and has repeatedly discussed, producer’s profits and its influence on the market price. Iron ore prices have rallied significantly during the first half of the year, putting more pressure on the profitability of BOFs than EAFs. Mini mills have fared relatively better due to the simultaneous decline in scrap pricing during the HRC price downtrend. The chart below shows the correlation between the busheling scrap price (white) and the HRC price (orange).
The busheling scrap forward curve, which displays the market’s expectations of future pricing, shows that the price is expected to increase by approximately $50 over the next three months. If this turns out to be the case, mills will need to increase prices to maintain profitability as their input costs increase. However, the market should be supportive of higher prices in the face of increasing raw material prices and extending lead times.
The price decline in the beginning of the year was exasperated and extended as service centers and end users destocked from the inventory overhang at the end of 2018. This was extremely painful for most as inventory held for any period was priced out of the market. With this experience fresh in steel buyers’ minds, inventories are running low and the appetite for restocking is nonexistent. However, this reflects recency bias within the steel industry, where buyers place too much weight on the most recent events rather than considering all available information equally. Service centers and end users started running their lowest levels of inventory as the price bottomed rather than restocking at low prices. This strategy may be shifting though, as the HRC forward curve remains in contango, signaling that market participants expect prices to be higher in the future and restocking at current spot prices is the advised approach.
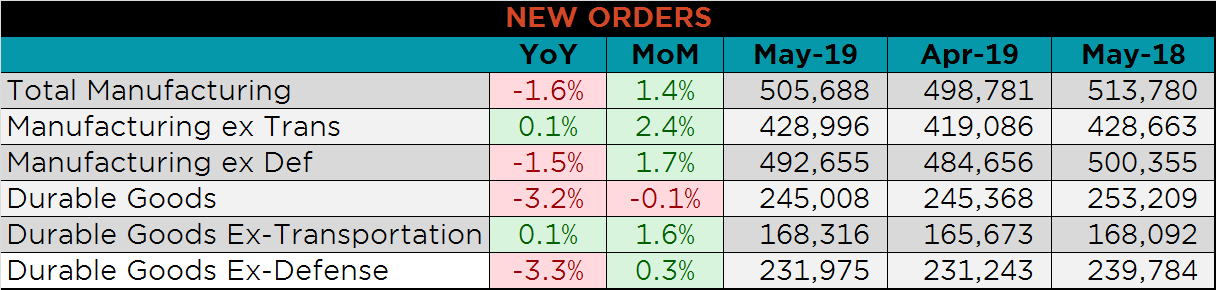
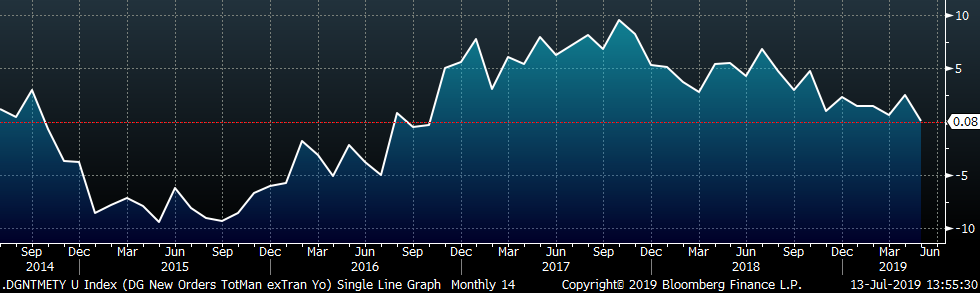
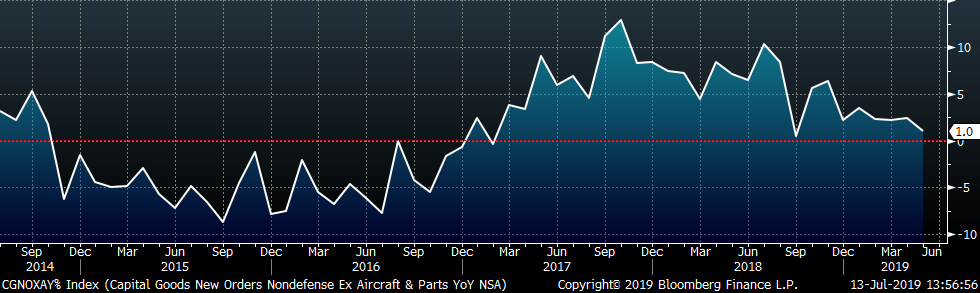
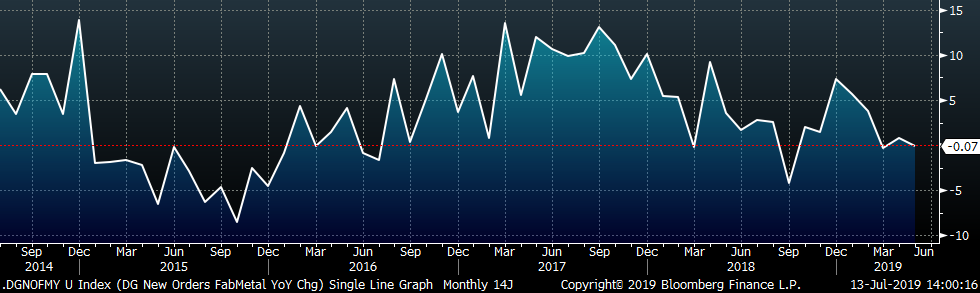
Below are final May new orders from the Durable Goods report. Overall, new orders were lower YoY, primarily because of transportation, which has been down three of the last four months. Excluding transportation, total manufacturing new orders were up slightly YoY and 2.4% higher than April. Capital goods orders, nondefense ex aircraft, grew 1.0% YoY, but at a slower pace than previous months.
Below are the most pertinent upside and downside price risks:
Upside Risks:
Downside Risks:
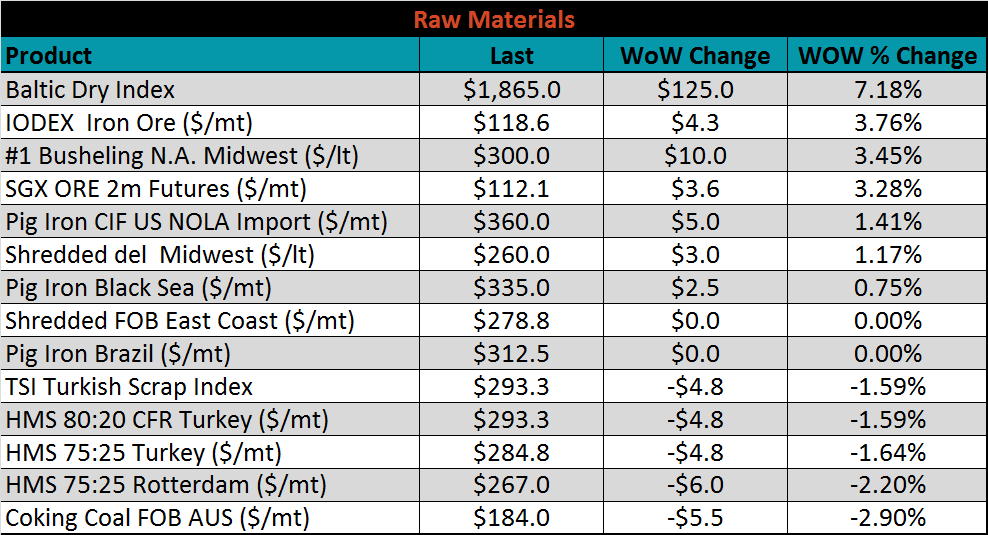
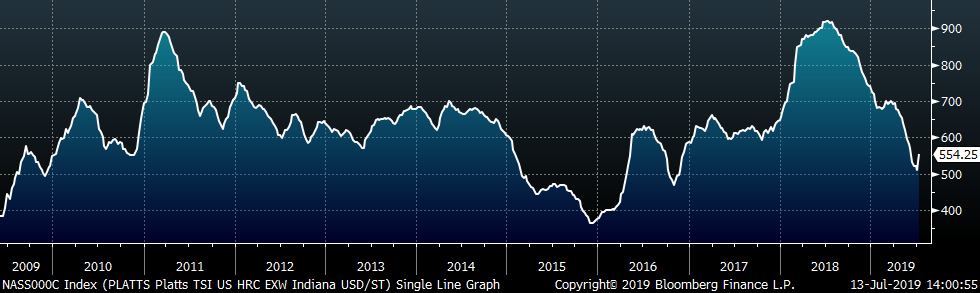
The Platts TSI Daily Midwest HRC Index was up $44.50 to $554.25.
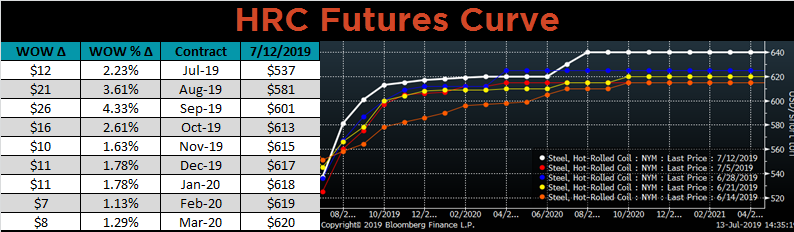
The CME Midwest HRC futures curve is shown below with last Friday’s settlements in white. The curve moved higher across all expirations to the highest level in the last 5 weeks.
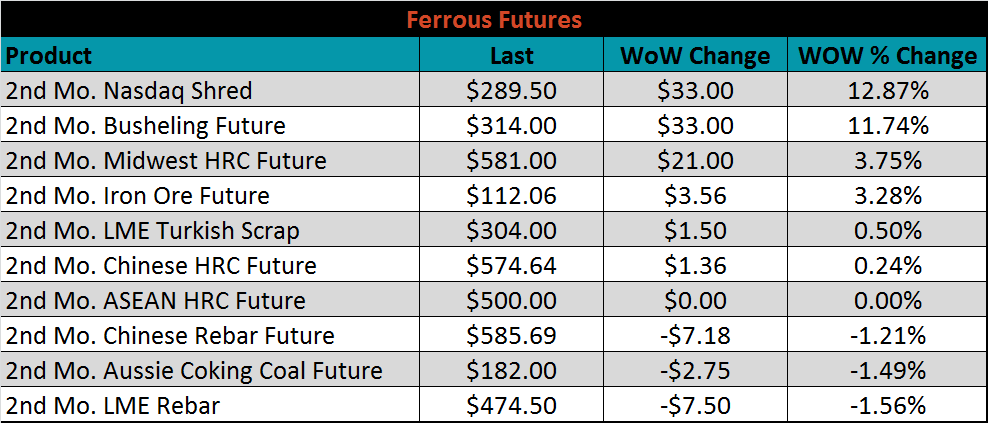
July ferrous futures were mixed. The Nasdaq shred and busheling futures gained 12.9%, and 11.7%, respectively.
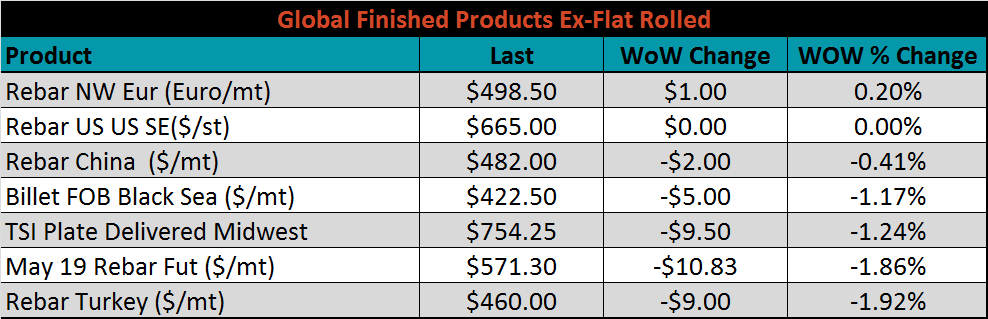
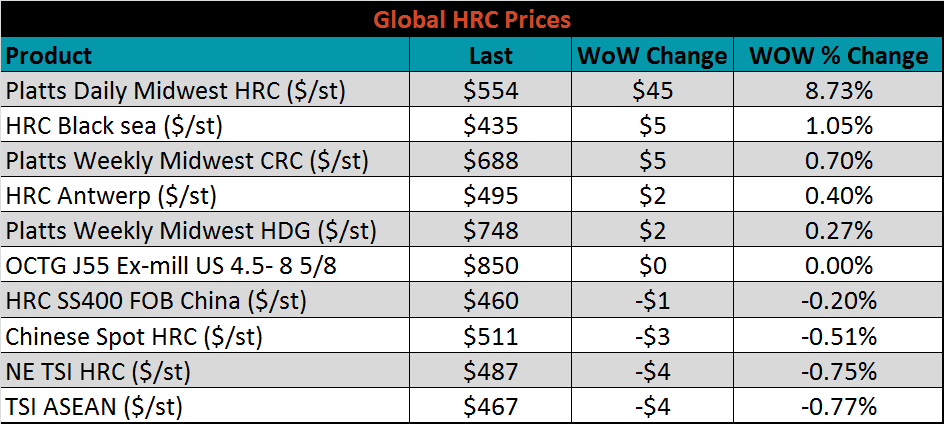
The global flat rolled indexes were mixed. Platts Midwest HRC index was up 8.7%, while ASEAN and Northern Europe were each slightly down, 0.8%.
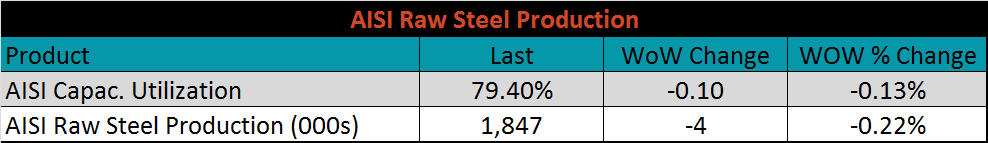
The AISI Capacity Utilization Rate was down again last week to 79.4, remaining below the 80% goal set by the Trump administration for the second week in a row. Raw steel production fell again this week, making it the fourth week in a row of declines. This will support prices, as reduced capacity will cause mill order books to fill quicker.
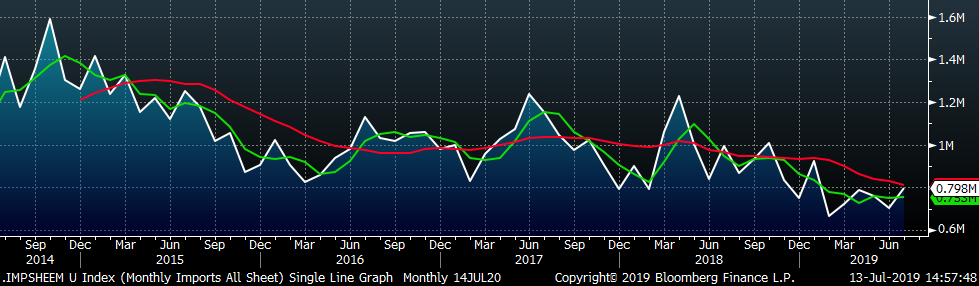
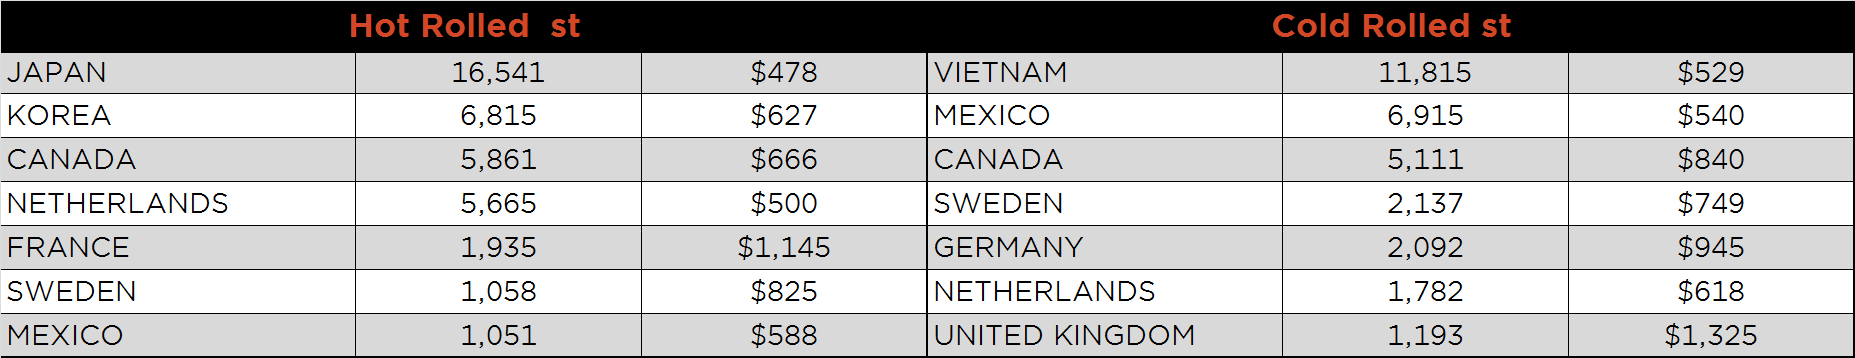
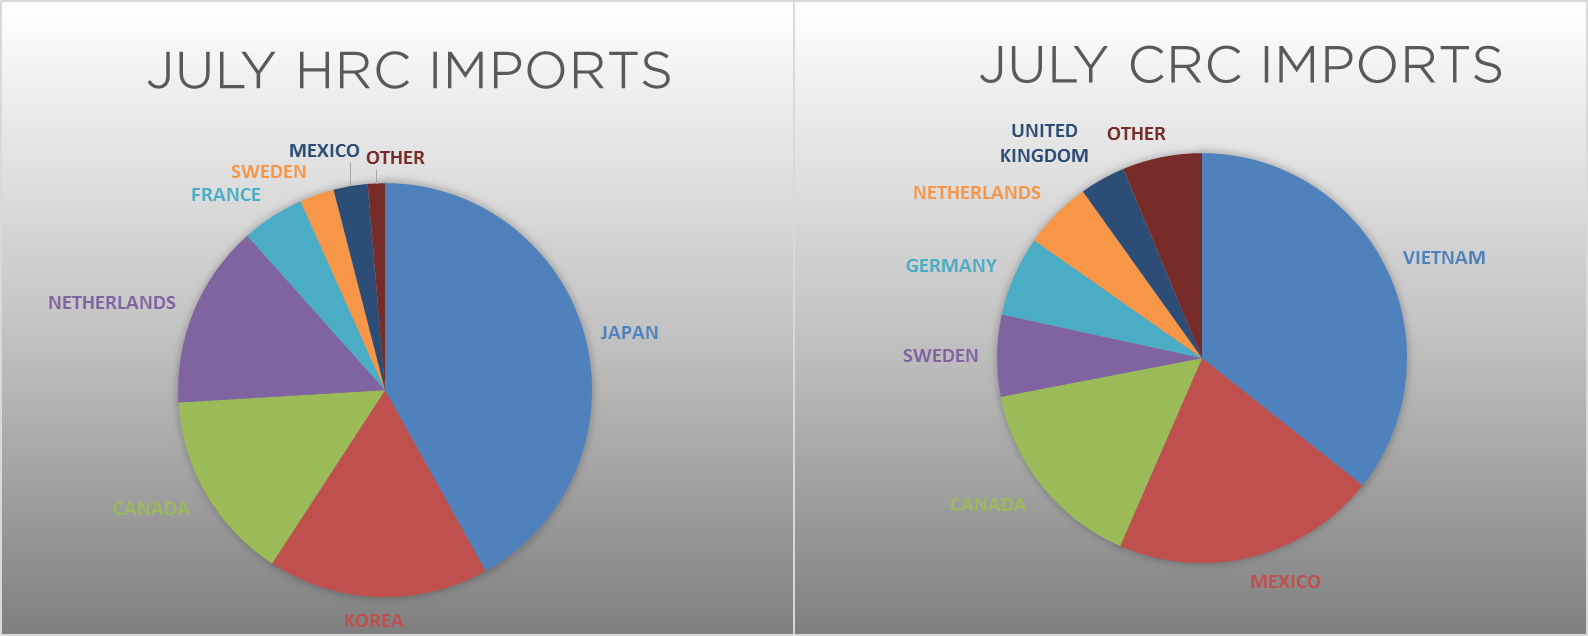
July flat rolled import license data is forecasting an increase to 798k, up 97k MoM.
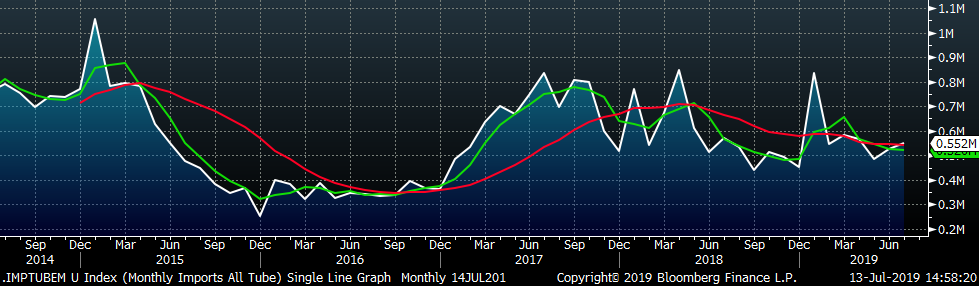
Tube import license data is forecasting a MoM increase of 28k to 552k tons in July.
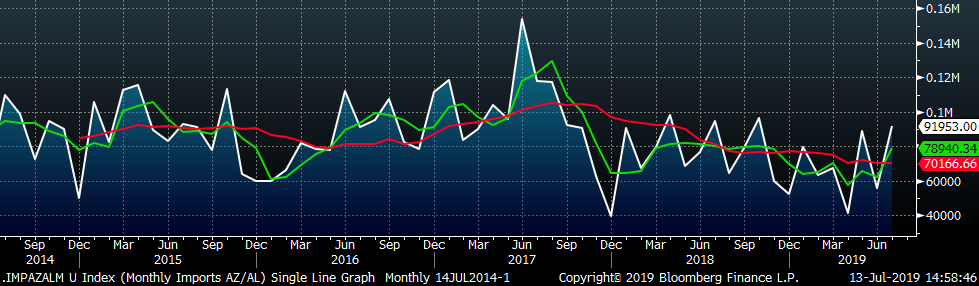
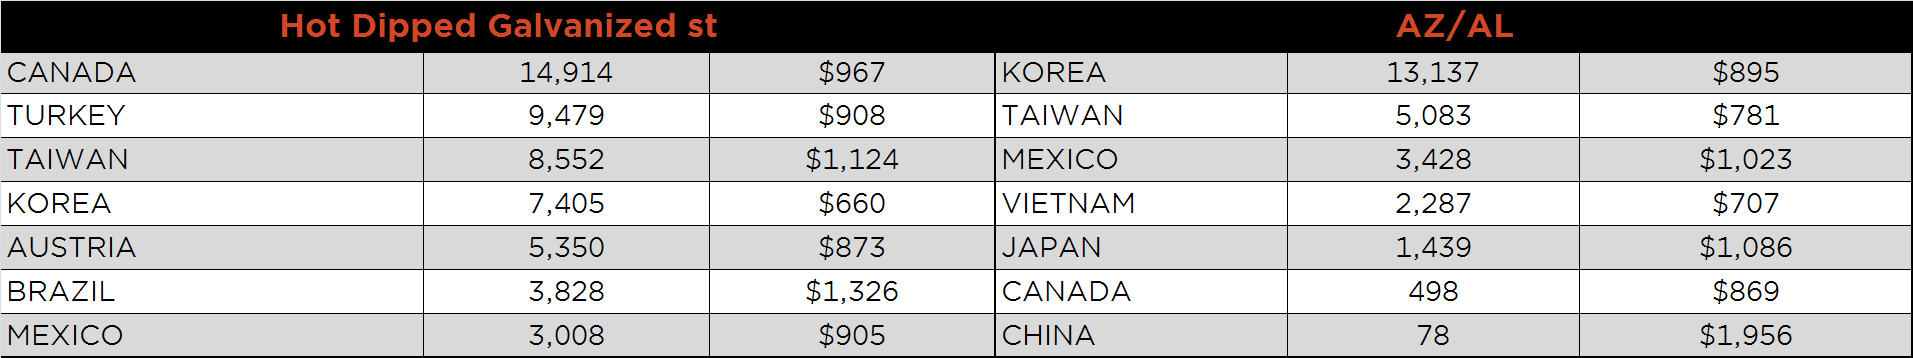
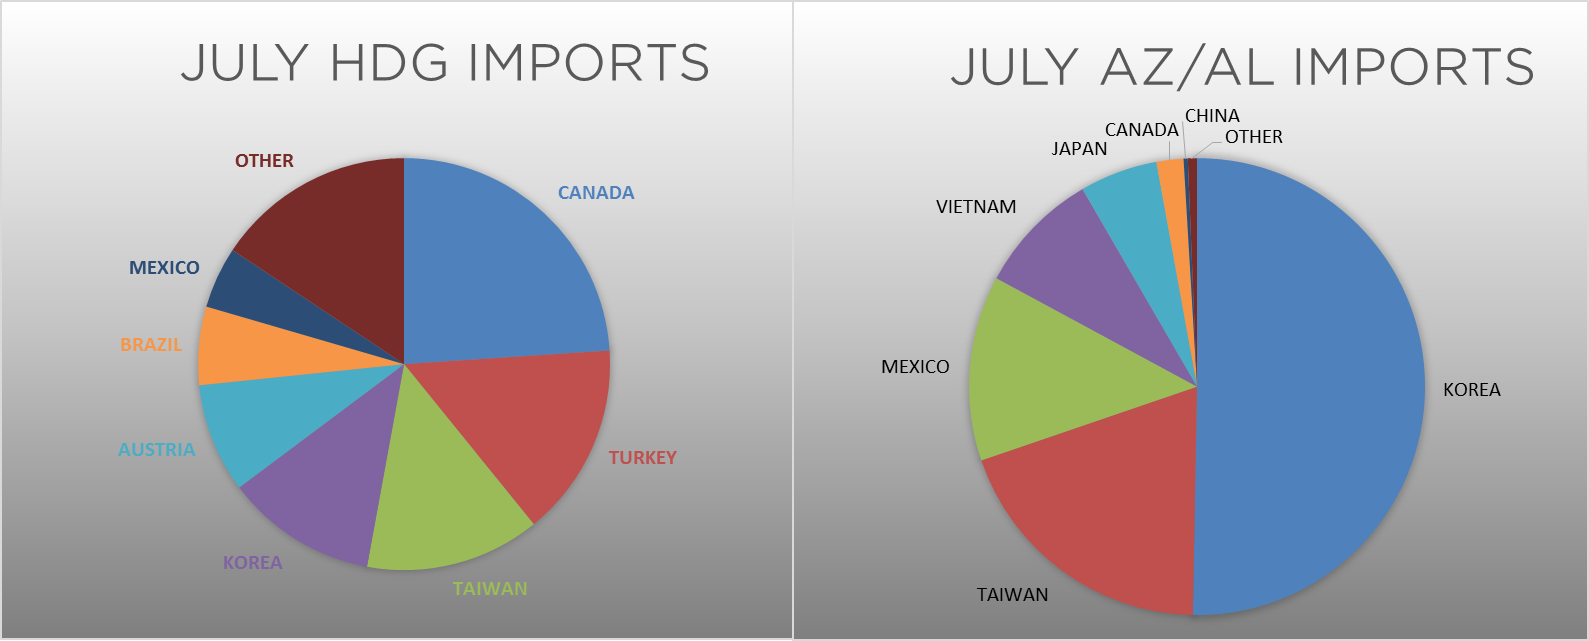
AZ/AL import licenses forecast an increase of 36k MoM to 92k in July.
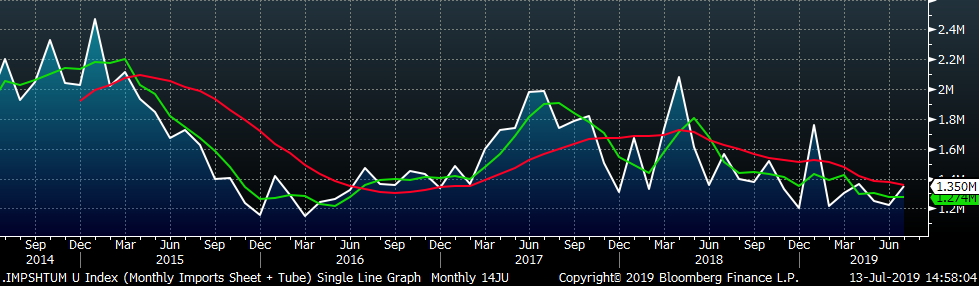
Below is June import license data through July 9, 2019.
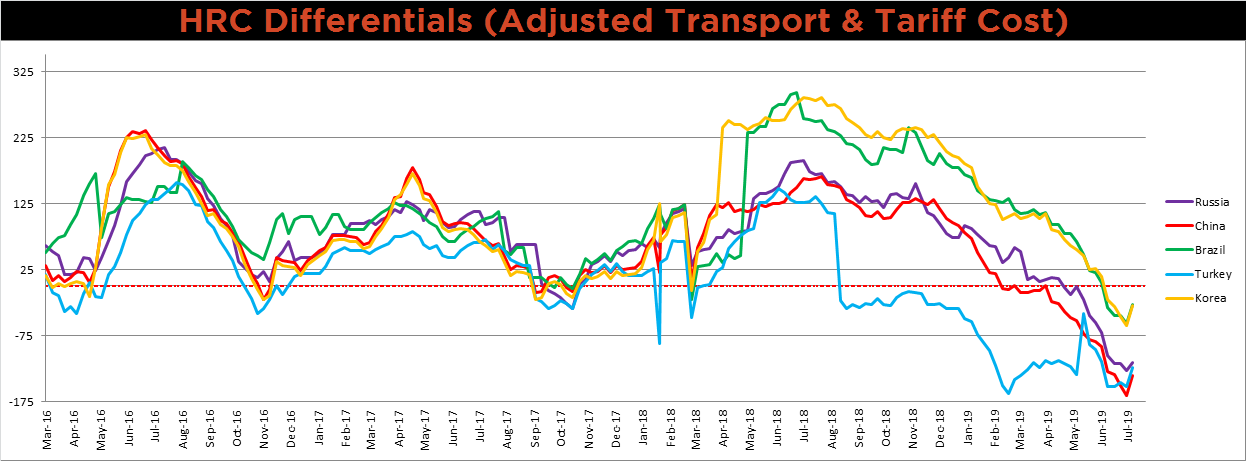
Below is the Midwest HRC price vs. each listed country’s export price using pricing from SBB Platts. We have adjusted each export price to include any tariff or transportation cost to get a comparable delivered price. The differentials all moved higher off the three year lows, reflecting the $45 increase to the Midwest HRC price.
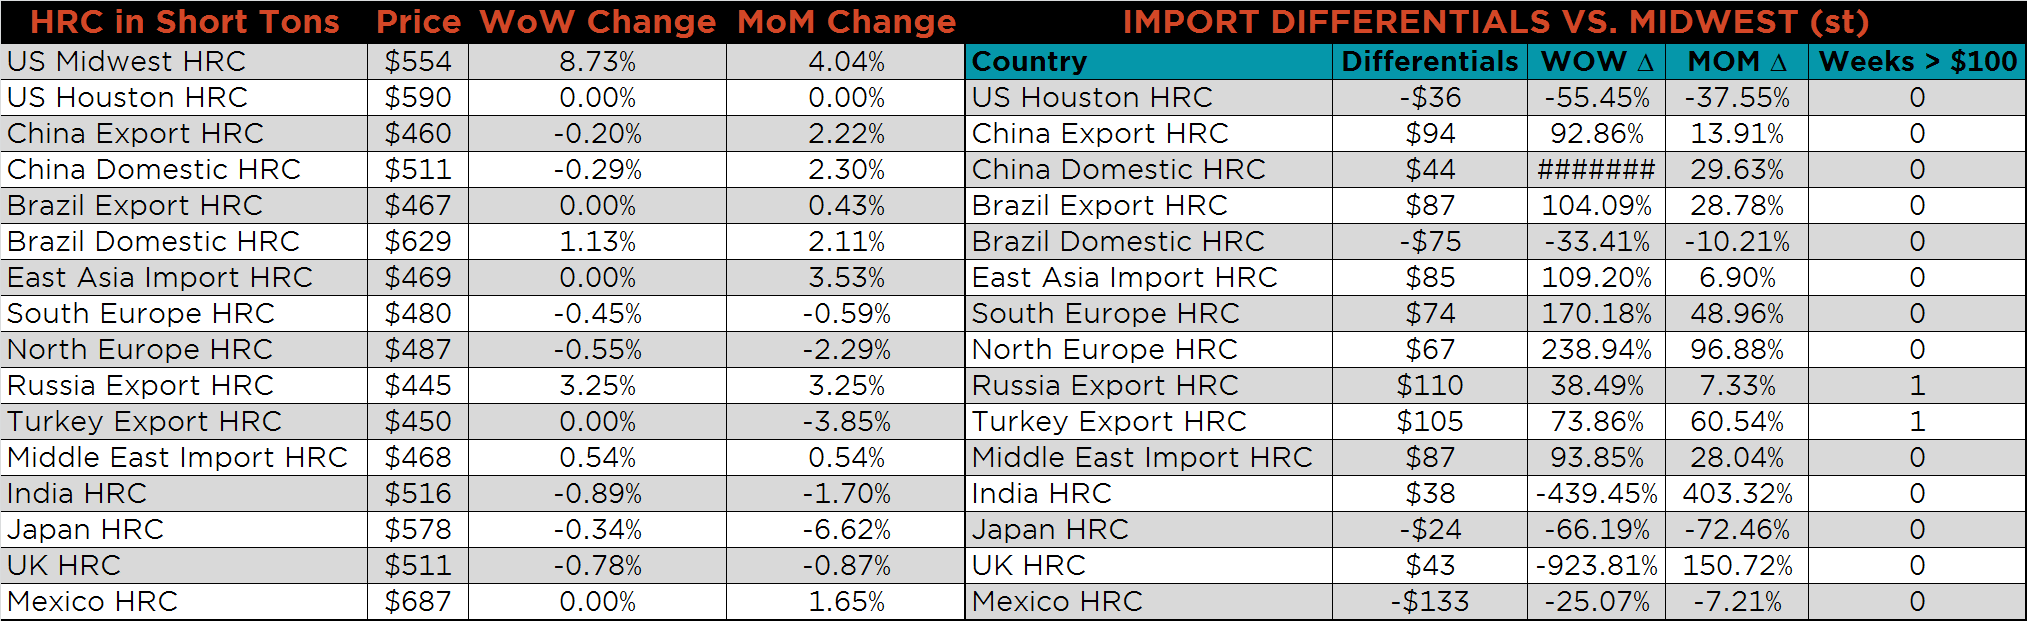
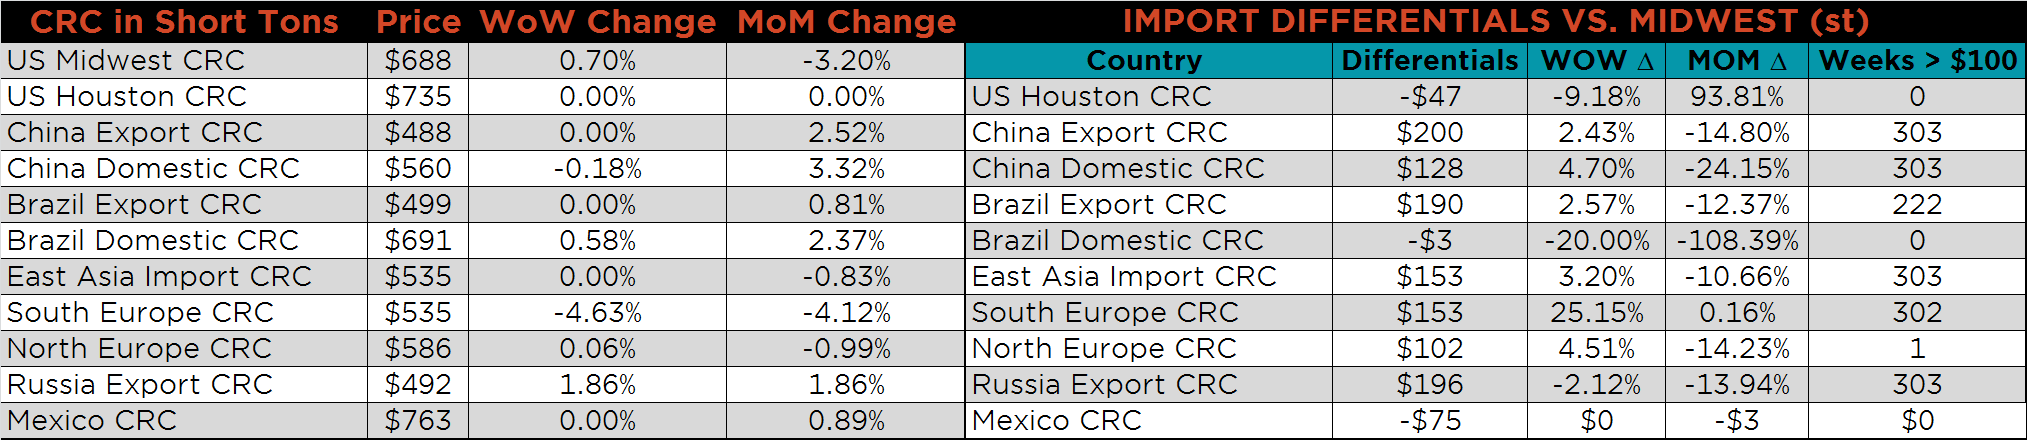
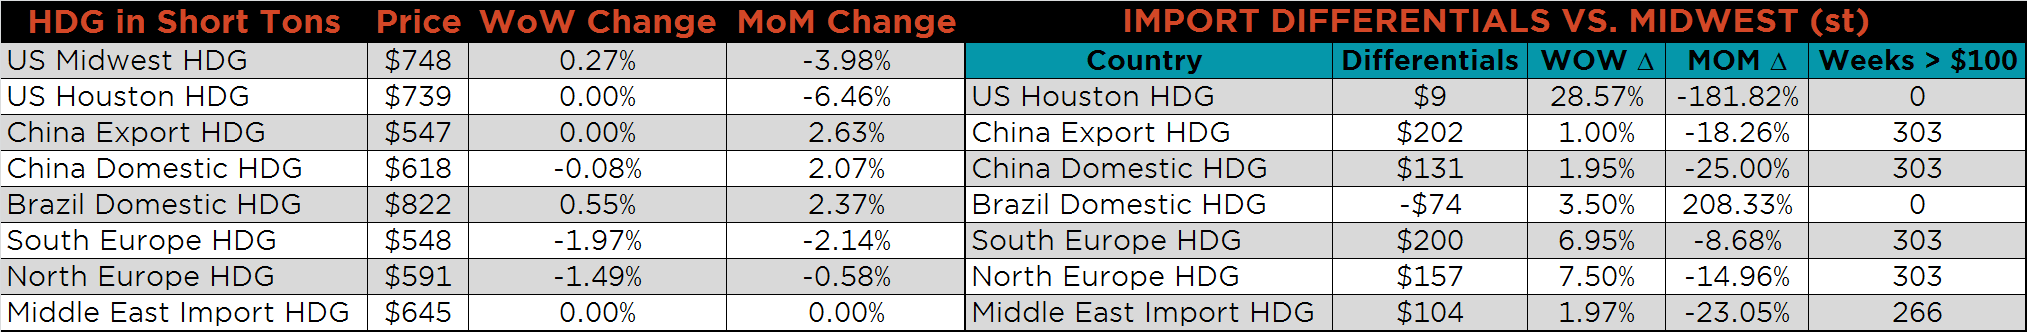
SBB Platt’s HRC, CRC and HDG pricing is below. Midwest HRC jumped 8.7%, and CRC and HDG were slightly higher on the week, up 0.79% and 0.3%, respectively. Russian HRC export prices were up 3.3%, while Southern European CRC prices were down 4.6%.

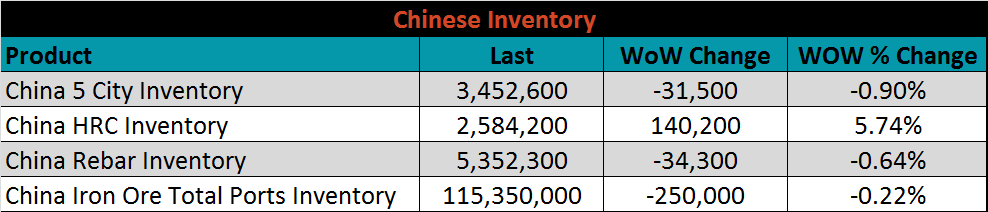
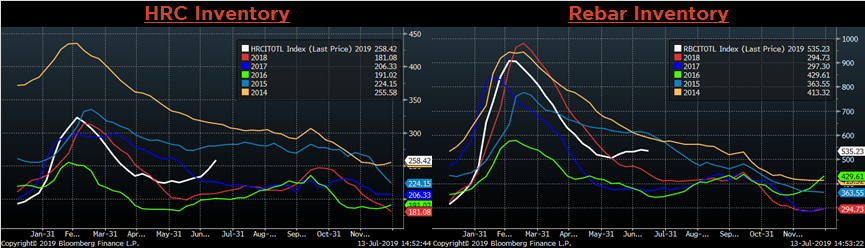
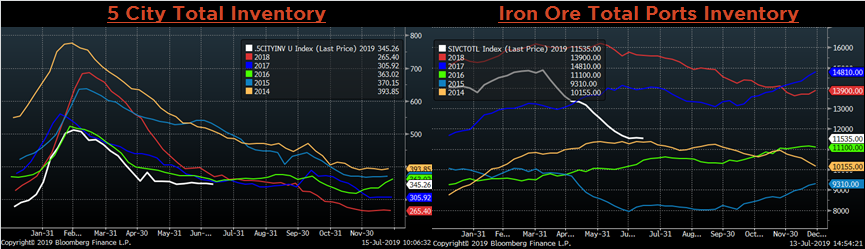
Below are inventory levels for Chinese finished steel products and iron ore. The 5-city inventory and iron ore ports inventory both decreased slightly. HRC inventory, however, continues to climb dramatically as Chinese mills increase production ahead of mandated cuts in the fourth quarter due to environmental restrictions. Increase inventory levels, along with continued economic pressure from the trade war, could weigh on China’s HRC price, which has remained elevated over the last month.
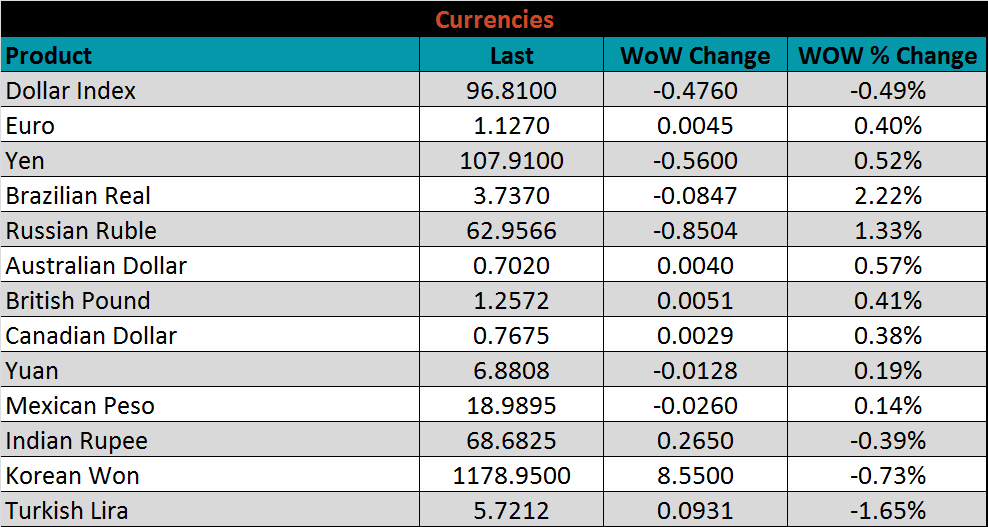
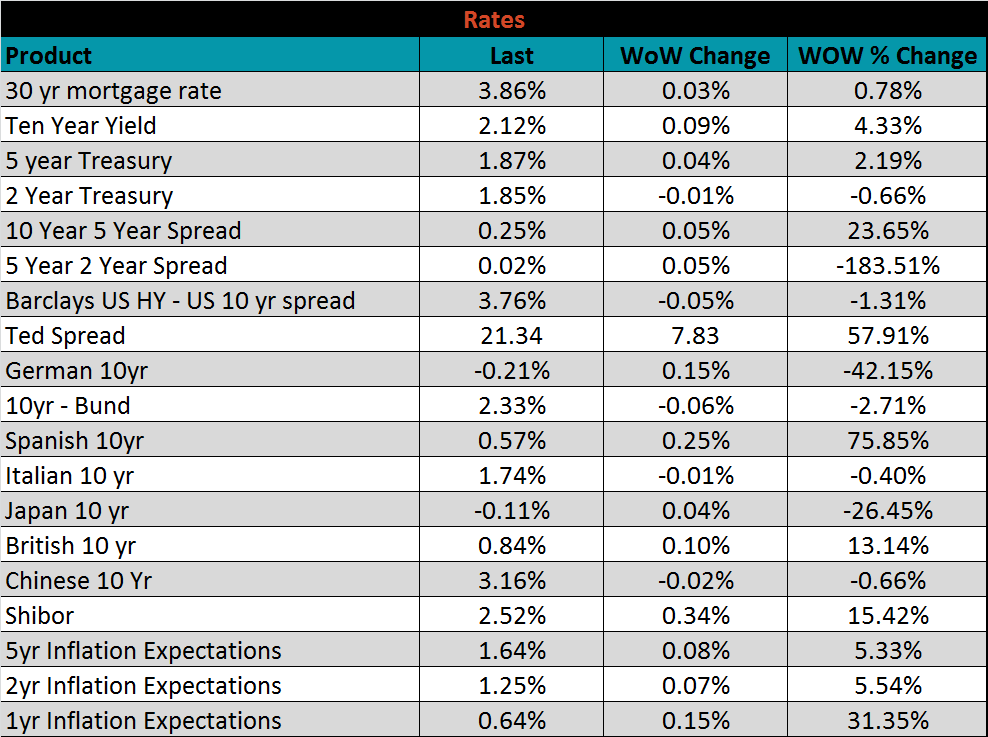
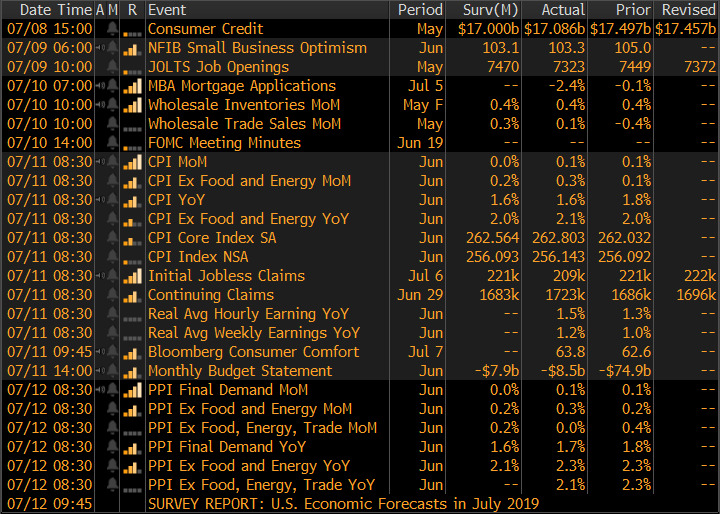
The remainder of the pertinent economic data is to the right. The FED Chair Jerome Powell stood before Congress for two days of hearings and signaled a 25 bps rate cut at the upcoming FOMC meeting in July. Additionally, CPI inflation reading printed at 1.6%, lower than the 2.0% target level of the Fed, increasing the likelihood of further rate cuts.
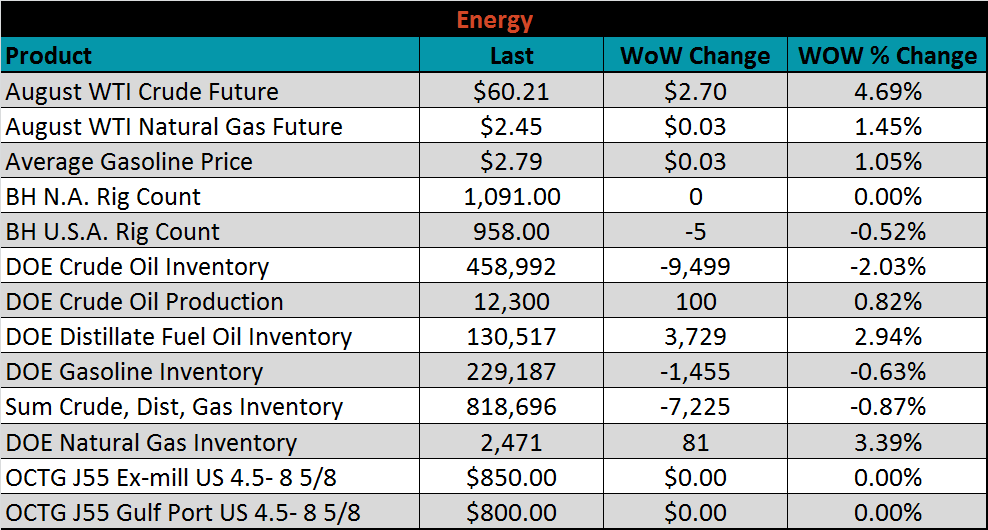
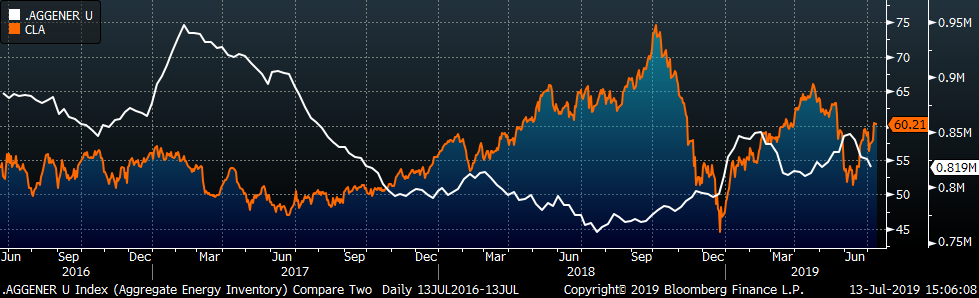
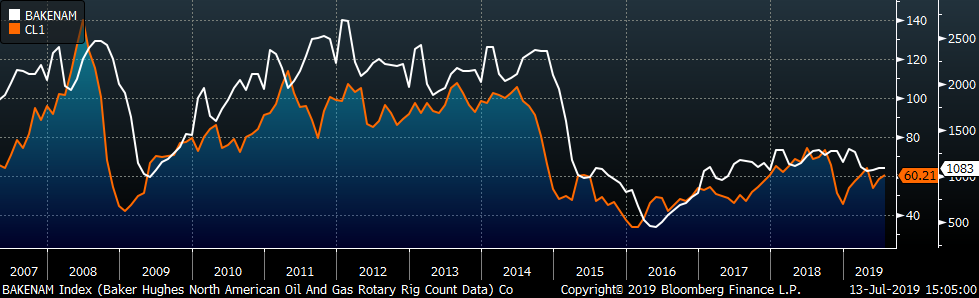
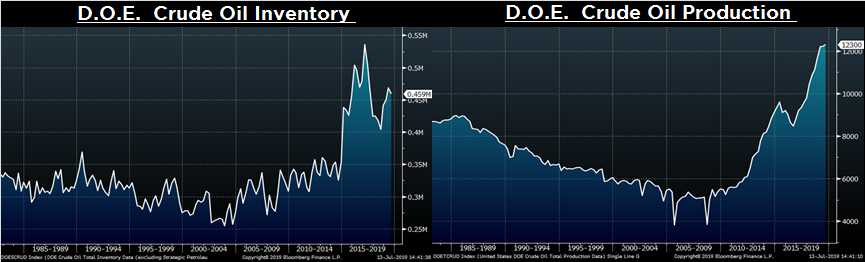
Last week, the Aug WTI crude oil future gained $2.70 or 4.7% to $60.21/bbl. The aggregate inventory level was down 0.9%, and crude oil production rose to 12.3m bbl/day. The Baker Hughes North American rig count was unchanged, while the U.S. count lost five rigs.
The list below details some upside and downside risks relevant to the steel industry. The orange ones are occurring or look to be highly likely. The upside risks look to be in control.
Upside Risks:
Downside Risks: