Content
-
Weekly Highlights
- Market Commentary
- Durable Goods
- Risks


Last week, this report identified imports as the most significant and relevant upside risk moving towards the end of the year. Before the Section 232 tariffs were implemented last spring, many steel distributers and users imported high levels of material to receive before they were subject to the 25% tariffs. However, after the tariffs were implemented, imports declined because the domestic vs world price differential, including tariff effects, was unattractive. Furthermore, the recent decline in domestic steel prices has made these differentials even more unattractive.
In order to quantify what this means for the domestic supply dynamic, we look at net imports (imports minus exports) over a trailing 12 month period. A trailing 12 month period is used because this incorporates the lead times and days on hand associated with imported material, and it gives a comparable annual level. The chart and graph below show this data, updated through June.

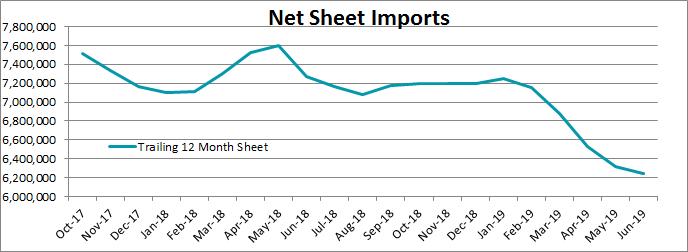
Compared to last June, there were over 900 thousand fewer tons of sheet products in the domestic market. Moreover, our forecast for July and August final imports remains at the low levels we have seen already in the second quarter, and we could see further declines as we move through the third quarter based on the extremely low price differentials reached in June and July. This would result in an immediate supply shock that would drive orders to domestic mills, and push lead times out in the short term. However, as price differentials revert to normal levels, and global economic uncertainty discourages fixed asset investment, this deficit may be short-lived.

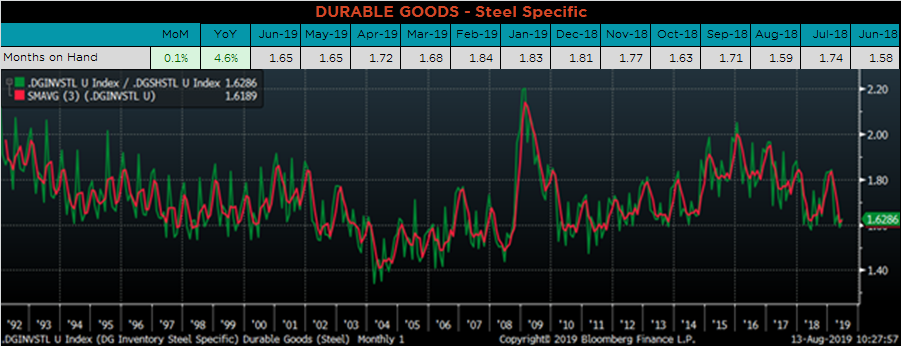
Below are final June new orders from the Durable Goods report. Overall, new orders were lower YoY, primarily because of transportation down 11.7%. Transportation equipment has been down four of the last five months on a YoY basis. The final chart looks at the months on hand (inventory divided by shipments) for durable goods categories that are steel intensive. While the months on hand have increase since last year, they are still at low levels compared to historically turbulent times in the steel market.



Below are the most pertinent upside and downside price risks:
Upside Risks:
Downside Risks:

The Platts TSI Daily Midwest HRC Index was down $1 to $598.

The CME Midwest HRC futures curve is shown below with last Friday’s settlements in white. The curve showed little change last week.

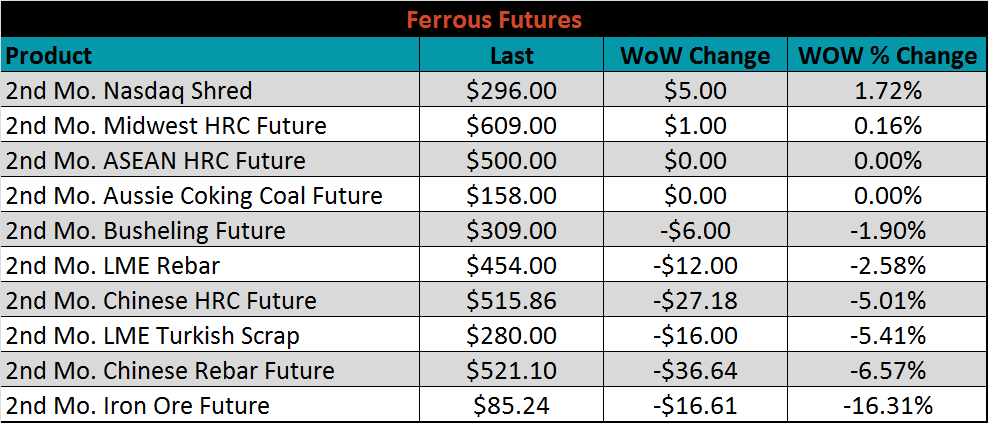
September ferrous futures were mostly lower. Iron ore lost another 16.6%, while Nasdaq shred gained 1.7%.
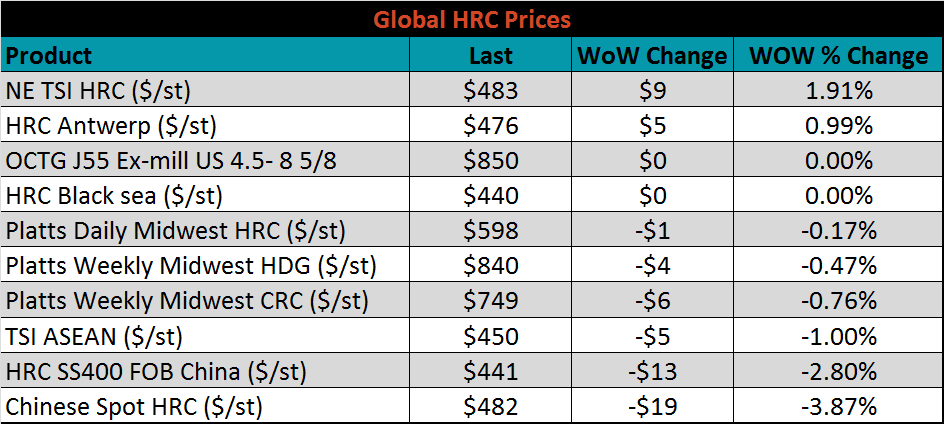
The global flat rolled indexes were mixed. The North Europe TSI index was up 1.9%, while the Chinese Spot HRC price was down 3.9%.
The AISI Capacity Utilization Rate rose another 0.6% last week to 81.5%, still above the 80% goal set by the Trump administration. As the end of the year approaches, production and utilization rates will likely depend on import levels.


August flat rolled import license data is forecasting a decrease of 136k to 644k MoM.

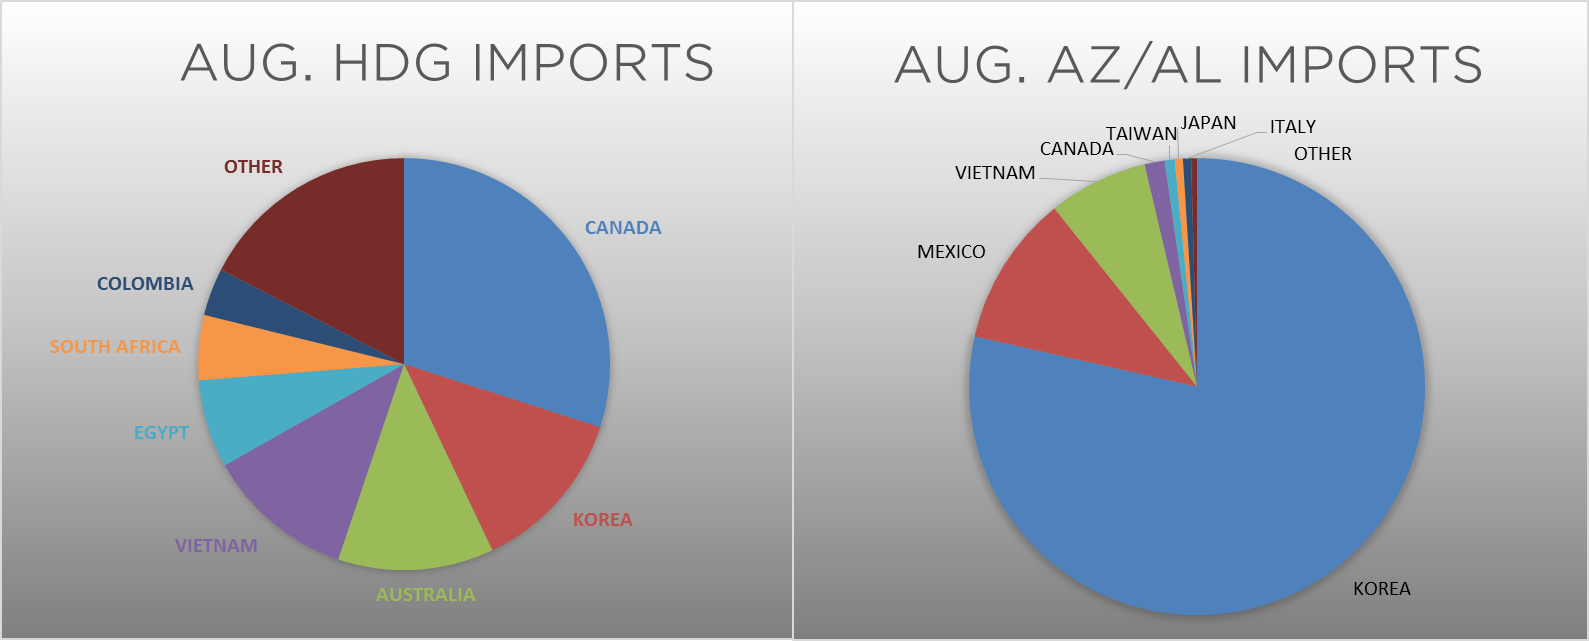
Tube import license data is forecasting a MoM decrease of 89k to 447k tons in August.


AZ/AL import licenses are forecast to increase 52k in August to 115k.

Below is July import license data through August 6, 2019.

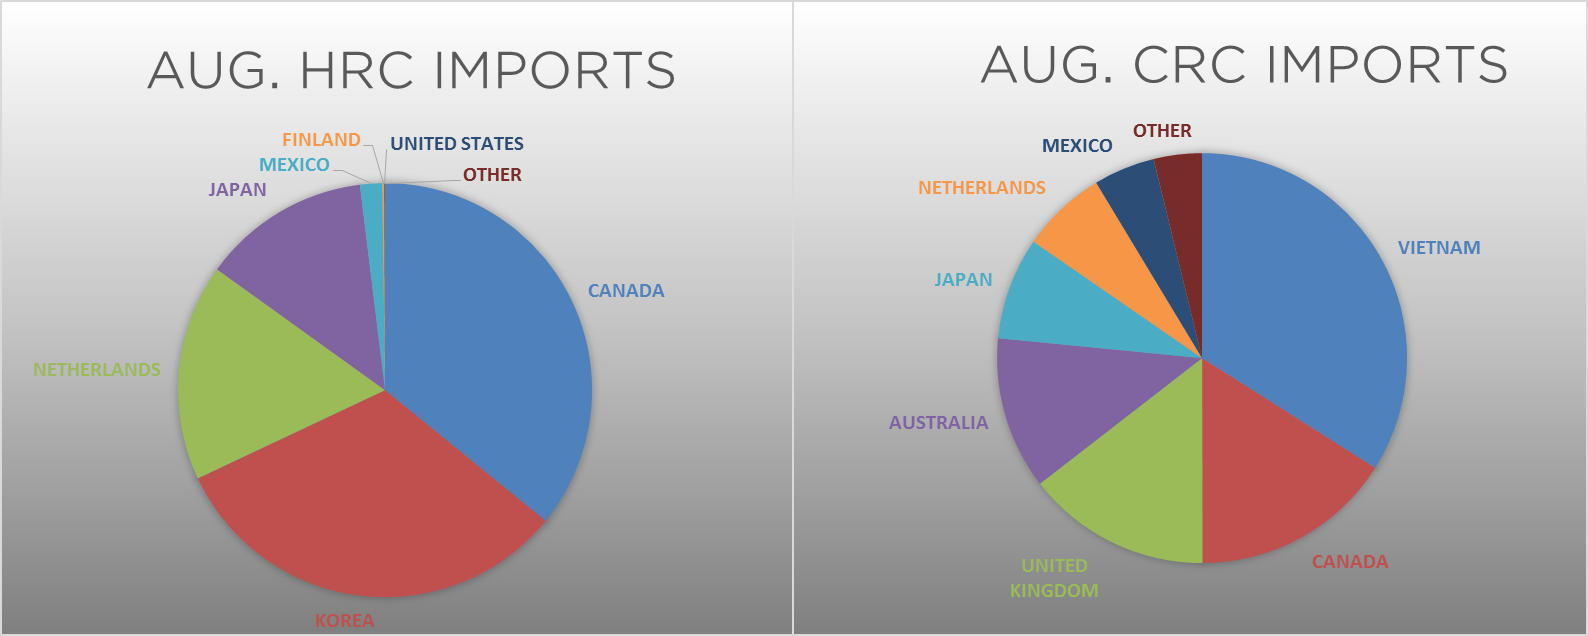

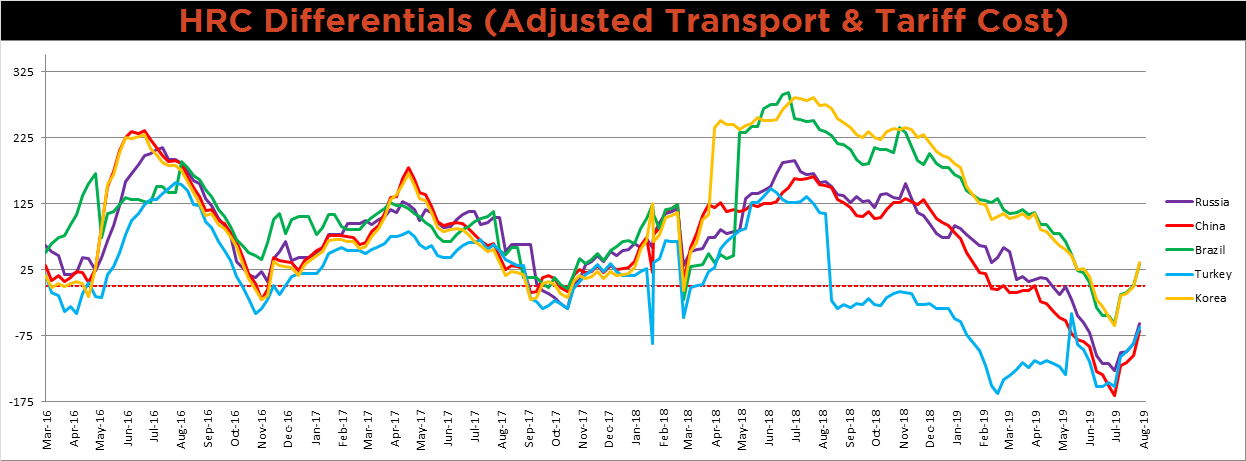
Below is the Midwest HRC price vs. each listed country’s export price using pricing from SBB Platts. We have adjusted each export price to include any tariff or transportation cost to get a comparable delivered price. Differentials continue to increase as U.S. domestic prices remain stable, while global prices experience downward pressure off weakened global demand.
SBB Platt’s HRC, CRC and HDG pricing is below. Midwest HRC, CRC and HDG prices were slightly lower on the week while the Chinese HRC and CRC prices were down more significantly, 2.8% and 1.6%, respectively.


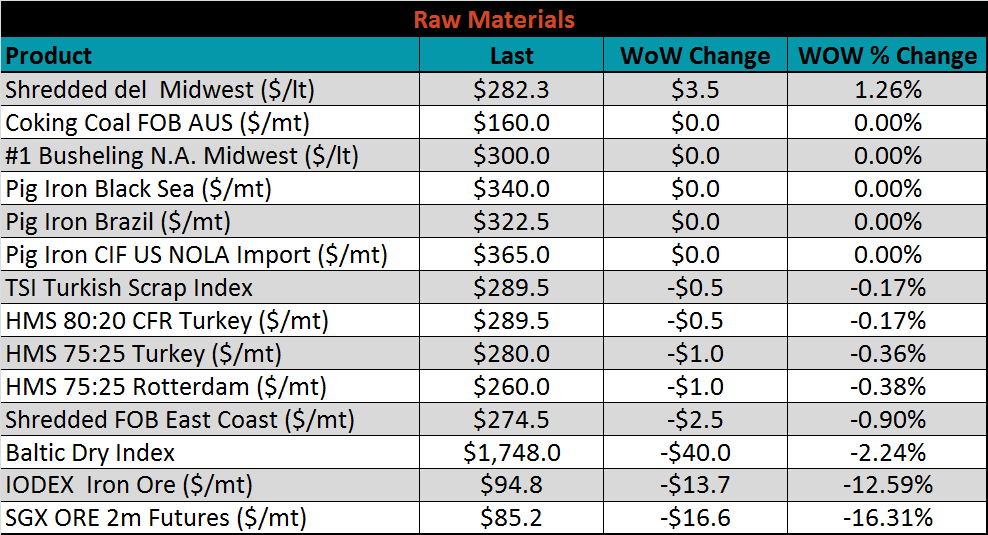
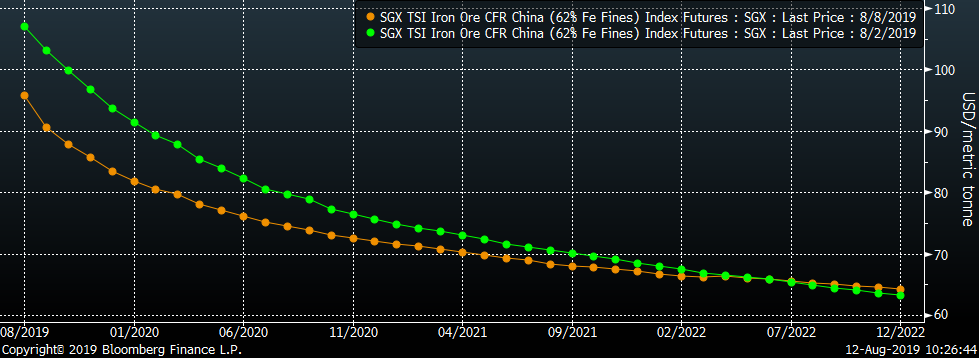
Raw material prices remained relatively stable, except in iron ore. Iron ore futures were down 16.3% while the IODEX was down 12.6%.
Below is the iron ore future curve with Friday’s settlments in orange, and the prior week’s settlements in green. Last week the front of the curve sold off significantly, creating a flatter curve.
The ex-flat rolled prices are listed below.


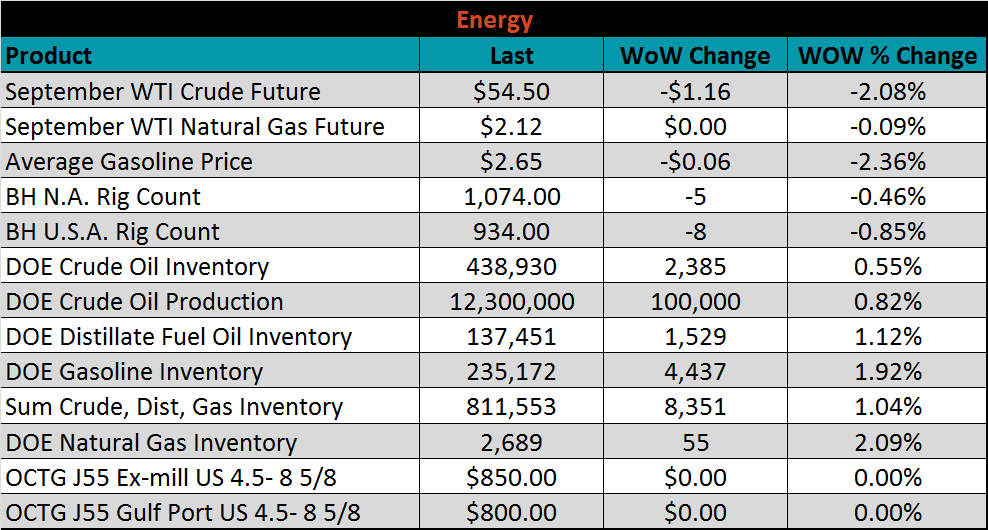
Last week, the Sep WTI crude oil future lost $1.16 or 2.1% to $54.50/bbl. The aggregate inventory level was up 1%, and crude oil production rose back to 12.3m bbl/day. The Baker Hughes North American rig count lost five rigs and the U.S. count lost another eight rigs.


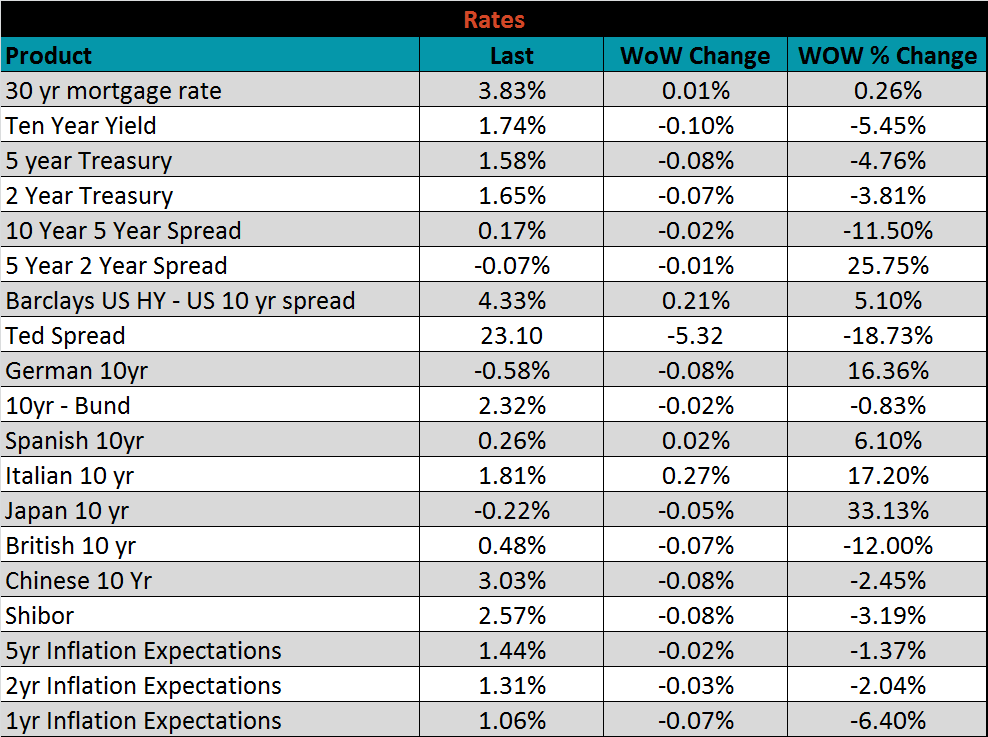
The U.S. 10-year yield was down 10 bps, closing the week at 1.74%. The German 10-year yield was down another 8 bps to minus 0.58% and the Japanese 10-year yield was down 5 bps to minus 0.22%. Yields across globe have collapsed in August among trade war uncertainties.


The list below details some upside and downside risks relevant to the steel industry. The orange ones are occurring or look to be highly likely. The upside risks look to be in control.
Upside Risks:
Downside Risks: