Content
-
Weekly Highlights
- Market Commentary
- Durable Goods
- Risks


Spot prices declined last week, as mills lowered offers in order to attract spot buyers. While prices began to decline several weeks ago, the move last week was the largest weekly decline we have seen this year, which is likely due to a shift in mills’ focus. Many of the long-term contracts offered by mills fix price based on spot indexes in the second week of the month, often at a discount. Now that these contracts have a locked in price, mills are shifting away from holding higher spot offers towards increased negotiation in order to fill order books. The fact that order books have holes, and lead times continue to decline, signals that lower spot prices may be available in the near future.
This view is apparent in the expectations displayed in the forward curve with the March contract trading about $20 below the February contract. March settled last week at $553, among the lowest levels we have seen this year.

The March contract moved into the current range near $550 at the very end of January when the coronavirus fears were highest. We also saw other commodity and financial markets fall at the same time including copper, aluminum, iron ore, scrap, crude oil and interest rates. However, all of these other markets have recovered since their late January lows, except for domestic HRC. The recovery in the scrap market and iron ore markets are most significant in terms of determining the domestic HRC outlook.
Below is a chart of the March busheling future contract, showing the decline into the end of January, and the ensuing recovery this month.

This contract can give insight into the market’s expectations for the March scrap trade, and it closed last week at $283, down $4 from February’s settlement. However, this is over $20 higher than its close two weeks ago, and well above the $20 drop expected in the HRC market. If the March scrap buy is flat to higher, mills will gain leverage in negotiations, and may even try to increase prices. This leads us to believe the March HRC future appears undervalued, and the next floor in HRC pricing may be higher than previously thought.

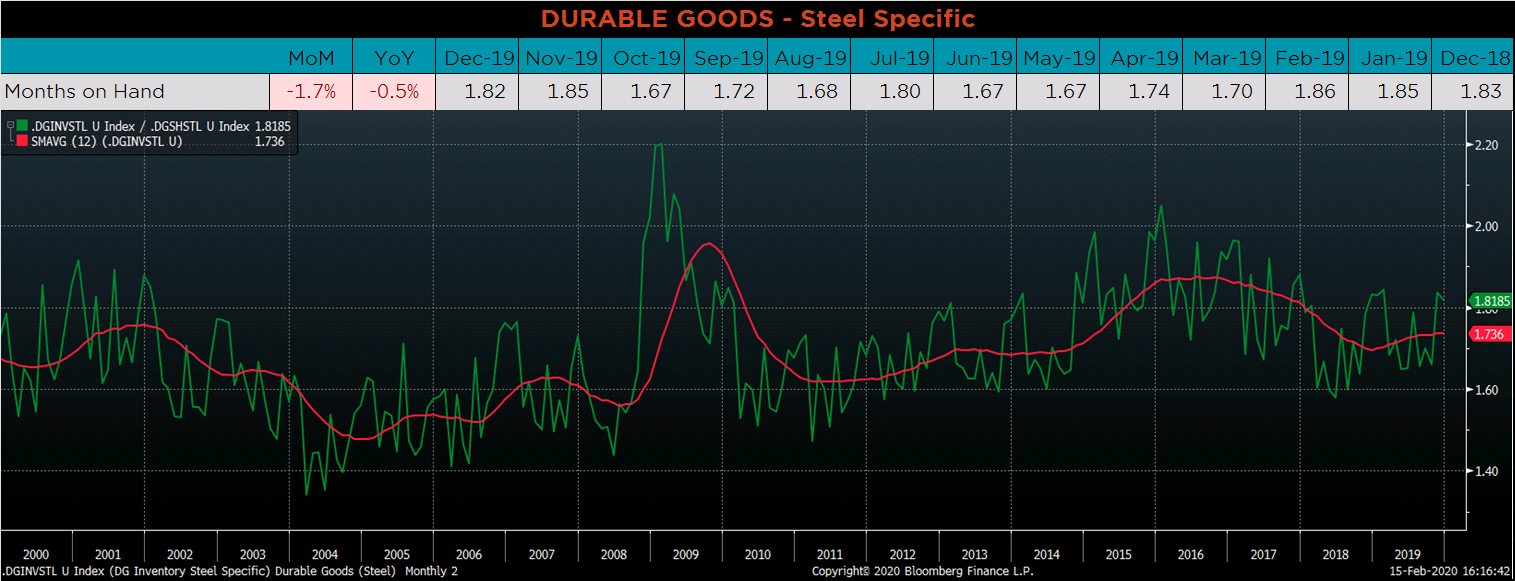
Below are final December new orders from the Durable Goods report. Overall, new orders for Durable Goods were higher MoM, but lower YoY. Manufacturing new orders ex-transportation increased compared to December 2018. The final chart looks at the months on hand (inventory divided by shipments) for durable goods categories that are steel intensive. MOH declined slightly as monthly shipments were flat and inventories declined at year-end.



Below are the most pertinent upside and downside price risks:
Upside Risks:
Downside Risks:

The Platts TSI Daily Midwest HRC Index was down $16.50 to $571.

The CME Midwest HRC futures curve is below with last Friday’s settlements in white. The curve was relatively flat, dipping slightly in the middle.

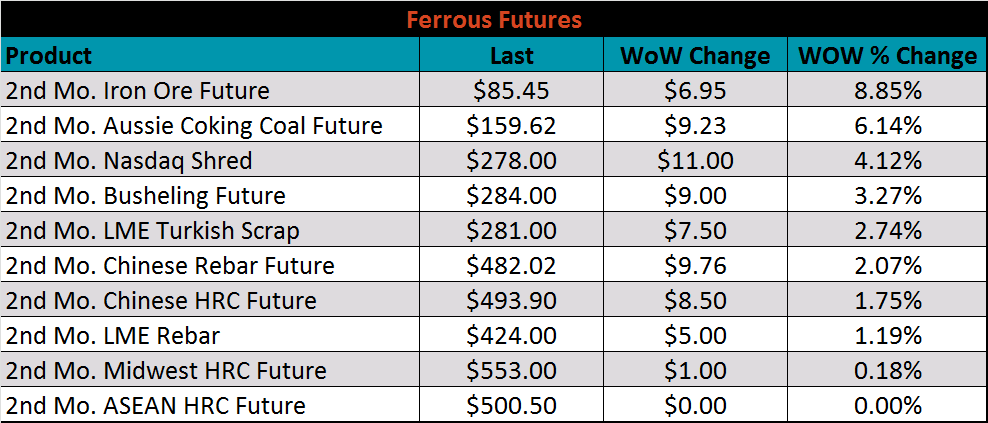
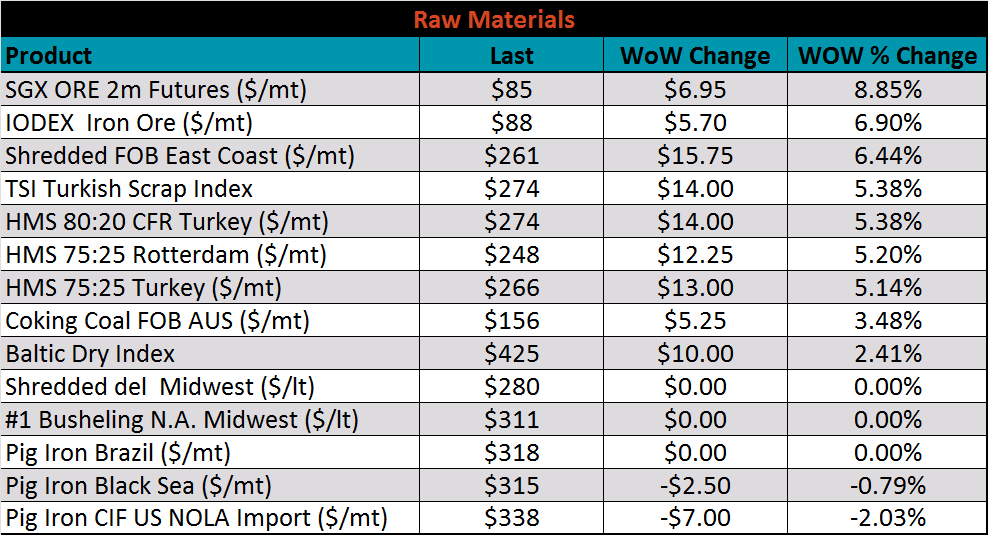
March ferrous futures were all higher. The iron ore future gained 8.9%.
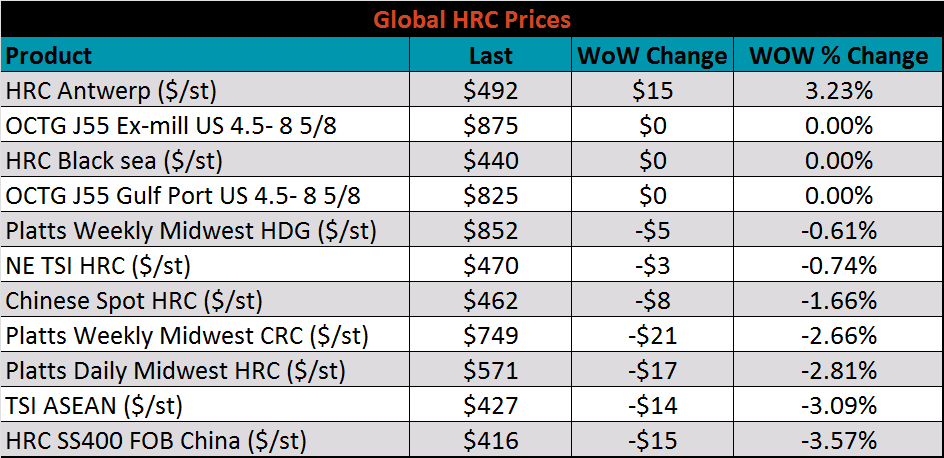
The global flat rolled indexes were mixed. HRC Antwerp was up 3.2%, while Chinese Export HRC was down 3.6%.
The AISI Capacity Utilization Rate was down 0.7% to 81.4%.


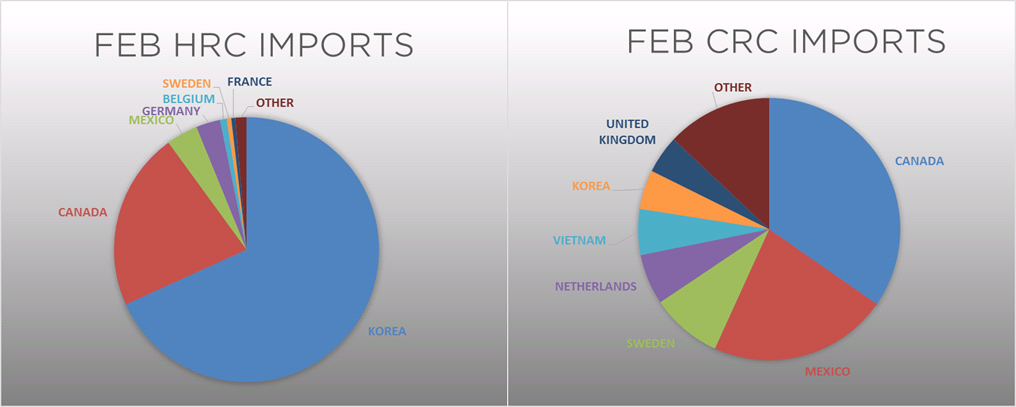
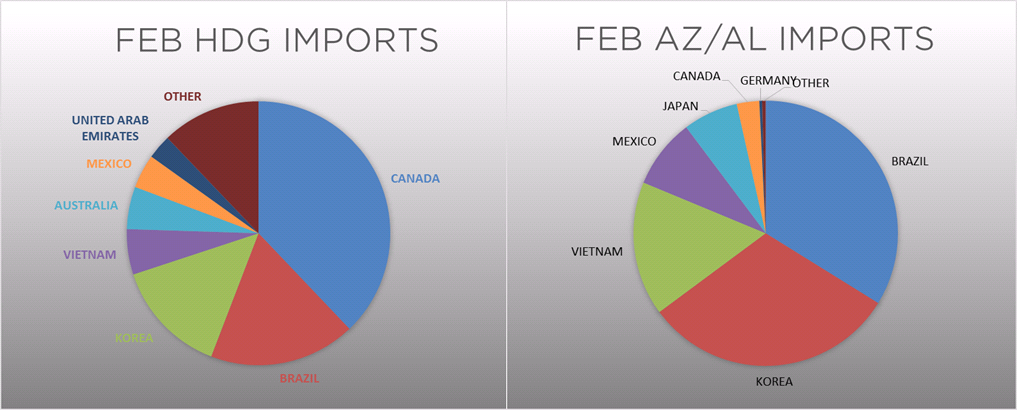
February flat rolled import license data is forecasting a decrease of 7k to 726k MoM.

Tube imports license data is forecasting a MoM decrease of 51k to 290k tons in February.


AZ/AL import license data is forecasting an increase of 5k in February to 70k.

Below is January import license data through February 11, 2020.


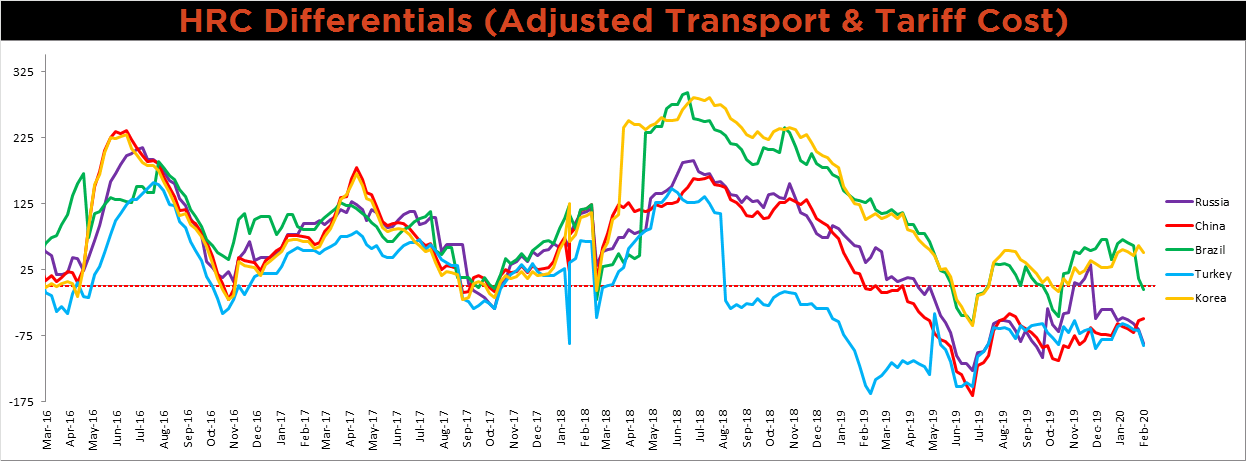
Below is the Midwest HRC price vs. each listed country’s export price using pricing from SBB Platts. We have adjusted each export price to include any tariff or transportation cost to get a comparable delivered price. The Chinese differential rose, while the Brazilian, Turkish, Korean and Russian differentials moved lower.
SBB Platt’s HRC, CRC and HDG pricing is below. The Midwest HRC, CRC and HDG prices were down, 2.8%, 2.7% and 0.6%, respectively. The Chinese HRC and CRC prices were down 3.6% and 2.3%, respectively.


Raw material prices were mostly flat or higher, led by iron ore futures, up 8.9%.
Below is the iron ore future curve with Friday’s settlments in orange, and the prior week’s settlements in green. The entire curve shifted higher, most significantly in the front.

The ex-flat rolled prices are listed below.


Below are inventory levels for Chinese finished steel products and iron ore. 5 City, HRC and rebar inventory levels increased dramatically, while iron ore port inventory was flat. The demand outlook is uncertain, as coronavirus effects and a government stimulus response remain to be seen.


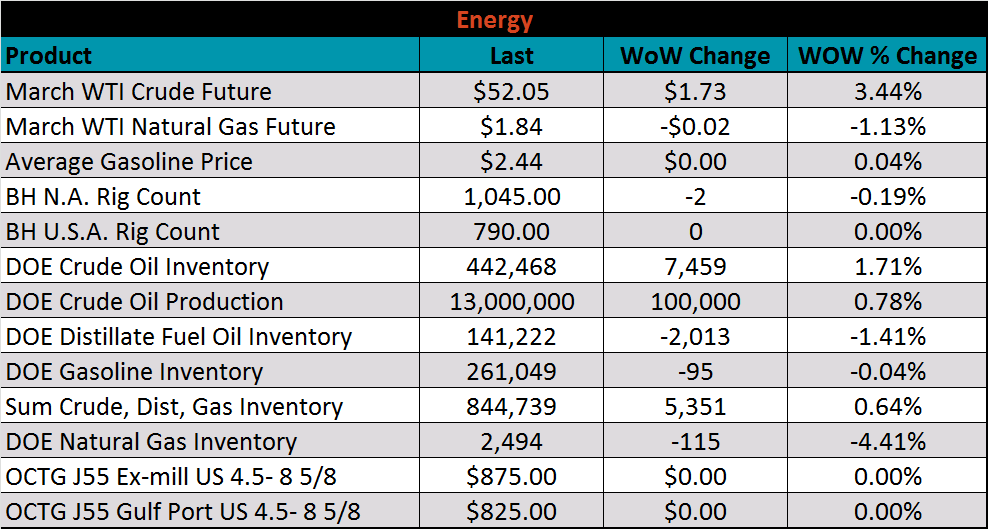
Last week, the March WTI crude oil future gained $1.73 or 3.44% to $52.05/bbl. The aggregate inventory level was up 0.6% and crude oil production increased to 13m bbl/day. The Baker Hughes North American rig count was down two rigs, while the U.S. rig count was flat.


The list below details some upside and downside risks relevant to the steel industry. The orange ones are occurring or look to be highly likely. The upside risks look to be in control.
Upside Risks:
Downside Risks: