Content
-
Weekly Highlights
- Market Commentary
- Durable Goods
- Risks


Last week, the slow rally in spot HRC prices took a pause, as physical transactions were limited among a wide range of offer prices. Mills with full order books have maintained their offers well above $500/st for HRC, trying to capture their recent price increase targeting $540. However, some offers slid at mills with very short lead times, signaling weaker order books despite continued low levels of production. The next few weeks will likely see mills attempting to fill their order book for July, with buyers having the upper hand in negotiations. One dynamic that will affect the mills’ willingness to negotiate is their scrap outlook, which we will analyze below.
Due to the functions of a mill and its profitability, scrap prices and finished steel prices are correlated over extended periods. However, supply and demand dynamics in each market can cause short-term dislocations to the relationship between prices. The below chart shows this historical correlation, as well as certain periods of diverging prices between scrap and HRC.
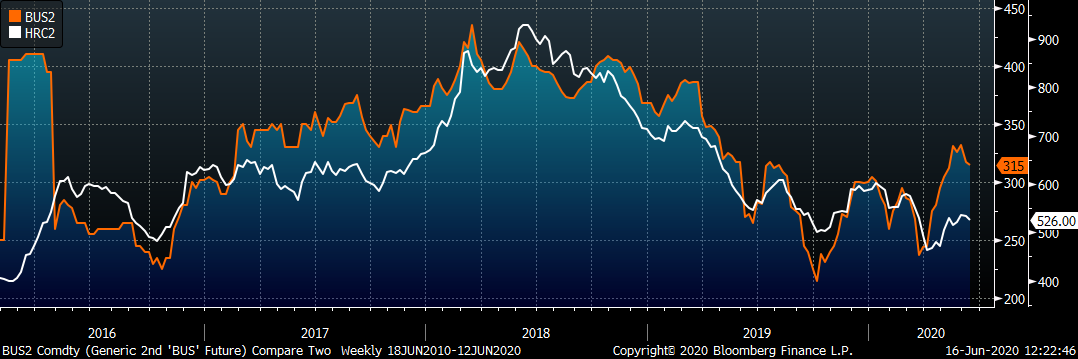
Busheling scrap prices have rallied since late spring, hitting their highest level in over a year this month, driven by a shortage of scrap created by the recent economic shutdown. While HRC price also moved higher during that period, the price increased only slightly, creating the current “gap” between the two. Looking forward, there is also a divergence in the price outlook for each market. The HRC forward curve is expecting further, steady price increases, while the busheling curve shows a decline to about $300/t expected in July, bringing this relationship back in line.
However, history tells us that forward curves are poor predictors of future prices, and should scrap prices perform differently, there will be ramifications for the finished product markets. If the scrap market remains strong over the next few months, mills will have cover to raise steel prices, likely at a faster rate than the curve is predicting in order to protect their currently depressed profitability. Should scrap prices continue to decline throughout the summer, it is likely that HRC prices will follow, as mini mills’ expanding profitability would allow them to sell spot tons at lower prices. This scenario appears likely, as scrap generation should increase over the next few months among a reopening economy, solving the supply shortage that drove prices to the current levels.
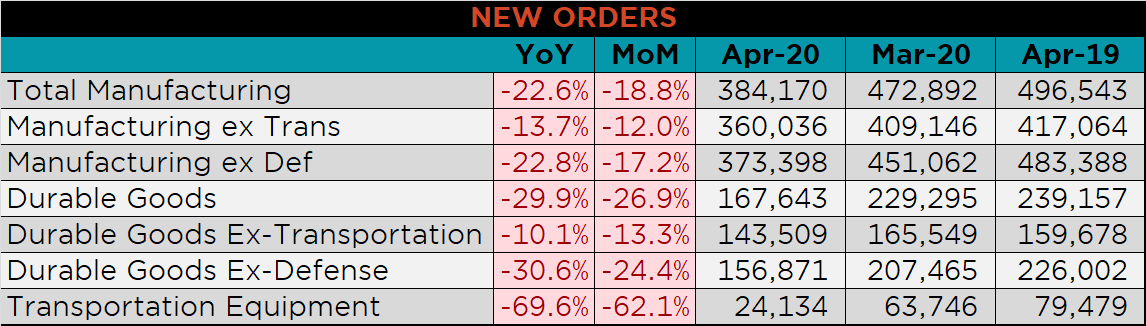
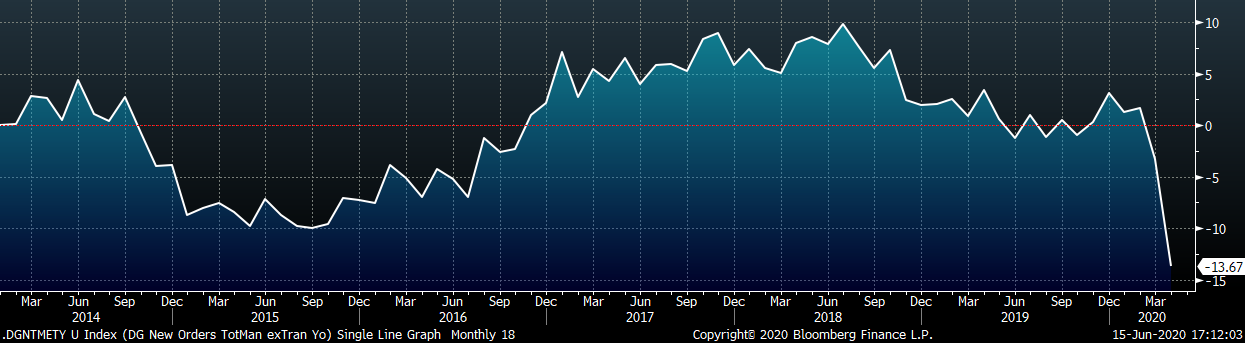
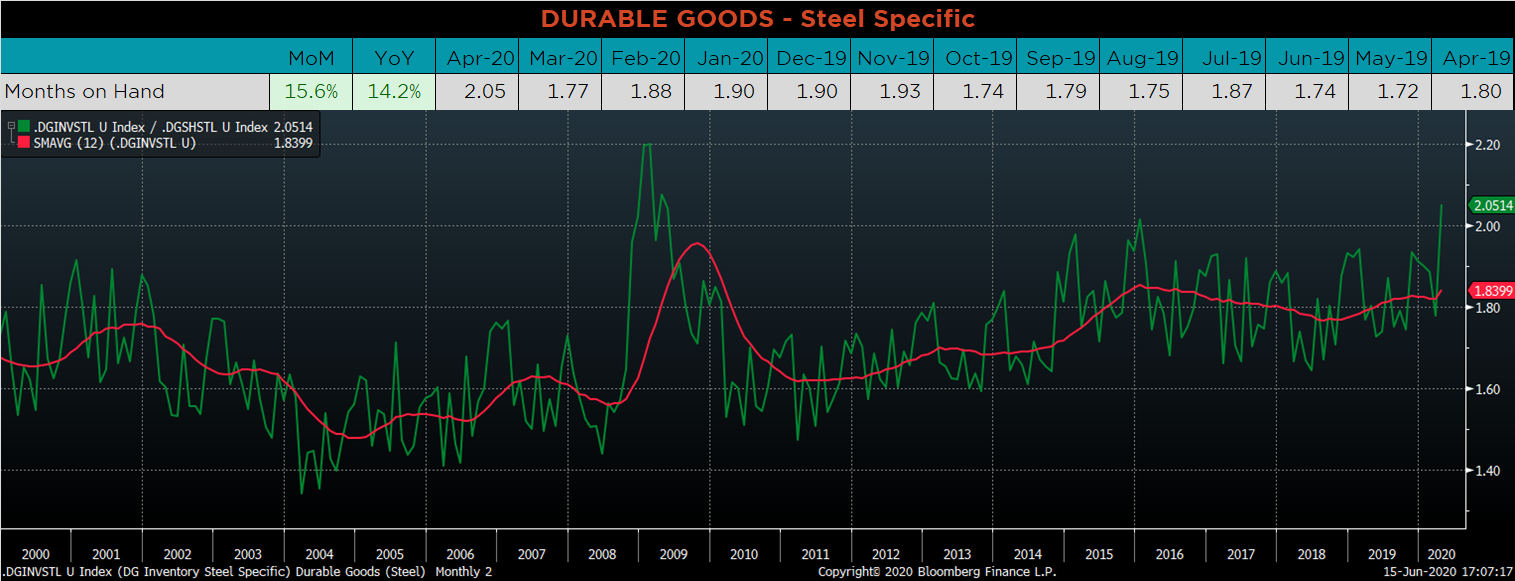
Below are final April new orders from the Durable Goods report. Overall, new orders for manufactured goods were down significantly MoM, and YoY. Manufacturing new orders ex-transportation decreased 13.7% compared to April 2019. The final chart looks at the months on hand (inventory divided by shipments) for durable goods categories that are steel intensive. MOH increased significantly, as monthly inventories were essentially unchanged compared to decreasing shipments.
Below are the most pertinent upside and downside price risks:
Upside Risks:
Downside Risks:
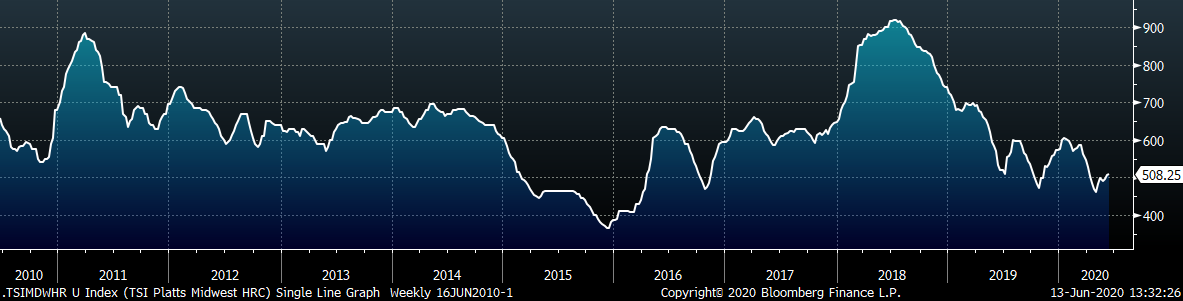
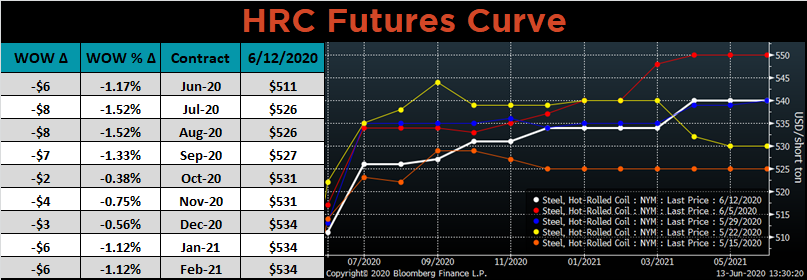
The Platts TSI Daily Midwest HRC Index was up $1 to $508.25.
The CME Midwest HRC futures curve is below with last Friday’s settlements in white. Last week the entire curve shifted lower.
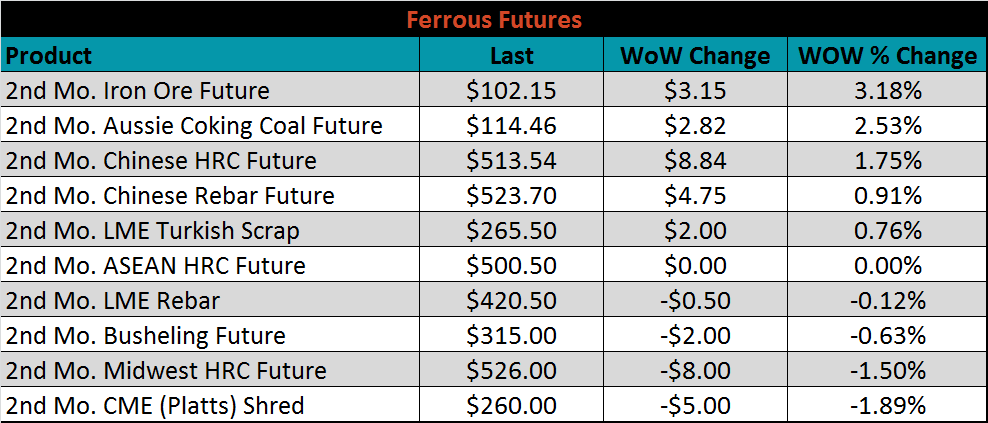
July ferrous futures were mixed. The iron ore future gained 3.2%, while the shredded scrap future lost 1.9%.
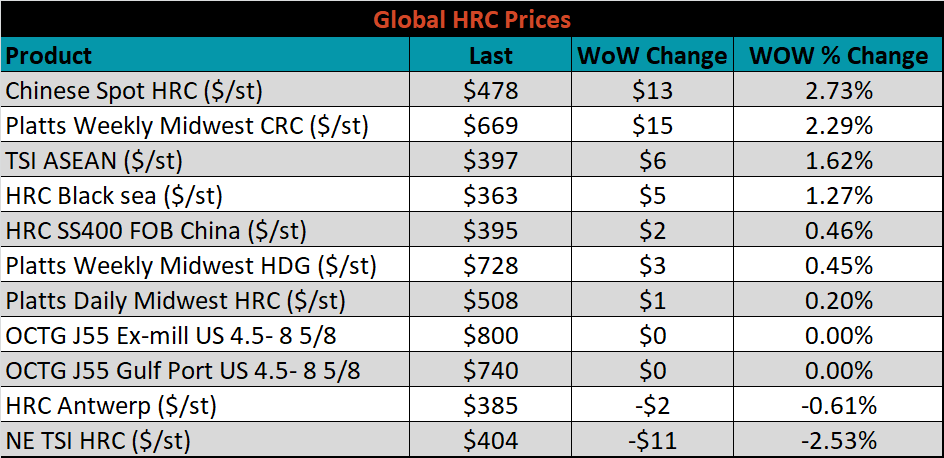
The global flat rolled indexes were mostly higher, led by Chinese spot HRC, up 2.7%. Northern European HRC on the other hand, continued to slip, down another 2.5%.
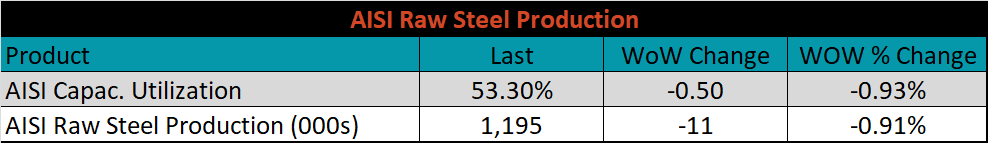
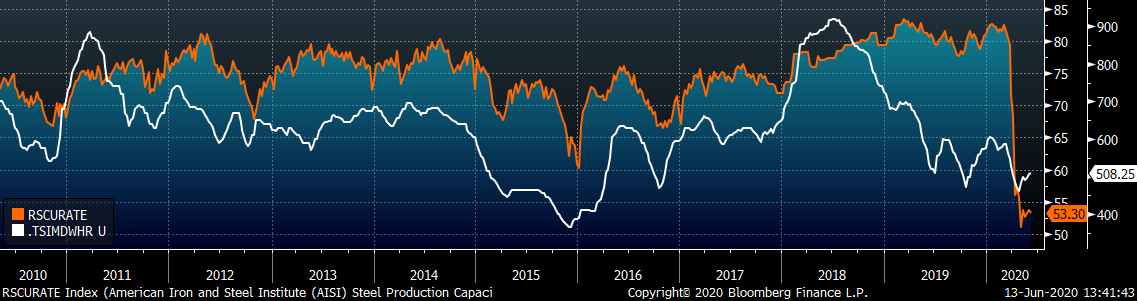
The AISI Capacity Utilization Rate was down 0.5% to 53.3%.
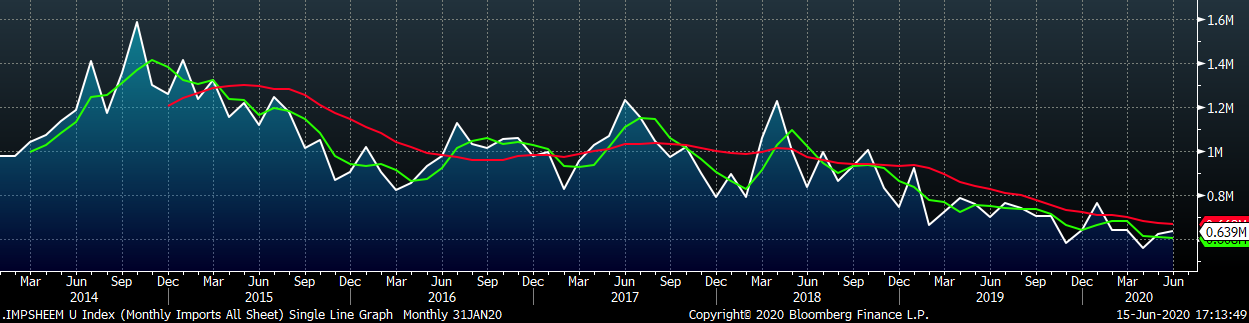
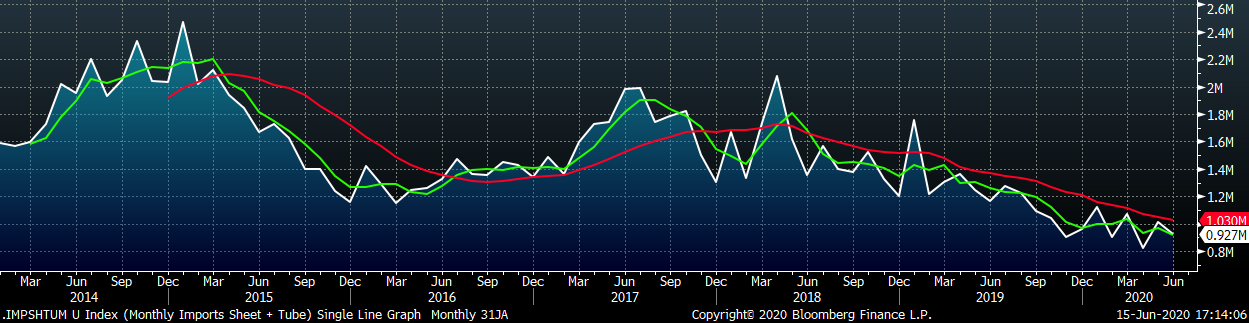
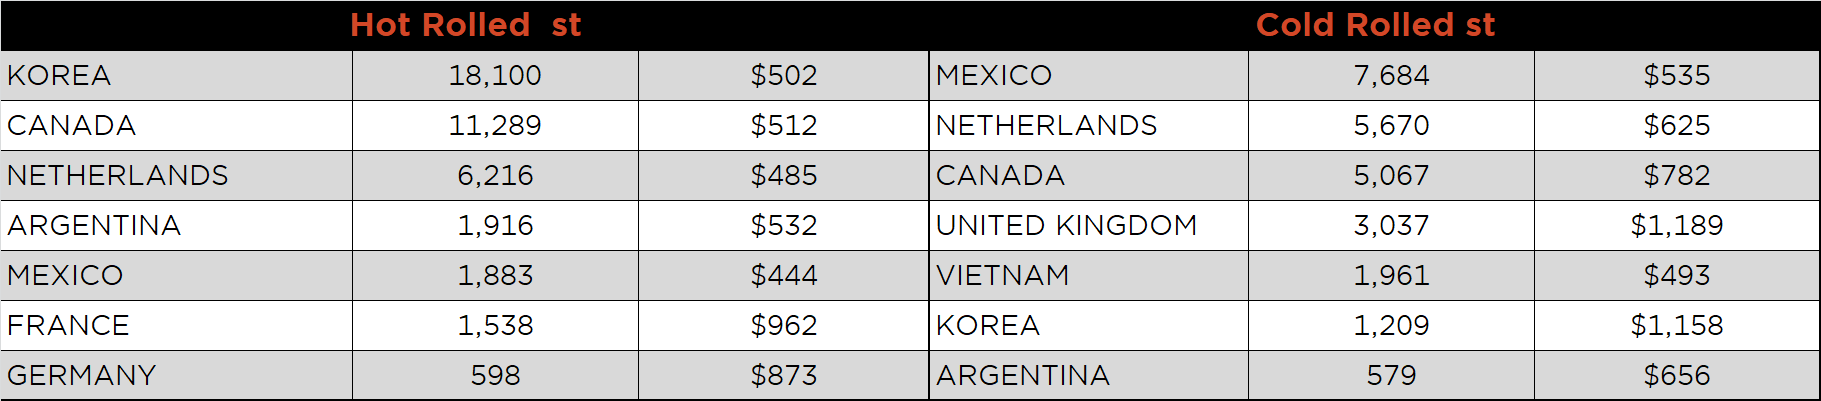
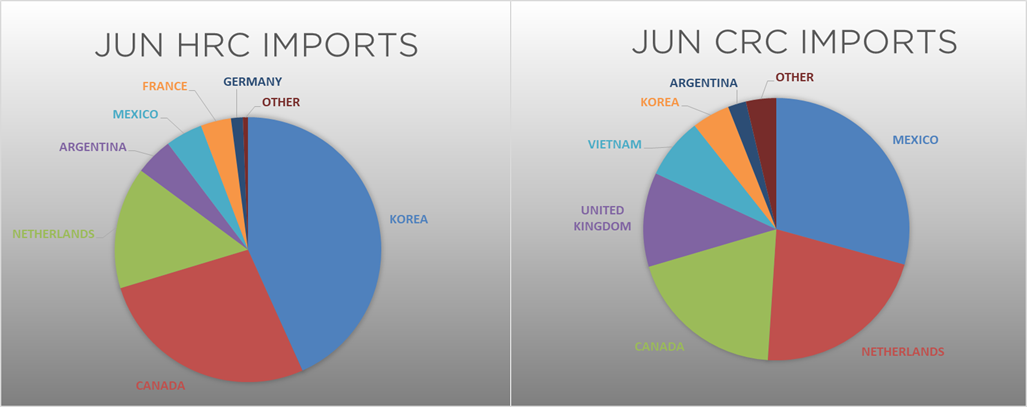
June flat rolled import license data is forecasting an increase of 15k to 639k MoM.
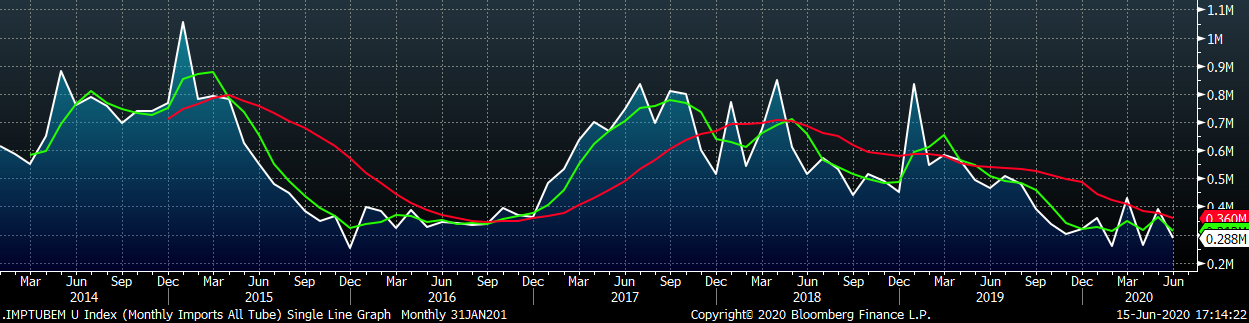
Tube imports license data is forecasting a MoM decrease of 101k to 288k tons in June.
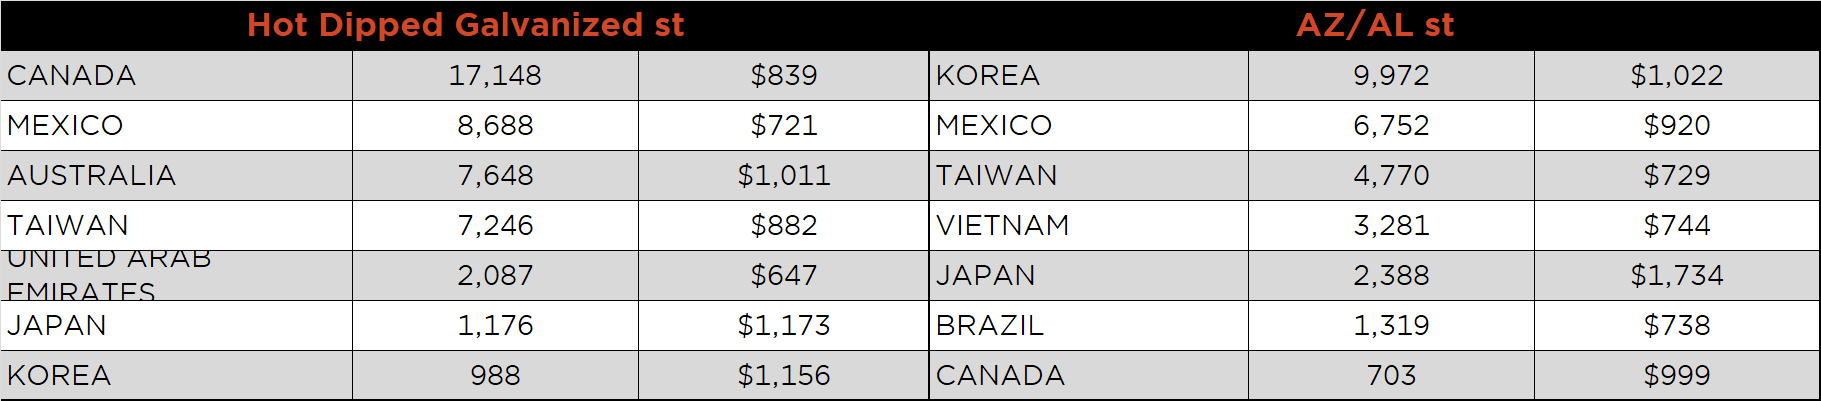
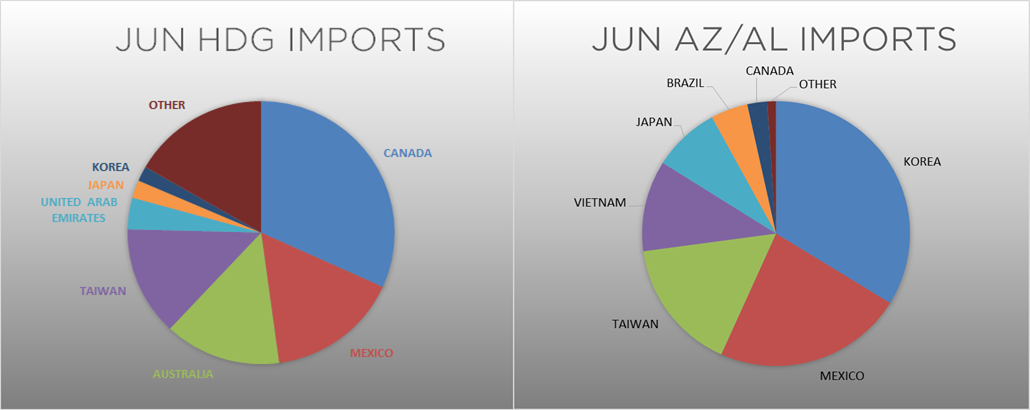
AZ/AL import license data is forecasting an increase of 7k in May to 64k.
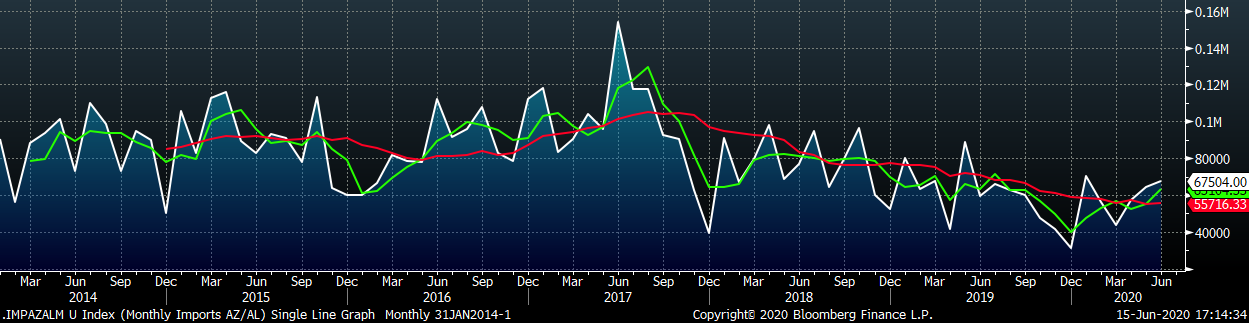
Below is May import license data through June 9, 2020.
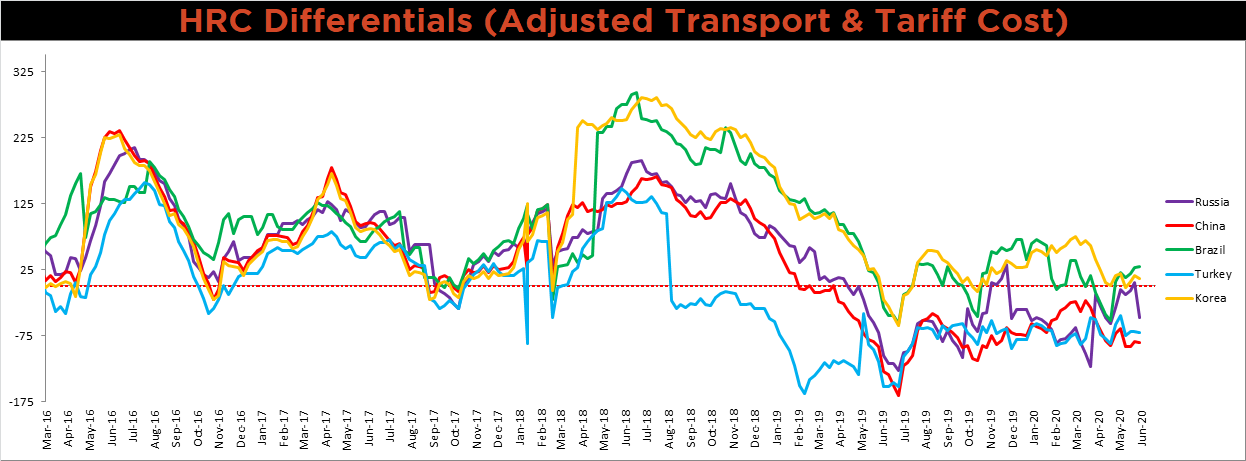
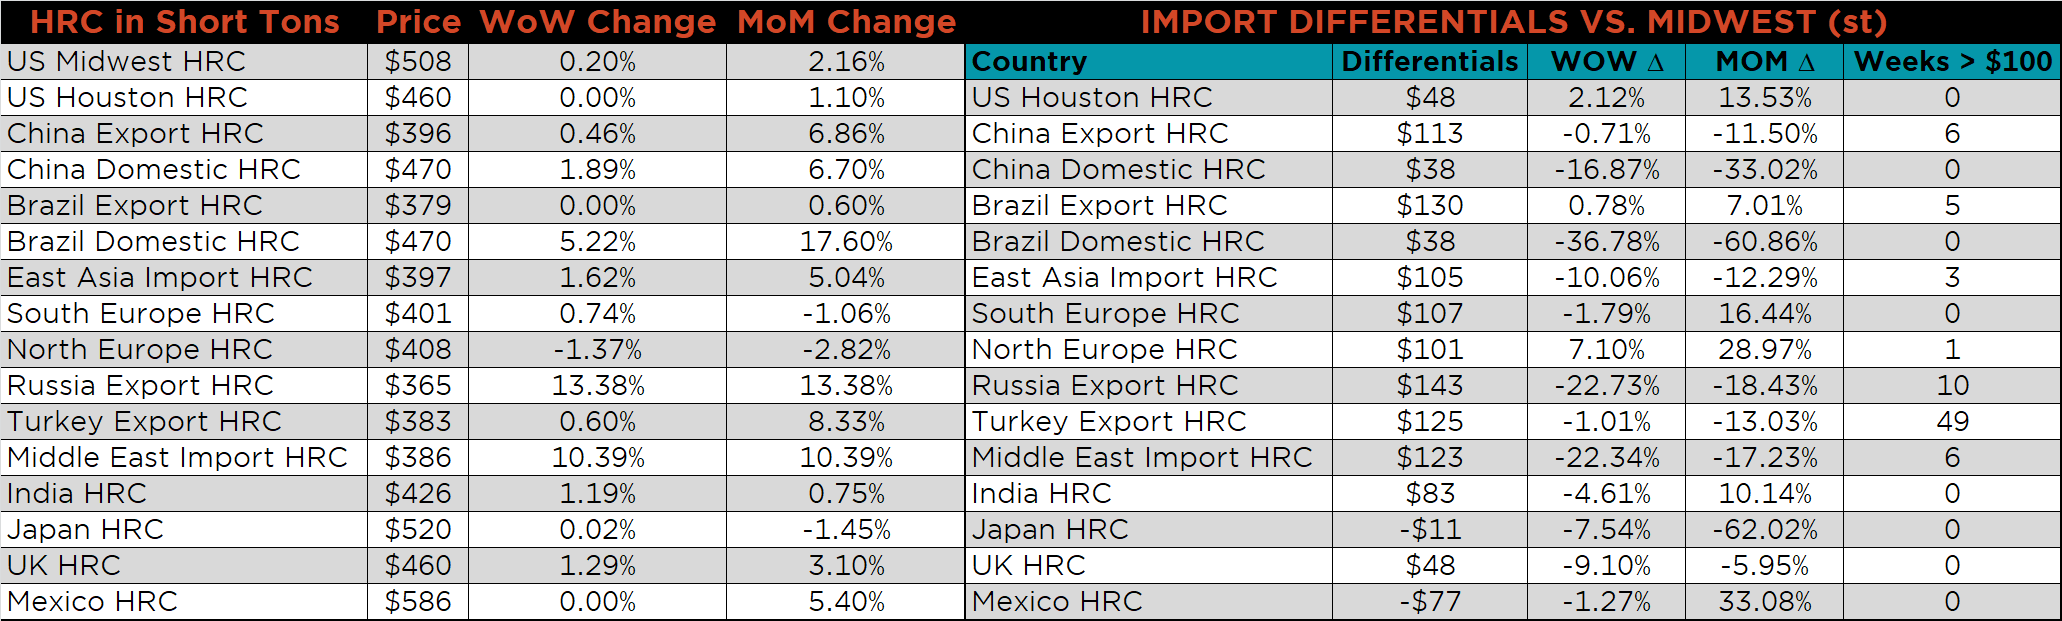
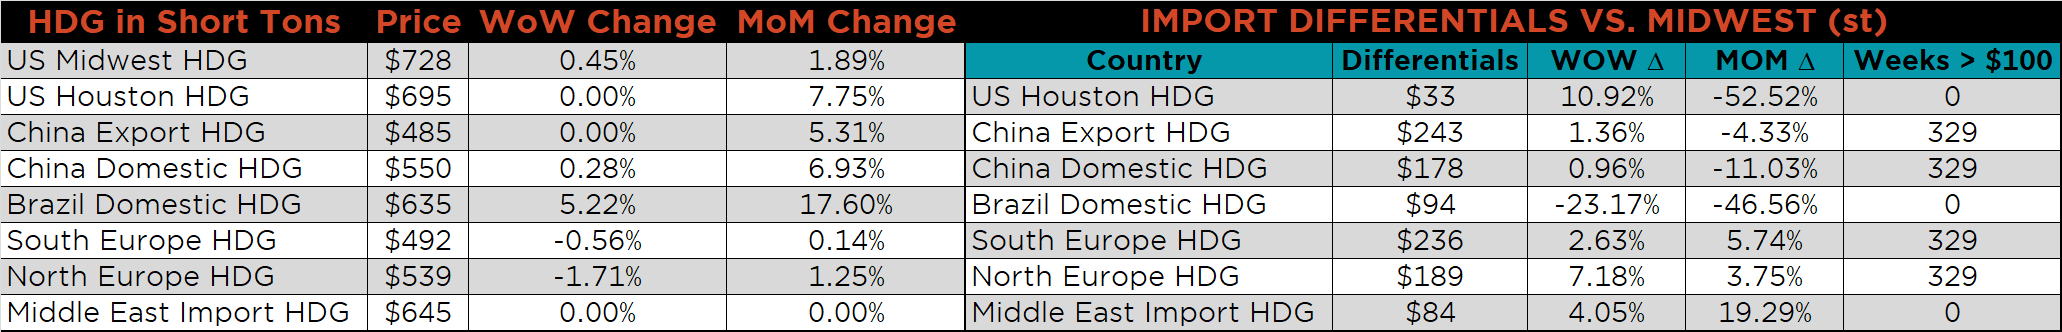
Below is the Midwest HRC price vs. each listed country’s export price using pricing from SBB Platts. We have adjusted each export price to include any tariff or transportation cost to get a comparable delivered price. The Turkish, Korean, Russian and Chinese differentials all decreased, as the U.S. price was up only slightly compared to each countries higher price. The Brazil price, however, was flat and its differential moved higher.
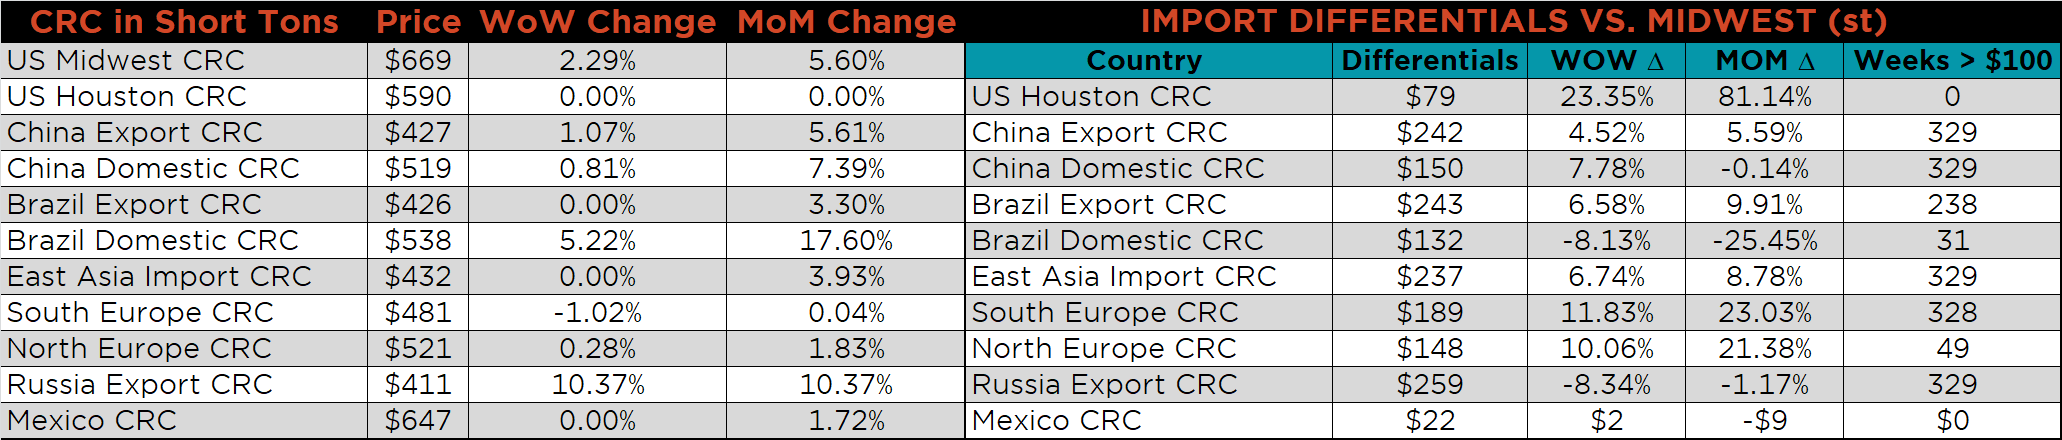
SBB Platt’s HRC, CRC and HDG pricing is below. The Midwest CRC, HDG and HRC prices were up 2.3%, 0.5% and 0.2%, respectively. Globally, the Russian export HRC and CRC prices were up, 13.4% and 10.4%, respectively.
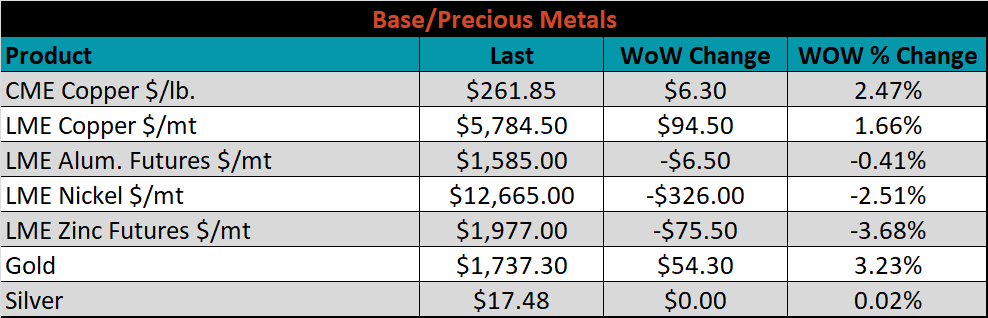
Raw material prices were mostly higher, led by the IDOEX, up 4.4%, while coking coal was down 0.7%.
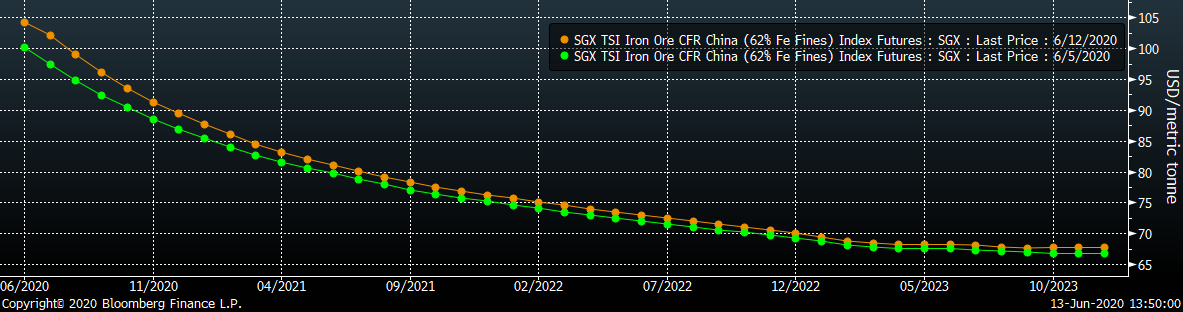
Below is the iron ore future curve with Friday’s settlements in orange, and the prior week’s settlements in green. The entire curve moved slightly higher, most clearly in the front.
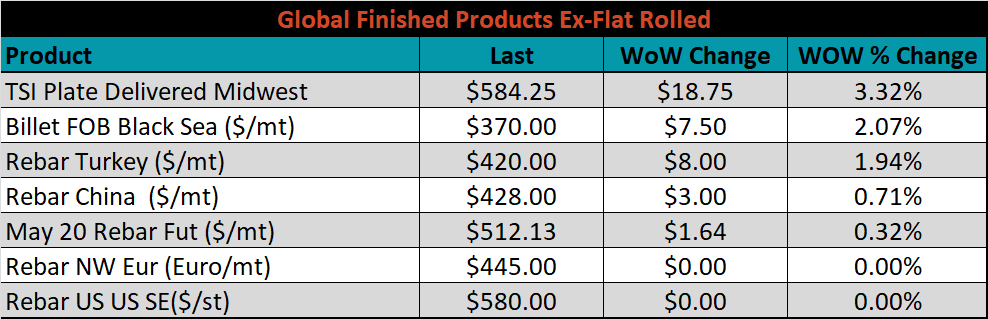
The ex-flat rolled prices are listed below.


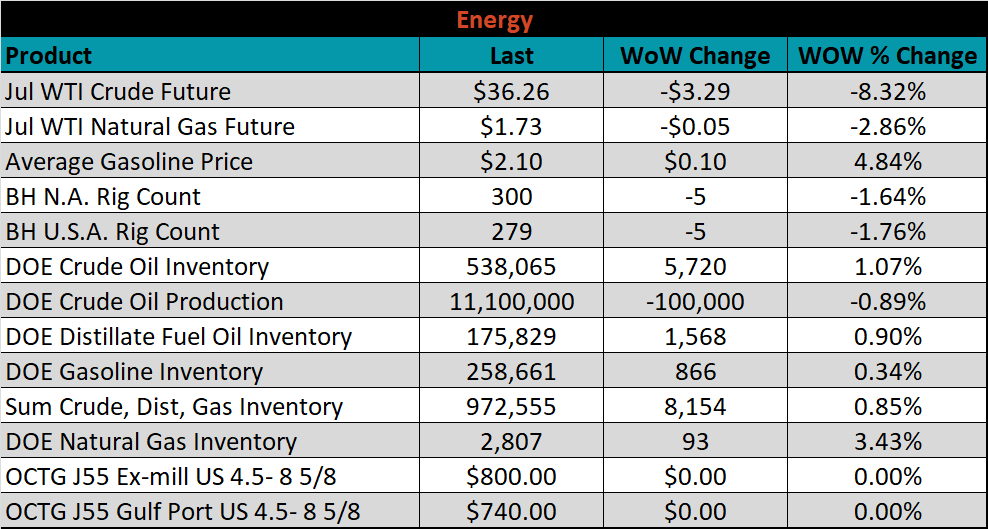
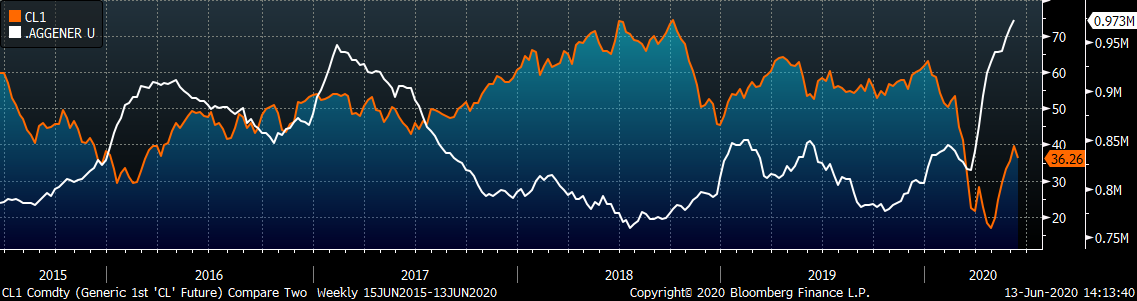
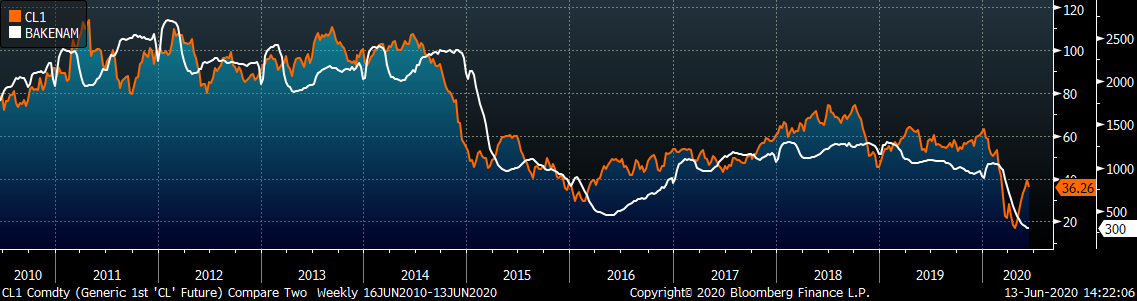
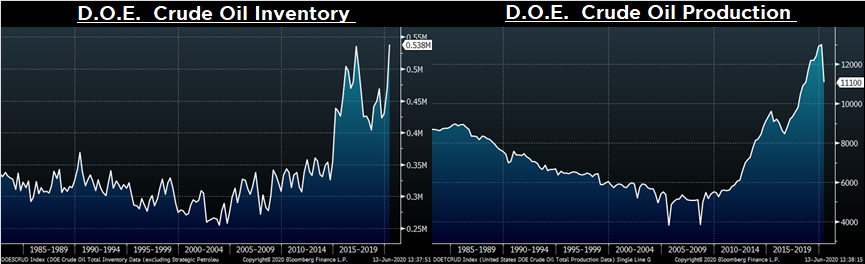
Last week, the July WTI crude oil future lost $3.29 or 8.3% to $36.26/bbl. The aggregate inventory level was up 0.9%, while crude oil production was down to 11.1m bbl/day. The Baker Hughes North American rig count was down another 5 rigs and the U.S. rig count was down 5 rigs.
The list below details some upside and downside risks relevant to the steel industry. The orange ones are occurring or look to be highly likely. The upside risks look to be in control.
Upside Risks:
Downside Risks: