Content
-
Weekly Highlights
- Market Commentary
- Risks


As we enter the 8h week of this upcycle, spot HRC prices are showing persistent momentum as they near $600/st. Lead times continue to extend as contract buyers are ordering the maximum tonnage allowed in order to capture discounted price benefits in a rising price environment. Consequently, order books are quickly filling as buyers scramble to fill current needs. Last week, we discussed pandemic related dislocations that have helped drive this rally. This week, however, we will identify cracks that are beginning to form in the outlook.
Recovering activity and demand in the domestic steel market, as well as the global economy, have helped drive steel prices to a 9-month high. Prices of various other commodities also reflected this recovery from the low levels in the spring. Recently, several of these other commodity markets have broken this uptrend, shown in the below charts, which could be an early caution signal for the domestic steel price rally.
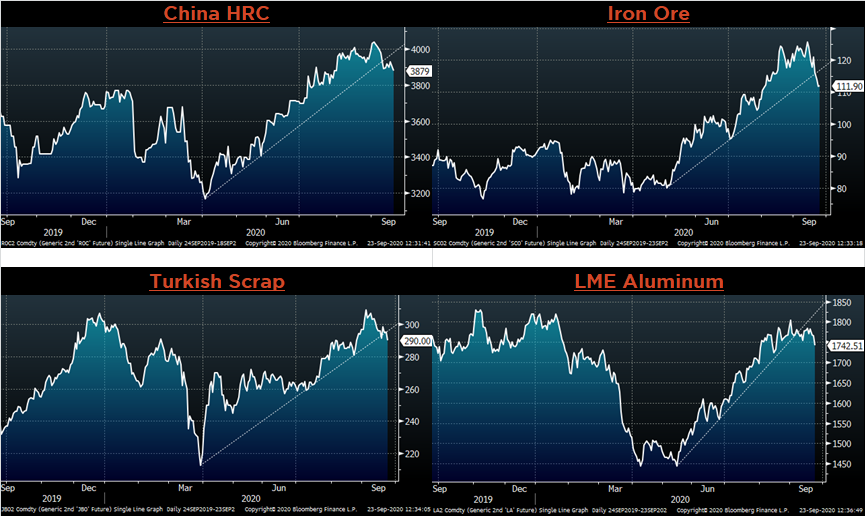
Weakness in scrap and iron ore prices directly influence finished steel pricing through reducing the cost to produce. Moreover, weakness in Chinese HRC, aluminum as well as other industrial metals (copper is also rolling over) signals that there are broad factors affecting demand throughout the global economy. As we have seen in the past, global developments do not necessarily influence domestic steel prices. However, if weakness in industrial metal prices across the globe persists or worsens, eventually domestic prices will be affected and this historically swift rally will end.
With that said, the current rally has been mainly supply driven, as mill production and supply chain inventory levels are low. Specifically, service center inventory levels relative to shipments have fallen back down to their historical average, leaving buyers with few options to secure material. The longer this lasts, the higher prices can go.

Below are the most pertinent upside and downside price risks:
Upside Risks:
Downside Risks:

The Platts TSI Daily Midwest HRC Index jumped again, up $36.25 to $598.25.

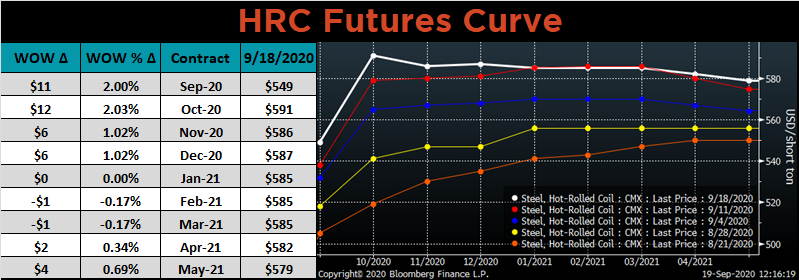
The CME Midwest HRC futures curve is below with last Friday’s settlements in white. The front of the curve moved higher this week, fueled by this historic rise in the spot price.
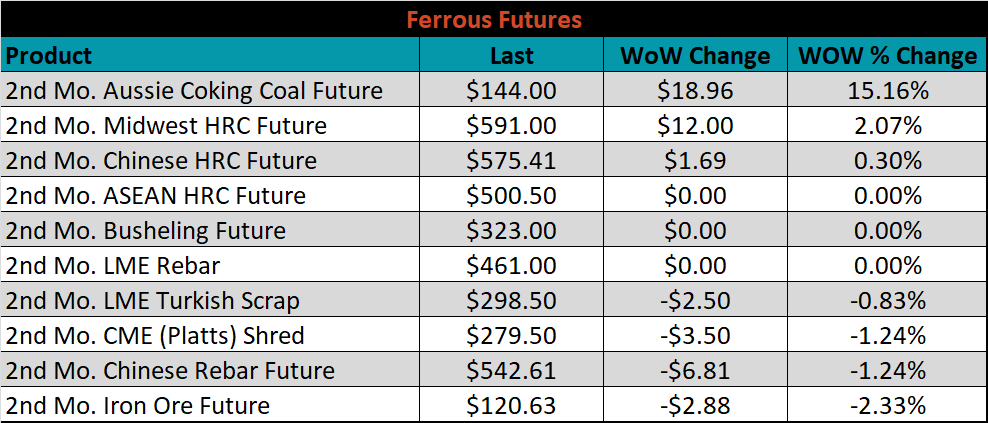
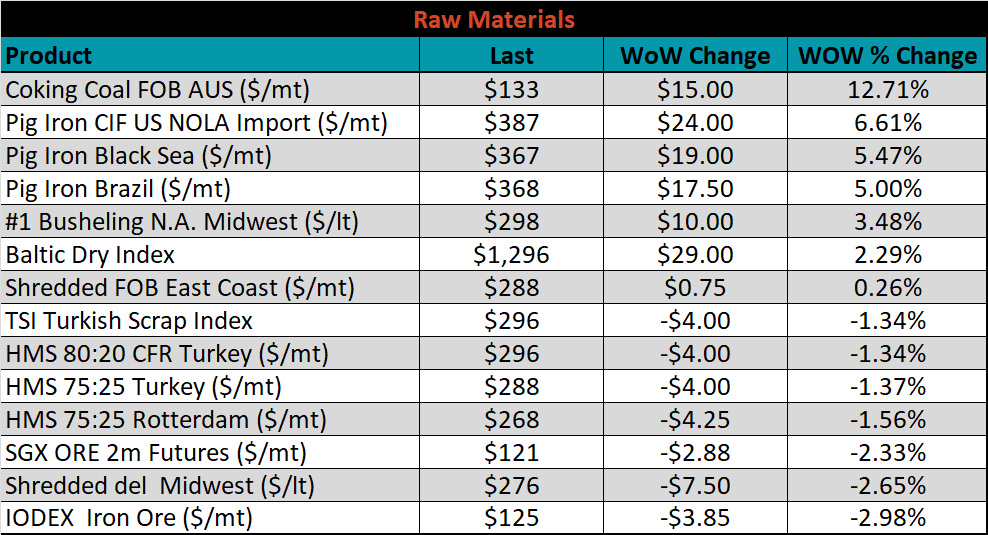
October ferrous futures were mixed. Aussie coking coal gained 15.2%, while iron ore lost 2.3%.
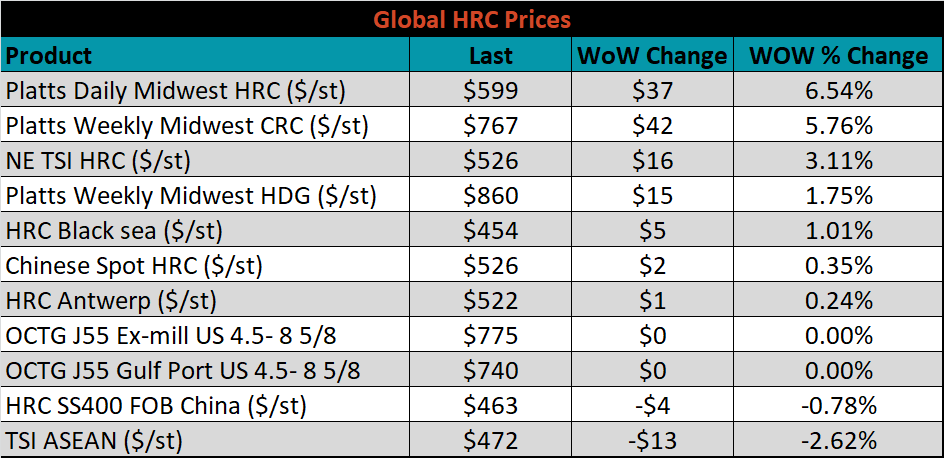
The global flat rolled indexes were mixed. TSI Platts Midwest HRC was up another 6.5%, while TSI ASEAN was down 2.6%.
The AISI Capacity Utilization rate was up another 1.4% to 65.1%.


September flat rolled import license data is forecasting a decrease of 68k to 538k MoM.

Tube imports license data is forecasting a decrease of 78k to 180k in September.


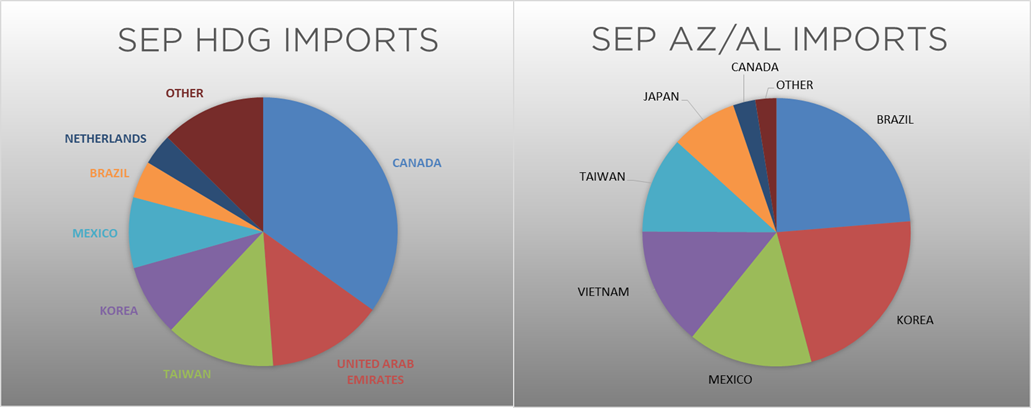
September AZ/AL import license data is forecasting a 9k decrease to 69k.

Below is September import license data through September 15, 2020.

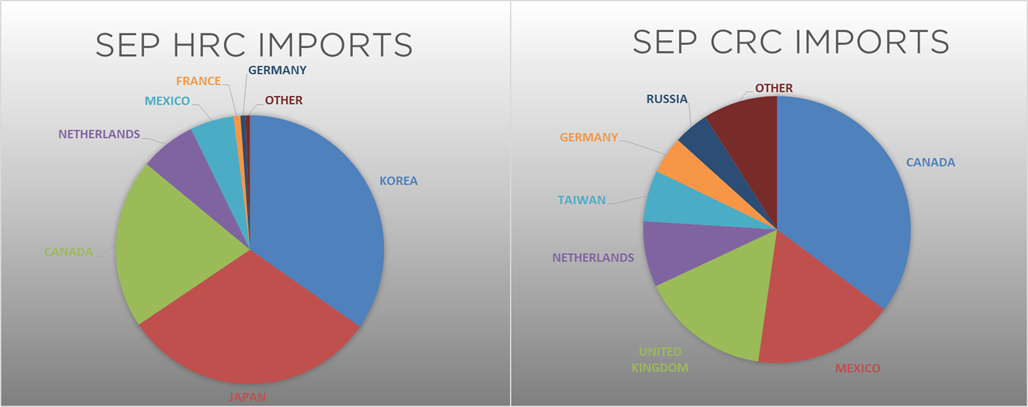

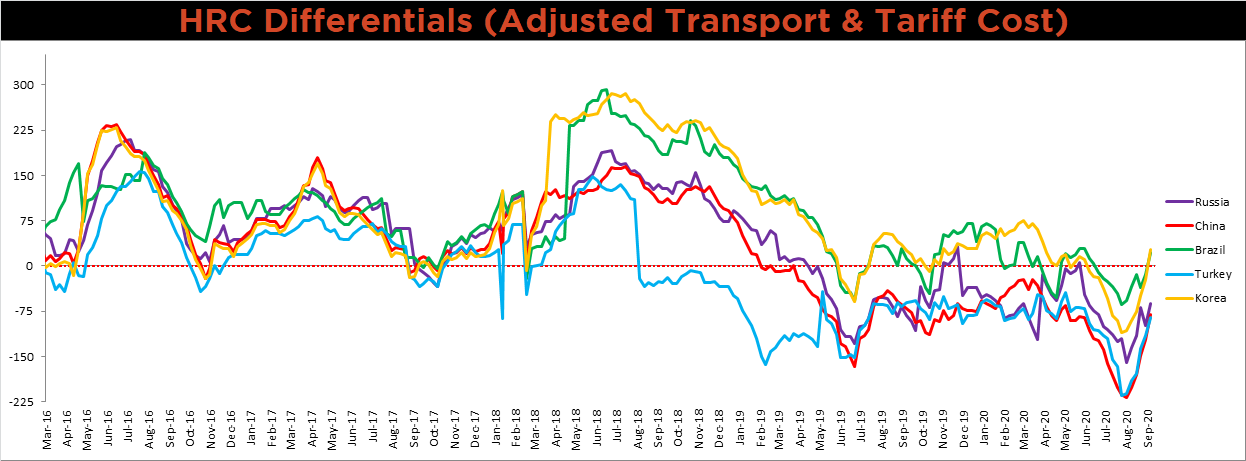
Below is the Midwest HRC price vs. each listed country’s export price using pricing from SBB Platts. We have adjusted each export price to include any tariff or transportation cost to get a comparable delivered price. The differential rose significantly for all watched countries this week, as the U.S. price continues to climb at a dramatic pace.
SBB Platt’s HRC, CRC and HDG pricing is below. The Midwest HRC, CRC and HDG prices were up, 6.5%, 5.8% and 1.7%, respectively. Globally, the Northern European HRC and CRC prices were up 2.7% and 1.7%, respectively.


Raw material prices were mixed. Aussie coking coal was up 12.7%, while the IODEX Index was down 3%.
Below is the iron ore future curve with Friday’s settlements in orange, and the prior week’s settlements in green. Last week, the curve was slightly lower, more so in the back.

The ex-flat rolled prices are listed below.


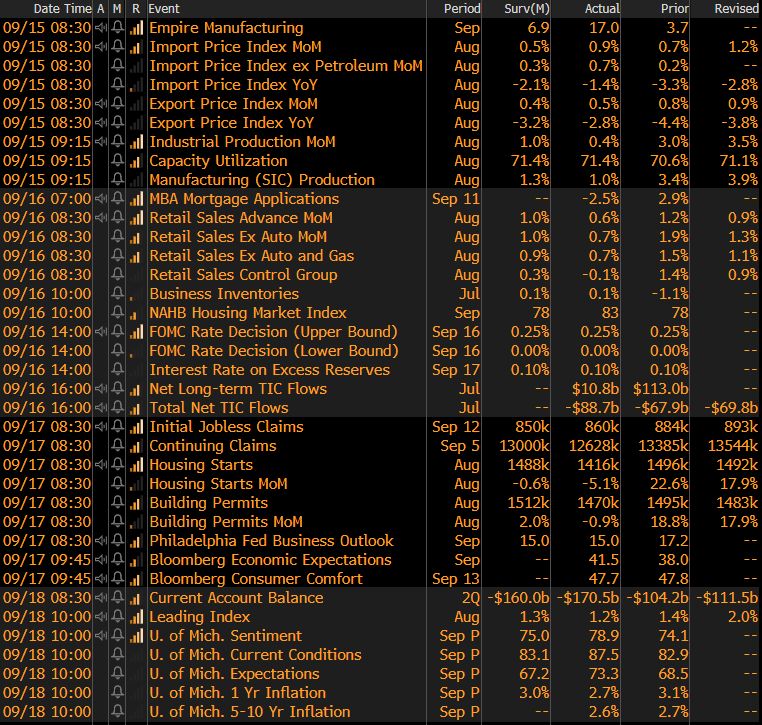
The remaining significant economic data is to the right. The September University of Michigan sentiment, current conditions and expectations surveys all came in higher than their respective estimates. Sentiment printed 78.9, above a 75.0 expectation and compared to 74.1 in August. Current conditions printed 87.5, above an expected 83.1 and compared to 82.9 in August. Finally, expectations, which predicted a decrease to 67.2 MoM, printed 73.3 above 68.5 in August.


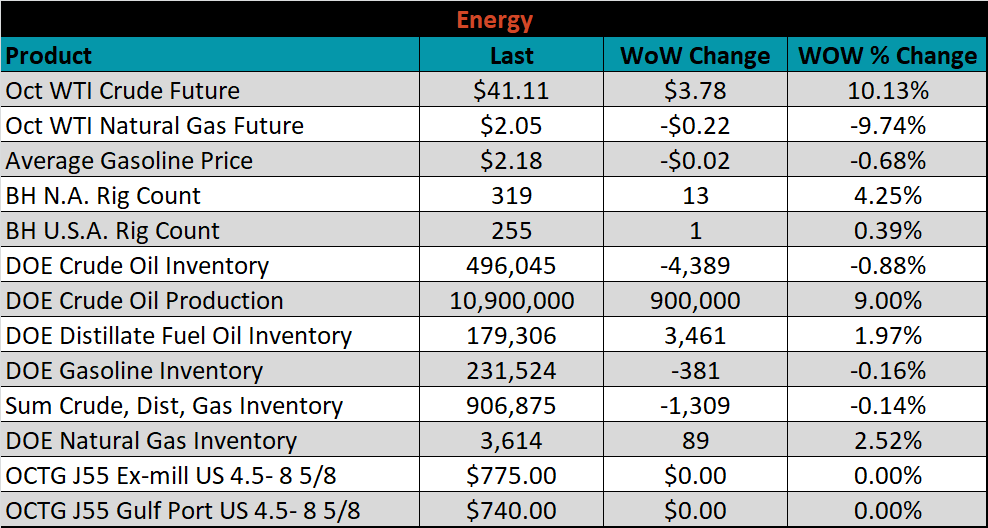
Last week, the October WTI crude oil future gained $3.78 or 10.1% to $41.11/bbl. The aggregate inventory level was down another 0.1%, while crude oil production rose to 10.9m bbl/day, up 9%. The Baker Hughes North American was up 13 rigs, and the U.S. rig count was up one rig.


The list below details some upside and downside risks relevant to the steel industry. The orange ones are occurring or look to be highly likely. The upside risks look to be in control.
Upside Risks:
Downside Risks: