Content
-
Weekly Highlights
- Market Commentary
- Durable Goods
- Risks


There have been no significant changes in the spot HRC market over the past week, with continued strength in prices supported by limited spot availability and extended lead times. Mill order books remain strong, with March tons unavailable, and any April HRC availability offered well over $1,200/st, signaling strength into the second quarter. Additionally, mills have several planned maintenance outages in the second quarter, which will continue to limit any significant supply increases into the summer. While the risk of unplanned outages remains high due to high operating rates and winter weather. Market commentary this week will briefly discuss the impacts of the auto market on steel demand before moving to the most significant factor affecting both steel supply and demand, and the commodity complex in general.
Many market participants are concerned that a slowdown in automobile production due to chip shortages may disrupt the steel price rally. While this would cause a reduction in the current demand for steel, it may also allow the auto companies to pull forward their summer shutdowns, and continue consuming steel during June and July at an elevated pace. This would allow mills to catch up with current orders, while also filling forward order books. Moreover, as a significant amount of scrap is generated in the auto supply chain and production process, a slowdown or shutdown in auto production will limit the supply of the key steelmaking raw material. This possible supply constraint, along with the effects of the recent winter weather on scrap flows, have appeared in the busheling forward curve, with prices up over $100/t across all expirations over the past week.
The most significant factors driving the steel market over the past 6 months have been dwindling inventories while demand for goods recovered, and in select sectors, increased compared to last year. The below chart shows data from last week’s Durable Goods report, isolating inventories (red) and new orders (blue) for steel specific categories.

New orders are in line with both their pre-pandemic level and 2 year average (dotted blue line), while inventory levels remain significantly depressed. The structural shortage related to the steel market shows no signs of relief based on the current data. Moreover, this dynamic regarding the relationship between inventories (i.e. supply) and new orders (i.e. demand) is not isolated to just the steel market. It is happening throughout the economy and around the globe. We already discussed the auto industry, where semiconductor chip inventories cannot keep up with demand for cars. It is also apparent in the residential construction market, where existing homes and the supply of lumber are constraining robust housing sales. Copper prices are skyrocketing to the highest levels since 2012 as global demand is returning and production is constrained in South America.
Why does this matter for the steel market? It confirms that the structural shifts in consumer spending are widespread, and temporary relief in supply will do little to change these underlying drivers. Imports, increased production and inventory restocking will have to persist for several months to balance this elevated demand and end the record price rally.

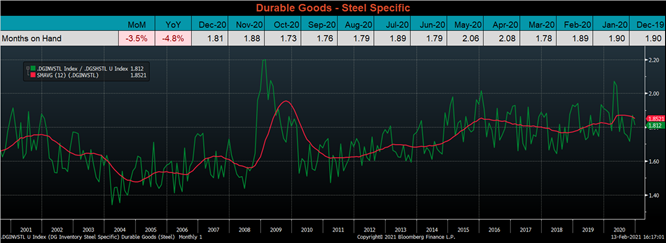
Below are final December new orders from the Durable Goods report. New orders for manufactured goods were up 1.1% compared to December 2019 and 6.5% higher than November. Manufacturing ex-transportation new orders were up 2.7% YoY, and 5.3% higher than November. The final chart looks at the months on hand (inventory divided by shipments) for durable goods categories that are steel intensive. MOH moved slightly lower compared to November, and is back below the trend-line, as inventories were flat, and shipments increased.



Below are the most pertinent upside and downside price risks:
Upside Risks:
Downside Risks:

The Platts TSI Daily Midwest HRC Index increased by $20.25 to $1,200.

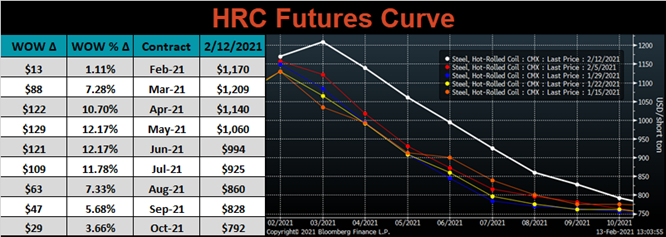
The CME Midwest HRC futures curve is below with last Friday’s settlements in white. Last week, the curve shifted significantly higher at all expirations, after multiple weeks of being rangebound.
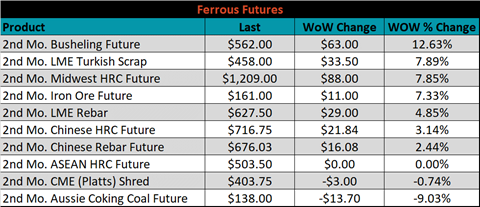
March ferrous futures were mixed. Busheling gained 12.6%, while Aussie coking coal lost another 9%.
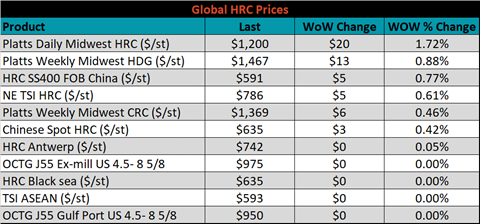
Global flat rolled indexes were mostly higher, led by Midwest HRC, up 1.7%.
The AISI Capacity Utilization rate decreased 0.9% to 75.2%, as mills appear to be reluctant to bring additional capacity on and change the current conditions.


February flat rolled import license data is forecasting an increase of 48k to 646k MoM.

Tube imports license data is forecasting an increase of 58k to 286k in February.


January AZ/AL import license data is forecasting no change, at 50k.

Below is January import license data through February 9, 2021.

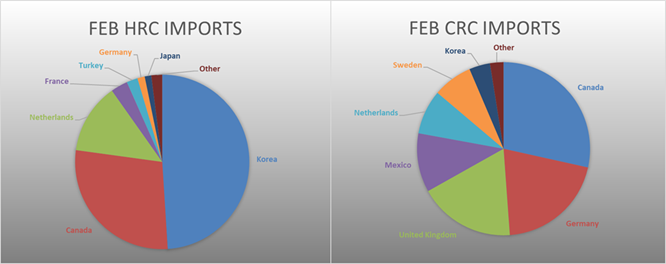

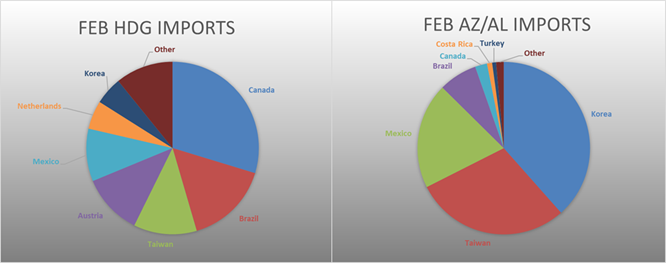
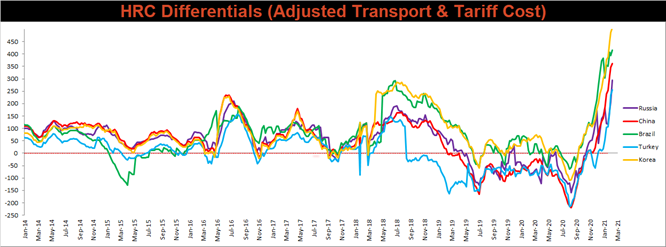
Below is the Midwest HRC price vs. each listed country’s export price using pricing from SBB Platts. We have adjusted each export price to include any tariff or transportation cost to get a comparable delivered price. The watched countries differentials all increased, as the U.S. HRC price continues to outpace global prices.
SBB Platt’s HRC, CRC and HDG pricing is below. The Midwest HRC, HDG and CRC prices were up 1.7%, 0.9% and 0.5%, respectively. Globally, the Russian HRC and CRC export prices were down, 7.8% and 5.6%, respectively.


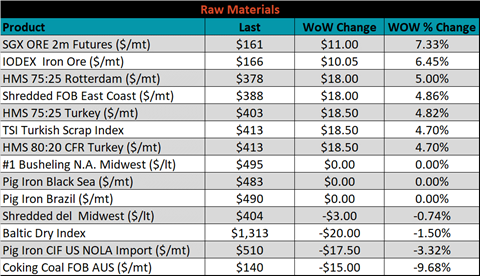
Raw material prices were mixed. Iron ore futures gained 7.3%, Aussie coking coal was down 9.7%.
Below is the iron ore future curve with Friday’s settlements in orange, and the prior week’s settlements in green. Last week, the entire curve rebounded higher after a few weeks of selling off.

The ex-flat rolled prices are listed below.


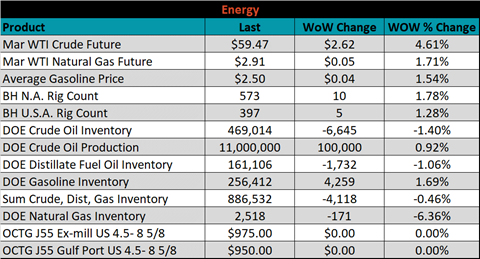
Last week, the March WTI crude oil future gained another $2.62 or 4.6% to $59.47/bbl. The aggregate inventory level was down 0.5% and crude oil production increased to 11m bbl/day. The Baker Hughes North American rig count was up by another 10 rigs, and the U.S. rig count was up 5 rigs.


The list below details some upside and downside risks relevant to the steel industry. The orange ones are occurring or look to be highly likely. The upside risks look to be in control.
Upside Risks:
Downside Risks: