Content
-
Weekly Highlights
- Market Commentary
- Risks


Last week was another strong week across the ferrous metals space, with spot prices in the U.S. marching to $1,300, and mill looking for further increases ahead. Rather than discuss the same dynamics that we have been following that drove the price to these levels, and will continue to support prices in the weeks ahead, this week we will dive into possible changes in the domestic supply landscape as recent movements may be important indicators in the months ahead.
Every month, we estimate how many tons domestic mills are actually supplying to the market through distributors. We call this the Mill Fill Index, and it is shown below in white with a 3 month moving average in red.

While the index tends to reflect seasonal factors at times, trends over select periods can give insight into specific market dynamics regarding pricing power. The higher the Mill Fill Index, the more pricing power mills should have in negotiating, leading to higher prices. This can be seen in the index movements over the past year, as both the price and the index recovered from the spring lows. However, the February reading declined significantly, bringing into question expectations for future pricing. This dip is likely the result of the winter storms disrupting mill production and supply chains, so we expect a recovery in the months ahead.
However, domestic mills are only one option for supply at service centers, with imports filling the gap in a market that consumes more steel than it produces. Throughout the current price rally over the past 6 months, predictions for higher imports could be easily found throughout industry publications and analysis. They never materialized, despite elevated price differentials, for two main reasons. First, price strength and limited availability were global dynamics, although not to the same degree as the U.S. market. Additionally, the significant backwardation in the domestic future curve prevented importers from hedging out the price risk inherent in the comparatively high import leadtimes. Both these limitations appear to be easing, possibly opening an opportunity for imports to alleviate the tight domestic market.
Looking at global supply, China recovered the fastest since the spring lows, and is producing more steel compared to pre-pandemic levels. However, the rest of the world continues to recover in terms of production levels as vaccines become more widely available, which should allow for a global restocking and increase the number of import offers into the U.S. Regarding the hedging with the forward curve, the import prices offered for the summer are around $1,100 for HRC. Two weeks ago, this was well above where the forward curve was trading in the matching expirations, meaning any hedge for that material would be locking in a loss. However, as the middle of the curve has popped, the opportunity to hedge at profit has emerged. Looking at a July delivery, an importer could buy HRC at $1,100 while simultaneously selling the July future near $1,260, locking in a $160/ton profit. As distributors look for opportunities to restock, the import market may be the low risk solution if this dynamic persists, leading to additional supply for the domestic market.

Below are the most pertinent upside and downside price risks:
Upside Risks:
Downside Risks:

The Platts TSI Daily Midwest HRC Index increased by $55.25 to $1,299.

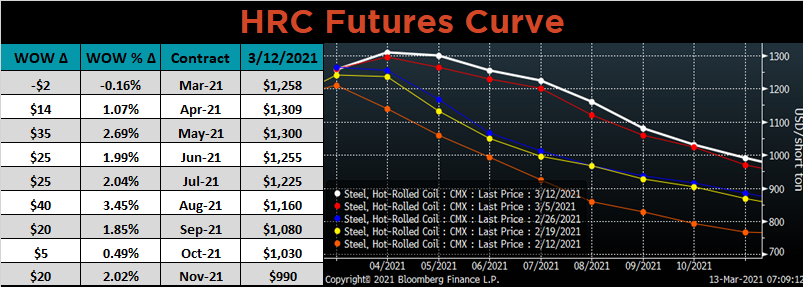
The CME Midwest HRC futures curve is below with last Friday’s settlements in white. Last week, the curve shifted slightly higher after last week’s large jump.
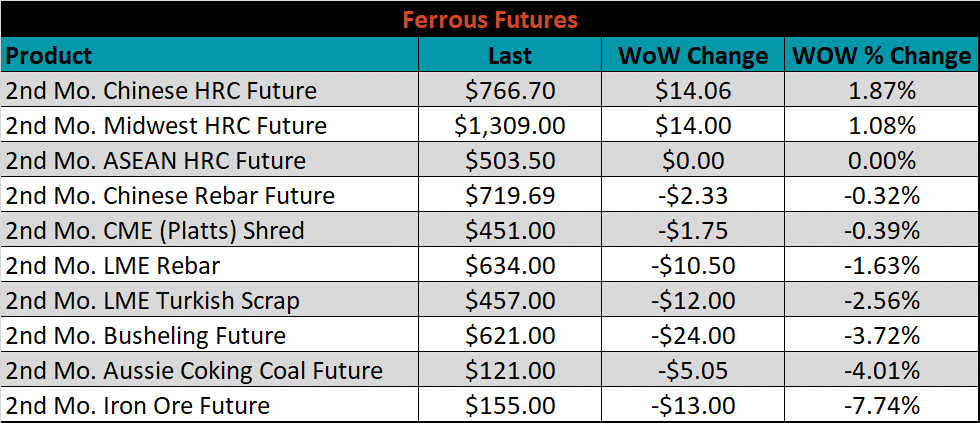
April ferrous futures were mostly lower. Iron ore dropped 7.7%, while China HRC was up 1.9%.
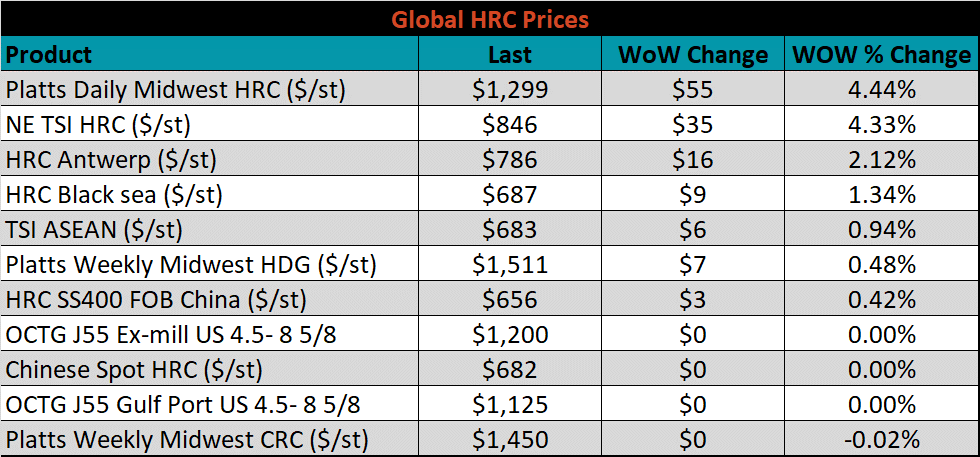
Global flat rolled indexes were almost all higher, led by Midwest HRC, up 4.4%.
The AISI Capacity Utilization rate increased 0.2% to 77.4%.


March flat rolled import license data is forecasting a decrease of 130k to 622k MoM.

Tube imports license data is forecasting an increase of 78k to 323k in March.


February AZ/AL import license data is forecasting a decrease of 22k to 37k.

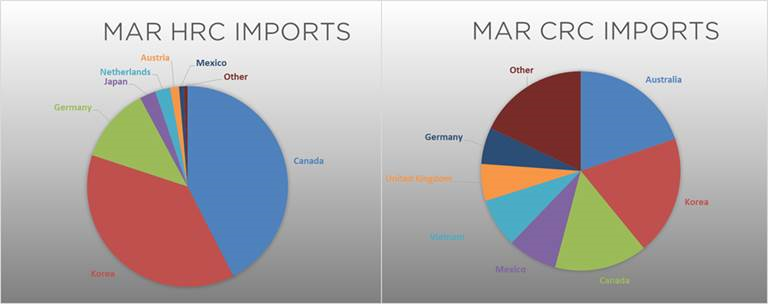
Below is February import license data through March 9, 2021.


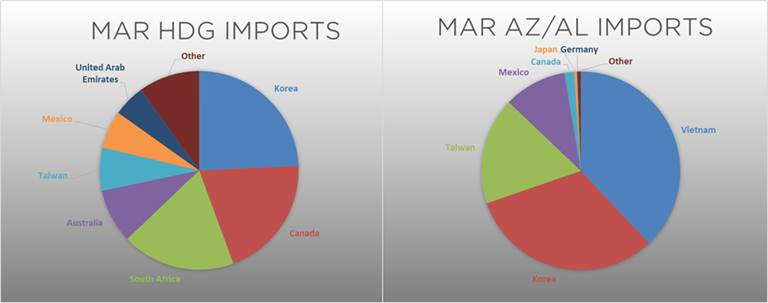
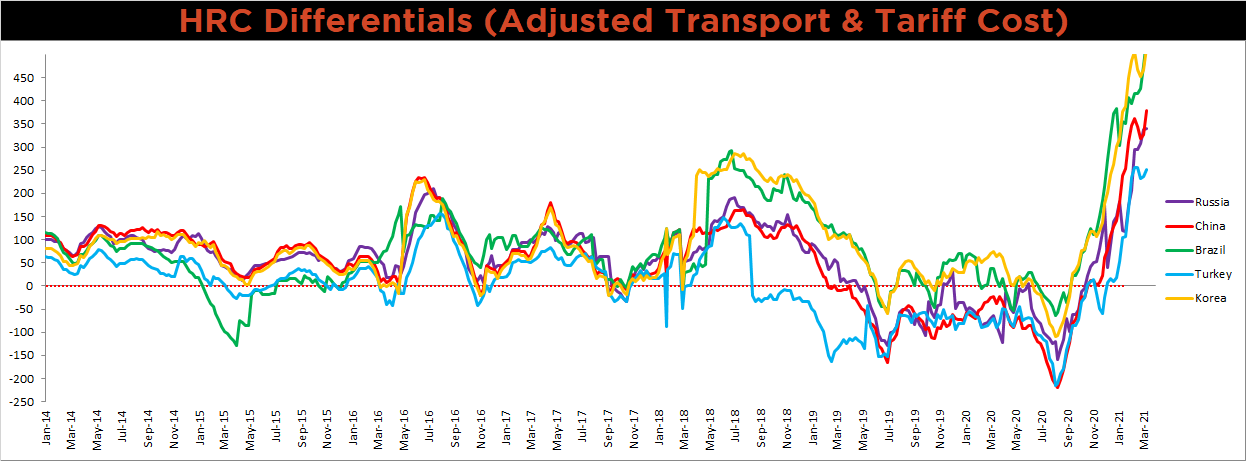
Below is the Midwest HRC price vs. each listed country’s export price using pricing from SBB Platts. We have adjusted each export price to include any tariff or transportation cost to get a comparable delivered price. All differentials increased this week with another large gain in the Midwest HRC price.
SBB Platt’s HRC, CRC and HDG pricing is below. The Midwest HRC, HDG & CRC prices were up 4.4%, 0.5% and 0.02%, respectively. Globally, the Turkish HRC export price was up 4.4%.


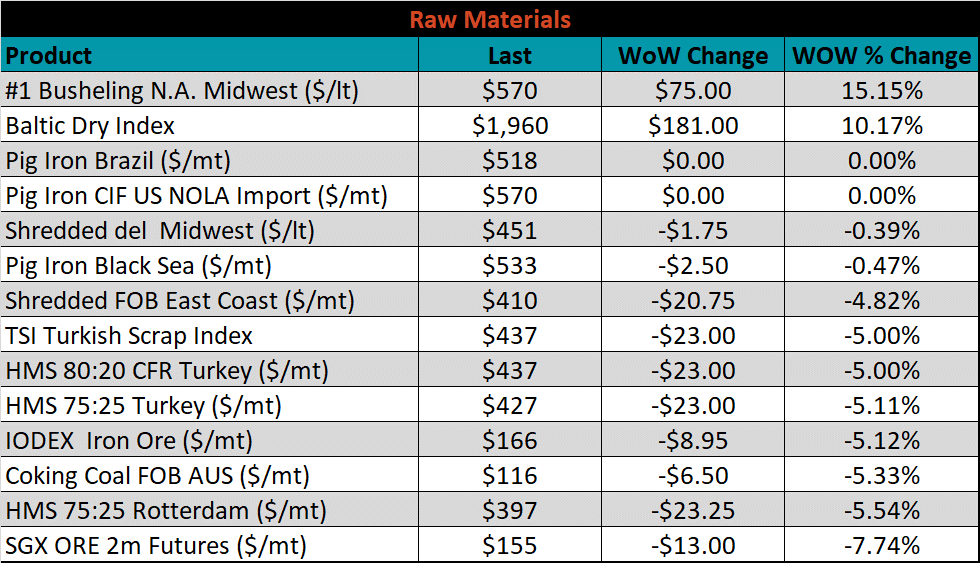
Raw material prices were mixed, with busheling up 15.2%, while iron ore was down another 7.7%.
Below is the iron ore future curve with Friday’s settlements in orange, and the prior week’s settlements in green. Last week the curve shiffed lower across all expirations.

The ex-flat rolled prices are listed below.


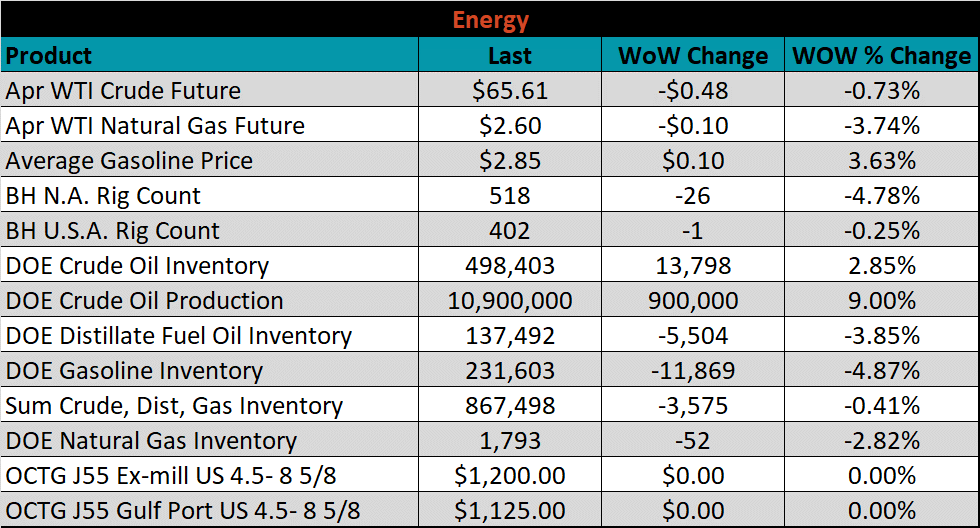
Last week, the April WTI crude oil future slid $0.48 or 0.7% to $65.61/bbl. The aggregate inventory level was down another 0.4% and crude oil production increased to 10.9m bbl/day. The Baker Hughes North American rig count was down 26 rigs, and the U.S. rig count was down 1 rig.


The list below details some upside and downside risks relevant to the steel industry. The orange ones are occurring or look to be highly likely. The upside risks look to be in control.
Upside Risks:
Downside Risks: