Content
-
Weekly Highlights
- Market Commentary
- Risks


Last week, market prices in the ferrous complex were higher again, as the spot HRC price rally extends into its 7th month. Spot HRC pricing moved above $1,300/st, supported by the lingering tightness in terms of mill and spot material availability. While this current market tightness is the same as it has been over the past several months, we are hearing more optimism from those in the market that the end is in sight. Driving this optimism is the loosening of freight markets and mills indicating that they are finally catching up on late contract orders. Additionally, last week we discussed the looming threat of imports being more realistic in the months ahead. It is important to consider what an “end” in this rally means for pricing in the months ahead, but we urge caution as the risk/reward ratio for buyers at these prices has shifted. An end of a price rally does not necessarily mean lower prices are eminent, and lead times indicate prices can stay high for several weeks. This week, we will dive into how paper market hedgers can give any insight into the demand outlook in the months ahead.
In previous reports, we have discussed the Net Speculative positions in HRC future contracts, as the directional positioning can give insight into the price outlook from banks and funds. The below chart shows the TSI Midwest HRC price on top, with the Net Speculative positions in the lower panel.
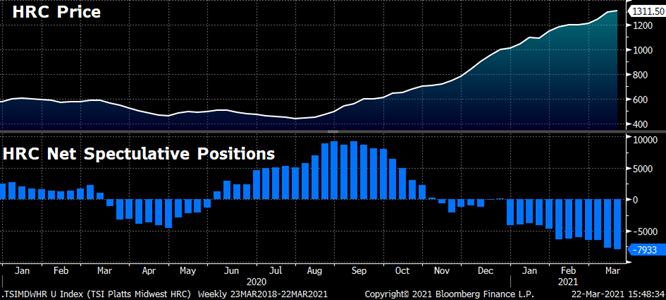
If speculators are net short, it means that commercial positioning is net long. Commercial positions usually consist of physical market participants who are hedging. Therefore, a negative reading in the net speculative position, followed by an increase in the price means that physical hedgers are benefiting at the expense of the speculators. An interesting note is that there is more physical hedge buying with prices at $1,300 compared to April 2020, with prices at $500. This may seem backwards because buyers are locking in higher and higher prices over time. However, we see this as a signal about the strength of the demand in the market. Because buyers of hedges are generally locking in prices to achieve a desired margin on their end sale, the dynamic of increased hedging at higher prices indicates that demand for the finished product is growing as the price increases and hedgers are confident about passing along those increases. This strength in demand will continue to support prices at elevated levels for some time, even after prices stop rising.
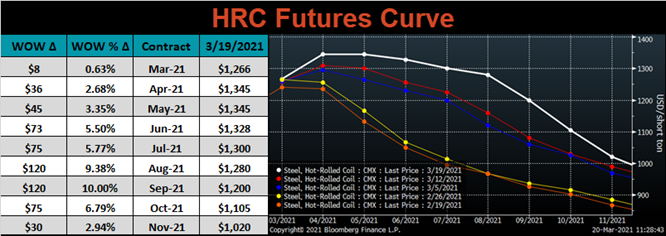
As we discuss hedging and the outlook for prices, we should also discuss how the future curve has reacted recently, and what opportunities it is presenting. With the front of the curve trading at prices higher than the current spot, and upside momentum slowing, we would avoid locking in hedges during the summer months. The risk reward appears to favor waiting to buy spot material, as lead times will be into June soon. However, the back of the curve continues to offer a value for buyers, with over $400 discount for 2022 purchases.

Below are the most pertinent upside and downside price risks:
Upside Risks:
Downside Risks:

The Platts TSI Daily Midwest HRC Index increased by $12.50 to $1,311.50.

The CME Midwest HRC futures curve is below with last Friday’s settlements in white. Last week, the curve shifted significantly higher especially in the later month expirations.
April ferrous futures were mixed. China rebar was up 3.8%, while Aussie coking coal was down 6.6%.
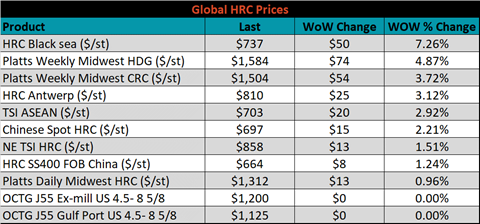
Global flat rolled indexes were all higher, led by Black Sea HRC, up 7.3%.
The AISI Capacity Utilization rate increased 0.3% to 77.7%.


March flat rolled import license data is forecasting a decrease of 10k to 743k MoM.

Tube imports license data is forecasting an increase of 42k to 287k in March.


March AZ/AL import license data is forecasting an increase of 87k to 125k.

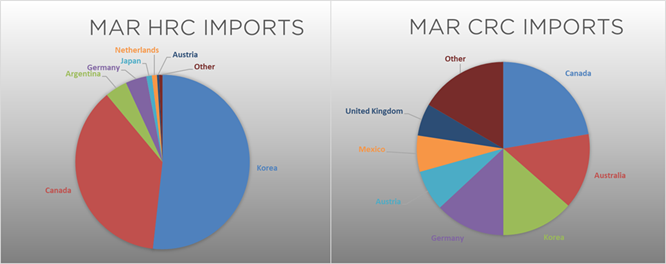
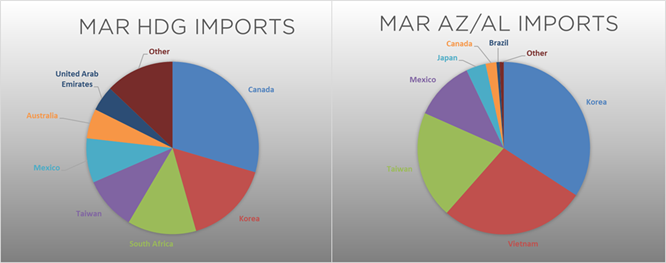
Below is March import license data through March 16, 2021.


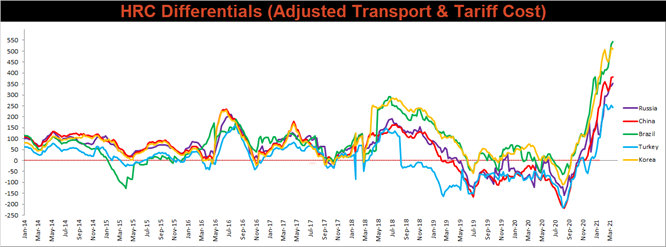
Below is the Midwest HRC price vs. each listed country’s export price using pricing from SBB Platts. We have adjusted each export price to include any tariff or transportation cost to get a comparable delivered price. The Turkish differential decreased, while the remaining differentials increased this week as the Midwest HRC price continues to outpace most global prices.
SBB Platt’s HRC, CRC and HDG pricing is below. The Midwest HDG, CRC & HRC prices were up 4.9%, 3.7% and 1%, respectively. Globally, the Turkish HRC export price was up 2.4%.


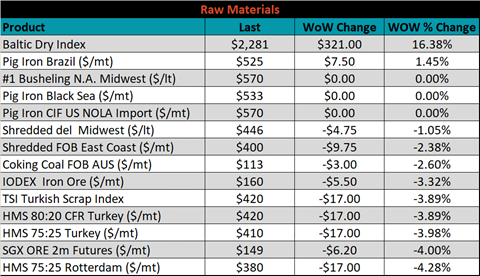
Raw material prices were mixed, with pig iron up 1.5%, while Rotterdam HMS was down another 4.3%.
Below is the iron ore future curve with Friday’s settlements in orange, and the prior week’s settlements in green. Last week the curve shiffed lower across all expirations

The ex-flat rolled prices are listed below.


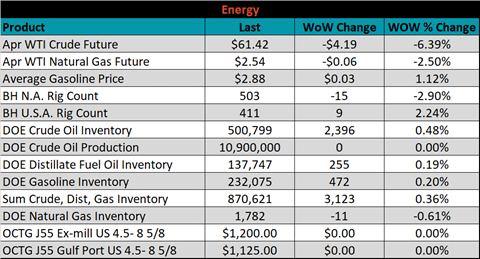
Last week, the April WTI crude oil future was down $4.19 or 6.4% to $61.42/bbl. The aggregate inventory level was up 0.4% and crude oil production remains at 10.9m bbl/day. The Baker Hughes North American rig count was down 15 rigs, while the U.S. rig count was up 9 rigs.


The list below details some upside and downside risks relevant to the steel industry. The orange ones are occurring or look to be highly likely. The upside risks look to be in control.
Upside Risks:
Downside Risks: