

July 9, 2021

Market Commentary
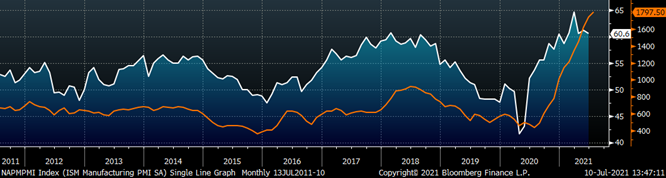
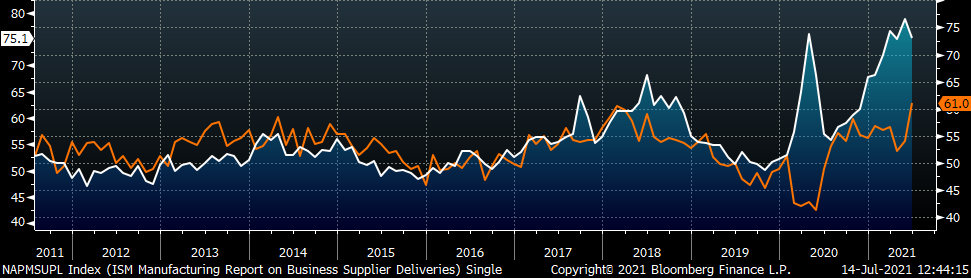
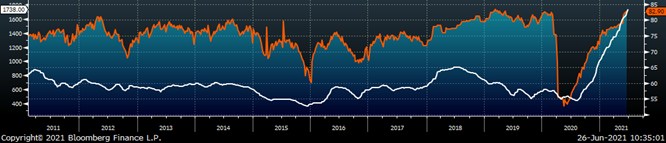
Over the last two weeks, very little fundamentally changed in the physical market. Spot prices for HRC continued to grind higher, with most assessments at the $1,800 level and limited availability pushing into September. Anyone who is familiar with the cyclicality of the steel industry understands that the summer months generally lead to a slowdown in demand and information. Given the velocity of the rally up to this point, a few quiet weeks and a diminished sense of panic may lead some to believe, now is a good time to take a breath. Additionally, there is a sense in the physical market that the worst of the shortage is behind us and that there is additional availability around the corner. At this point, these claims do not appear to be based in evidence, no mills have spot availability and scheduled maintenance outages are getting closer every day. In this week’s report, we will dig into the economic data released at the beginning of July.One of the datapoints we have been watching closely across steel intensive industries are inventory levels. To be clear, the data does not say that inventories are right-sized, they remain far too low across the board. There are, however, preliminary signs that inventories are no longer getting worse. The ISM PMI customer inventories subindex ticked higher for the first time since December of last year. Steel specific durable goods MoH (value of inventories/value of shipments) has also increased over the last two months. Further stabilization of inventories will be paramount in slowing price momentum and allowing supply chains to operate more efficiently. With no major disruptions to supply since the February storms, increased production and higher levels of imports are moving the market towards equilibrium, but our analysis shows that there is still a significant mountain to climb. Any complacency in securing the tons you require to operate your business because the market “feels” better could be a serious risk if mills and importers are no longer able to thread the needle.The chart below is the Platts Midwest HRC index (orange) and the ISM Manufacturing PMI (white).
ISM PMI
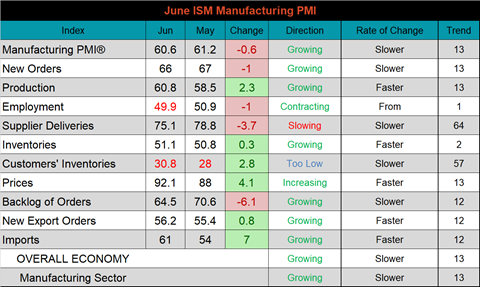
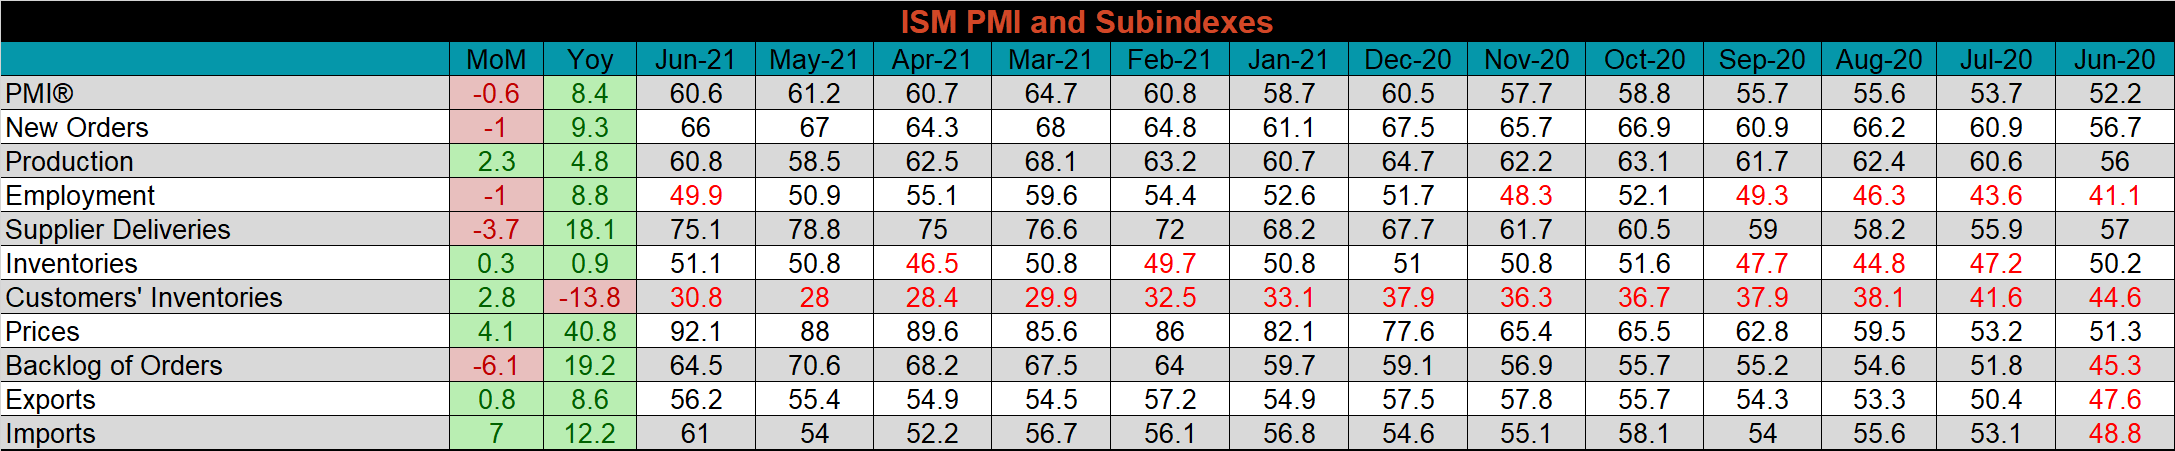
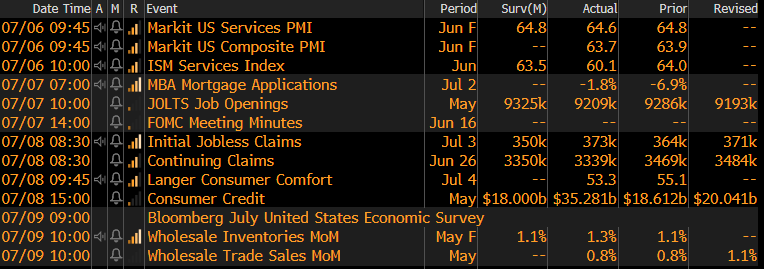
The June ISM Manufacturing PMI and subindexes are below.
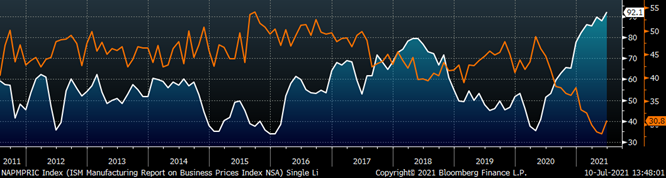
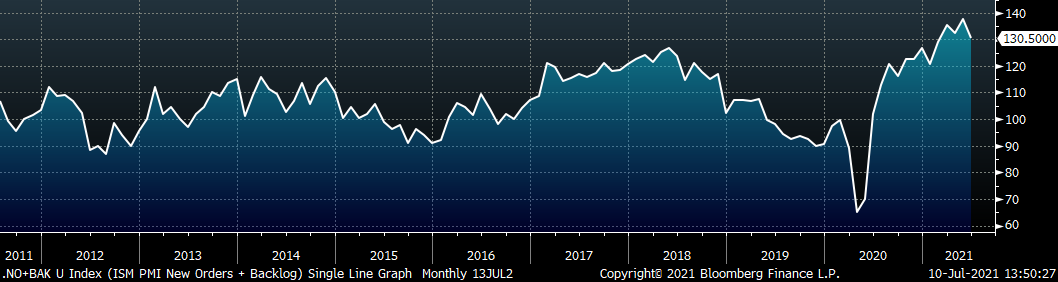
The chart below compares the ISM prices subindex with the ISM customer inventories subindex. As mentioned above, the customer inventories subindex increased for the first time since December 2020 and the prices subindex increased further, to a record high. The second chart shows the new orders plus backlog subindexes, which both backed off their recent record highs. This may appear to be a sign of demand destruction at elevated prices, however both subindexes remain firmly in expansion, signaling that demand is still growing. The final chart shows the relationship between the imports and supplier deliveries subindexes. Historically, the two subindexes have moved in concert and the breakdown of this relationship in January 2020 was emblematic of global supply chain disruption. Imports recently surpassed their previous record high which occurred in February 2018, but the gap between the two subindexes remains too wide. Our expectation is for imports to remain elevated over the next couple of months as global supply chains are reestablished and manufacturers continue to address their shortages.
ISM Manufacturing PMI Customer Inventories Subindex (orange) & Prices Subindex (white)
ISM Manufacturing PMI New Orders plus Backlog Subindexes
ISM Manufacturing Imports (orange) & Supplier Deliveries (white)
It is important to remember, year over year readings come from June 2020 when the recovery in the manufacturing industry had just begun.
Global PMI
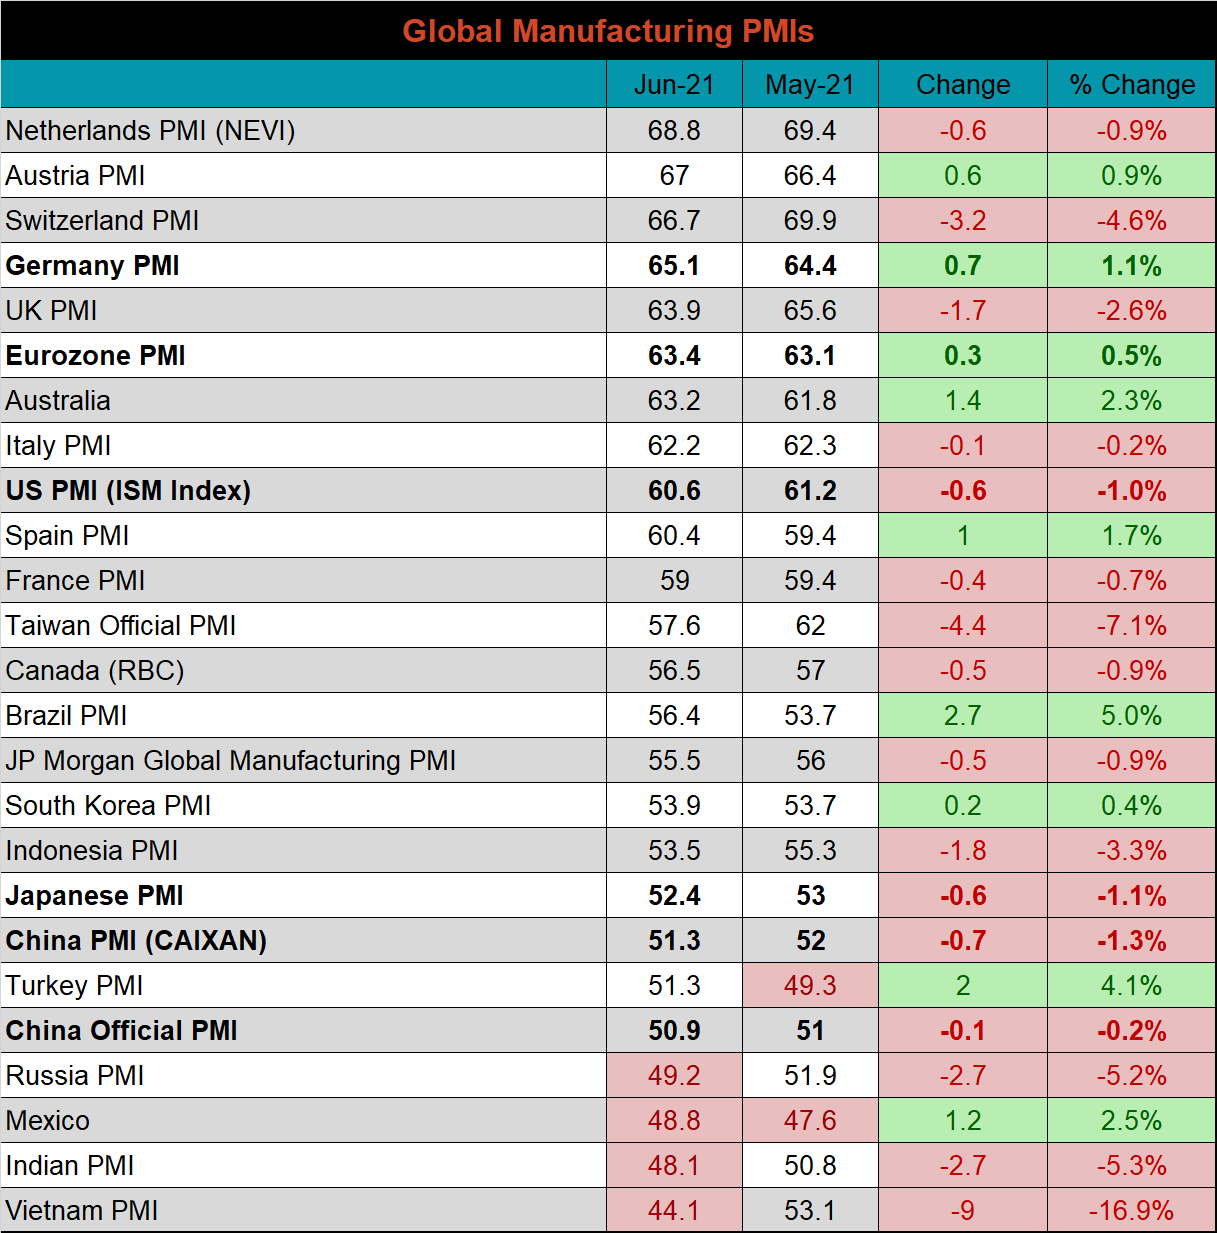
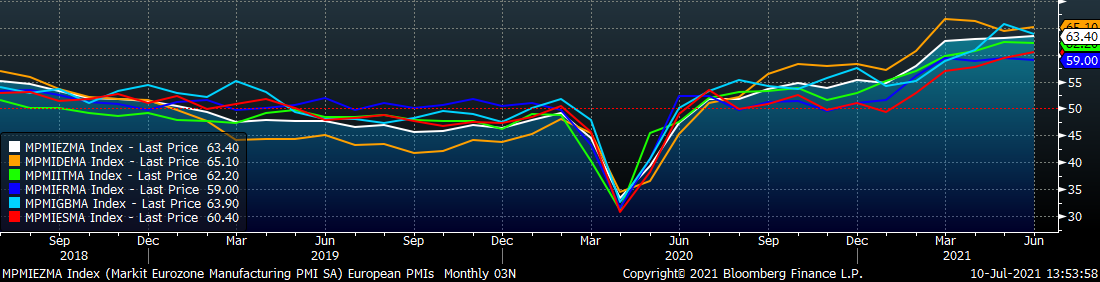
The June global PMI printings remain mostly in expansion territory, while 16 of the 24 watched countries decreased in momentum. The five most significant countries (bold) continue to expand, while Russia, Mexico, India, and Vietnam saw their manufacturing sectors contract.
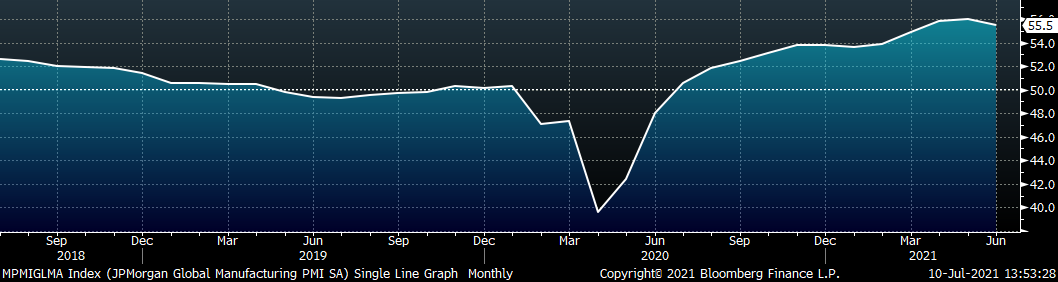
J.P. Morgan Global Manufacturing
Eurozone (white), German (orange), Italian (green), Spanish (red), and French (blue), U.K. (teal) Manufacturing PMIs
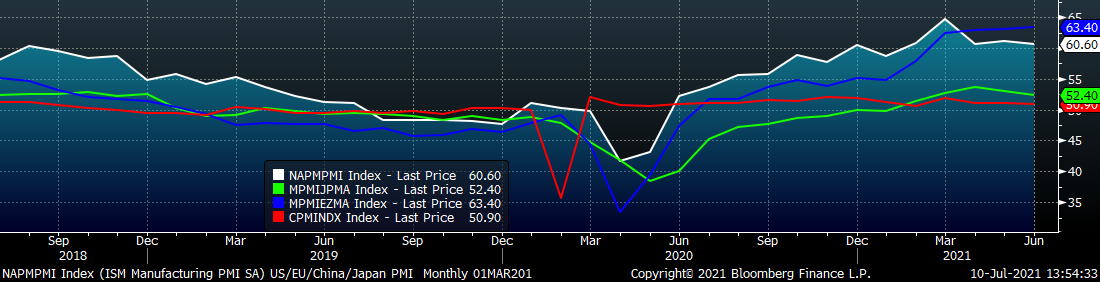
US (white), Euro (blue), Chinese (red) and Japanese (green) Manufacturing PMIs
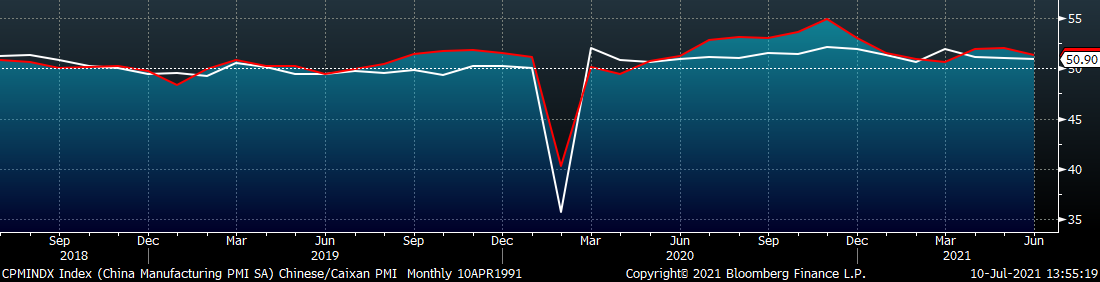
Both China’s official manufacturing PMI and the Caixan PMI were slightly lower, but remain in expansion territory.
China Official (white) and Caixan (red) Manufacturing PMIs
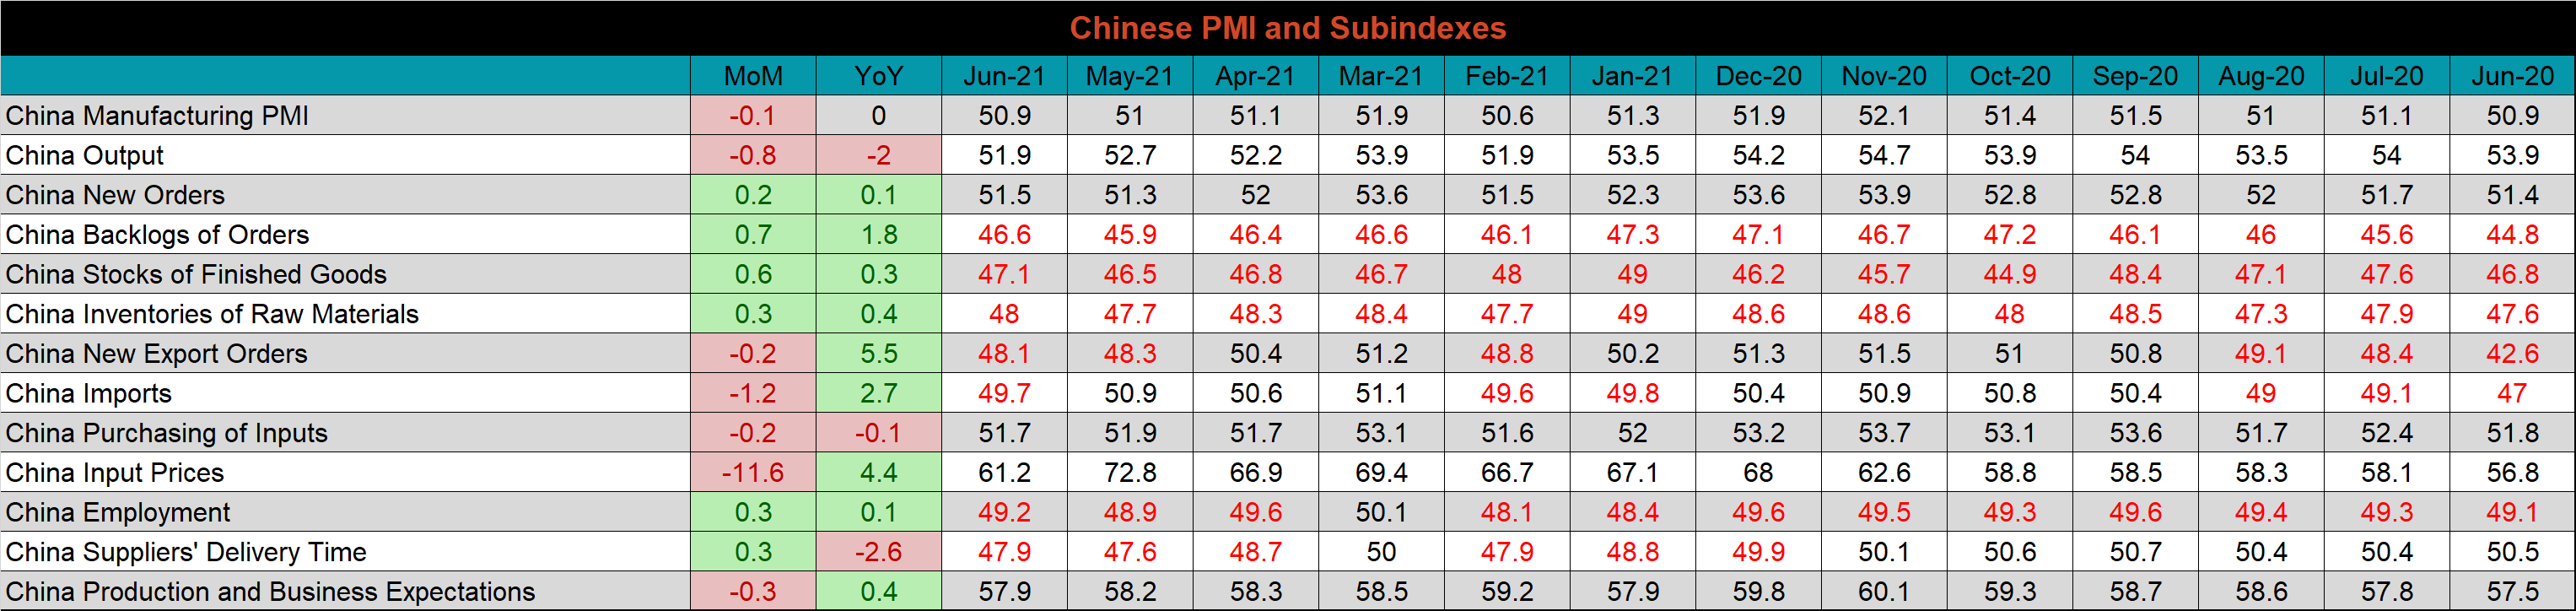
The table below breaks down China’s official manufacturing PMI subindexes. The input prices subindex moved down most significantly MoM but remains well in expansion territory and is putting significant pressure on the Chinese economy.
Construction Spending
May seasonally adjusted U.S. construction spending was down slightly, 0.3% compared to April but 7.5% higher than a year ago.
May U.S. Construction Spending
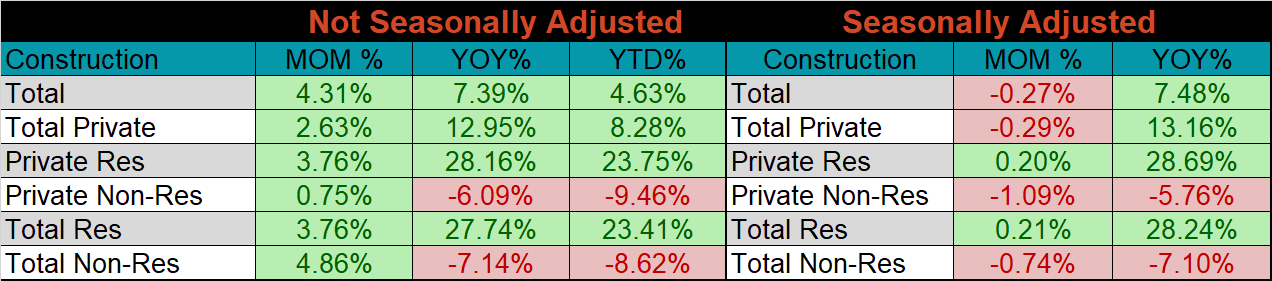
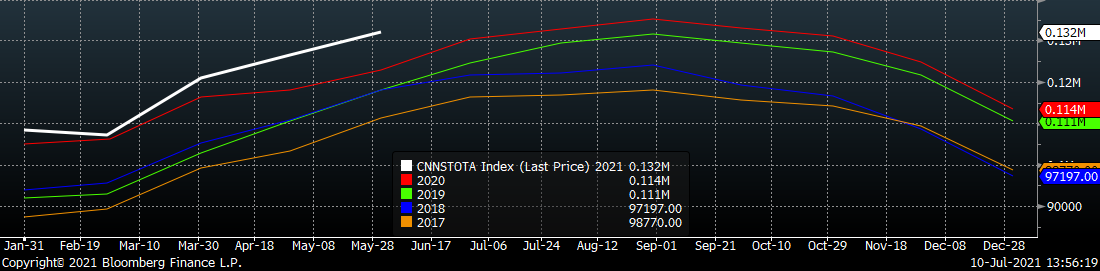
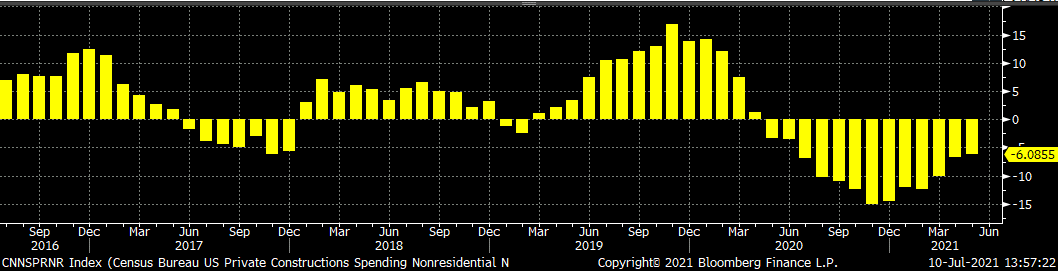
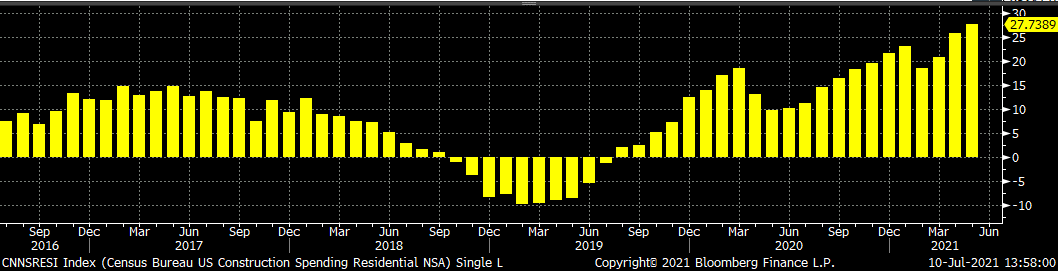
The white line in the chart below represents not seasonally adjusted construction spending in 2021 and compares it to the spending of the previous 4 years. Overall spending continues to expand and is at its highest level in the last 4 years. The last two charts show the YoY changes in construction spending. Private non-residential spending decreased further in April, for the thirteenth month in a row, however, the trend has been improving since December 2021. On the other hand, residential spending remains on fire compared to last year’s levels and is showing no signs of slowing down.
U.S. Construction Spending
U.S. Private Nonresidential Construction Spending NSA YoY % Change
U.S. Residential Construction Spending NSA YoY % Change
Durable Goods
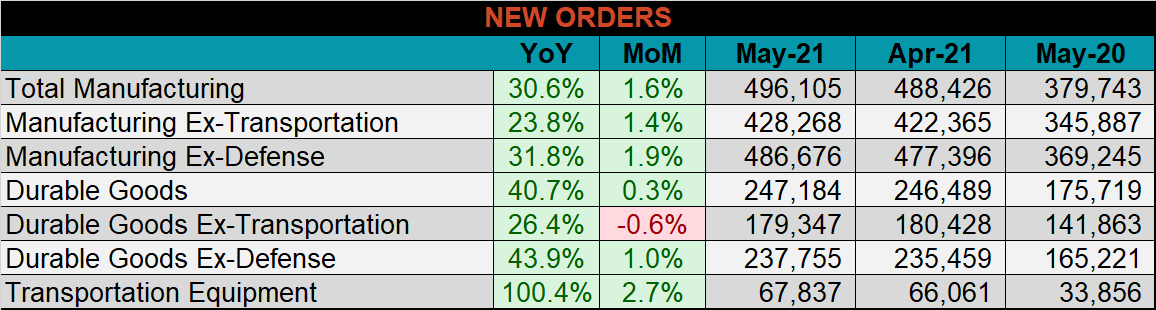
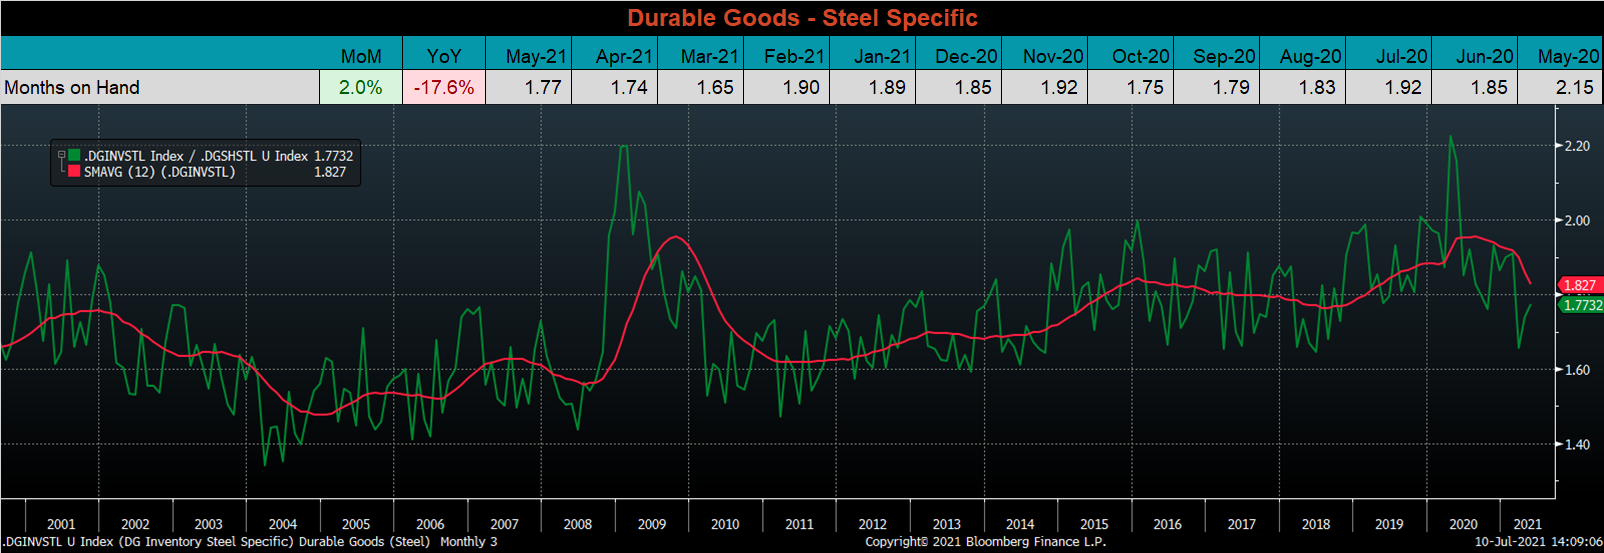
Below are final May new orders from the Durable Goods report. New orders for manufactured goods were up 30.6% compared to May 2020 and up 1.6% compared to May 2021. Manufacturing ex-transportation new orders were up 23.8% compared to May 2020 and 1.4% higher than in April. The final chart looks at the months on hand (inventory divided by shipments) for durable goods categories that are steel intensive. MOH continued to improve compared to April, but it remains below the 12-month moving average.
May U.S. Durable Goods New Orders NSA
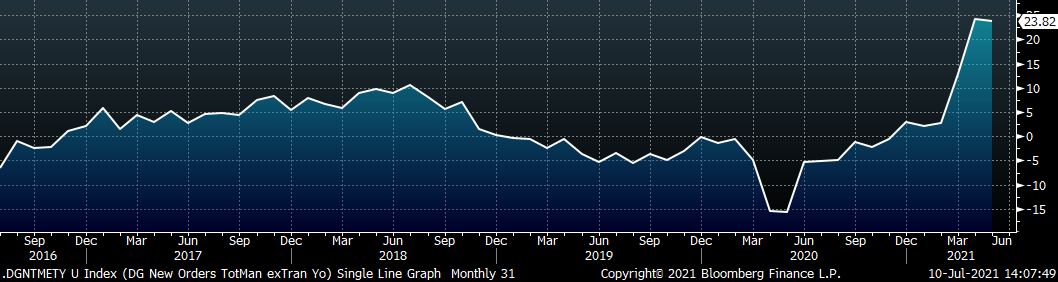
U.S. Total Manufacturing New Orders Ex-Transportation NSA YoY % Change
Auto Sales
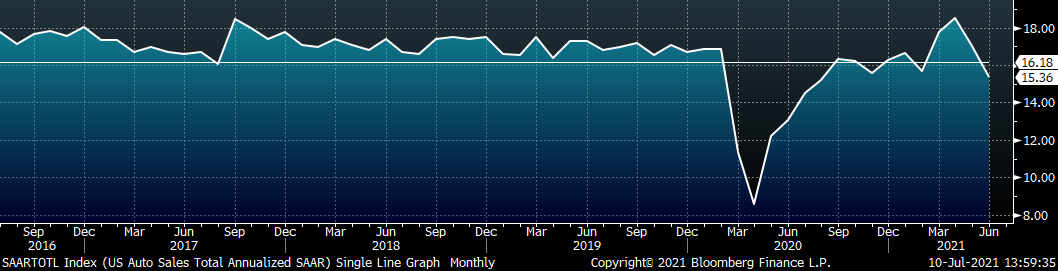
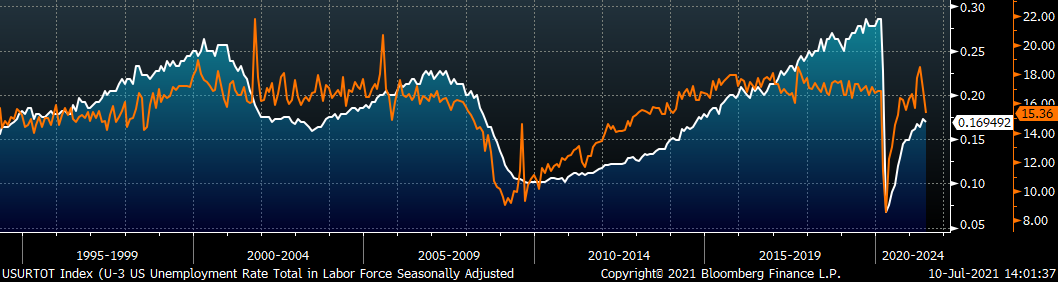
June U.S. light vehicle sales continued the move lower, to a 15.5m seasonally adjusted annualized rate (S.A.A.R) and moved below the 10-year average. The second chart shows the relationship between the unemployment rate and auto sales. The unemployment rate is inverted to show that declining unemployment typically leads to increasing auto sales. The labor market recovery slowed last month, as did auto sales. At this point, anecdotal evidence supports the thesis that the chip shortage is restricting auto sales and production, but that there is significant pent-up demand waiting for these issues to resolve.
June U.S. Auto Sales (S.A.A.R.)
June U.S. Auto Sales (orange) and the Inverted Unemployment Rate (white)
Risks
Below are the most pertinent upside and downside price risks:
Upside Risks:
- Higher share of discretionary income allocated to goods from steel intensive industries
- Strengthening global flat rolled and raw material prices
- Unplanned & extended planned outages
- Low current import levels
- Declining/low inventory levels at end users and service centers
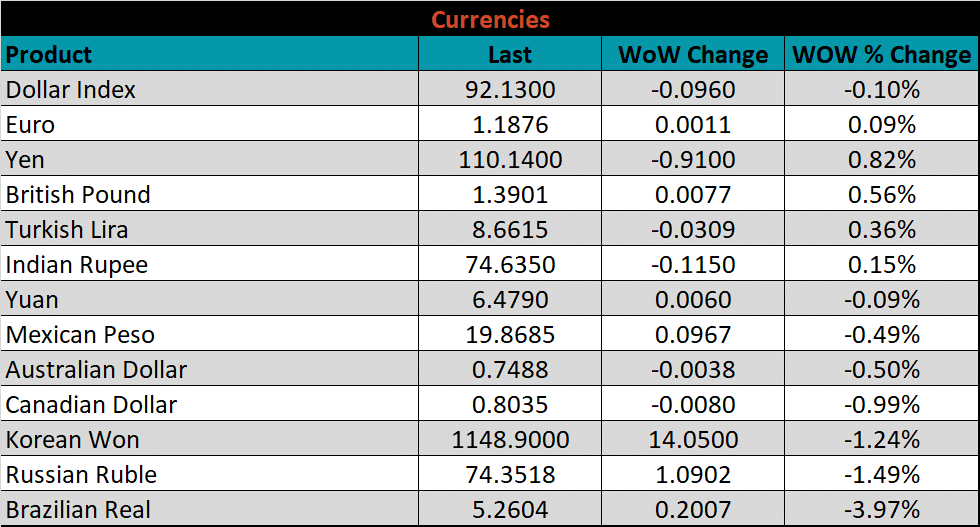
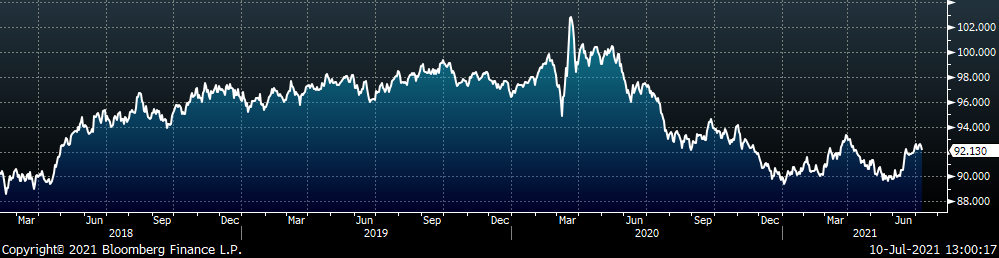
- Broad increases in commodity prices due to a weakening US Dollar
- Limited spot transactions skewing market indexes to extreme levels
Downside Risks:
- Increased domestic production capacity
- Increasing price differentials and hedging opportunities leading to higher imports
- Steel consumers substitute to lower cost alternatives
- Steel buyers and consumers “double ordering” to more than cover steel needs
- Weak labor and construction markets
- Tightening credit markets, as elevated prices push total costs to credit caps
- Reduction and/or removal of domestic trade barriers
- Supply chain disruptions allowing producers to catch up on orders
HRC Futures
All of the below data points are as of July 9, 2021.
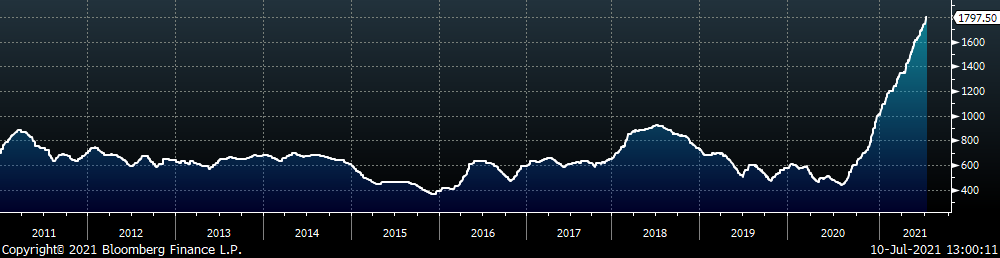
The Platts TSI Daily Midwest HRC Index increased by $54.75 to $1,797.50.
Platts TSI Daily Midwest HRC Index
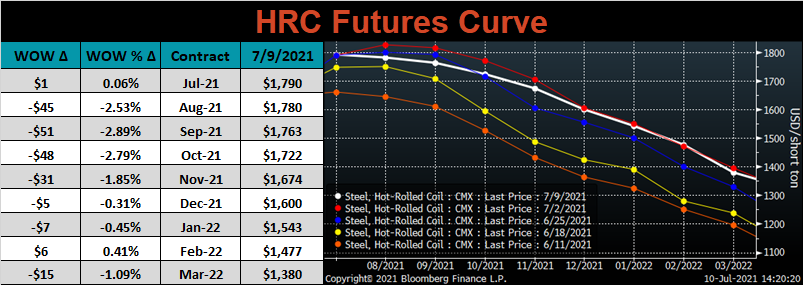
The CME Midwest HRC futures curve is below with last Friday’s settlements in white. Last week, most of the curve shifted lower, most significant in front expirations.
August ferrous futures were mixed. The Chinese HRC future gained 7.7%, while busheling was down 2.8%.
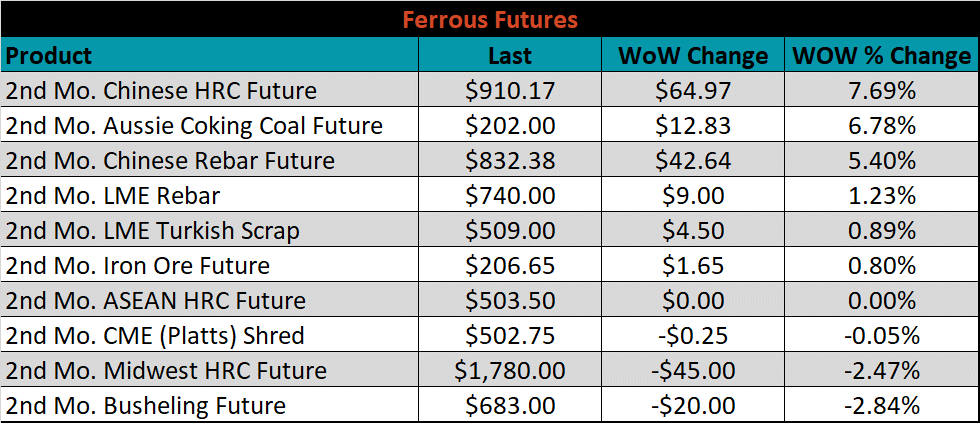
Global flat rolled indexes were mixed. Chinese spot HRC price was up 4%, while the Black Sea HRC price was down 2.3%.
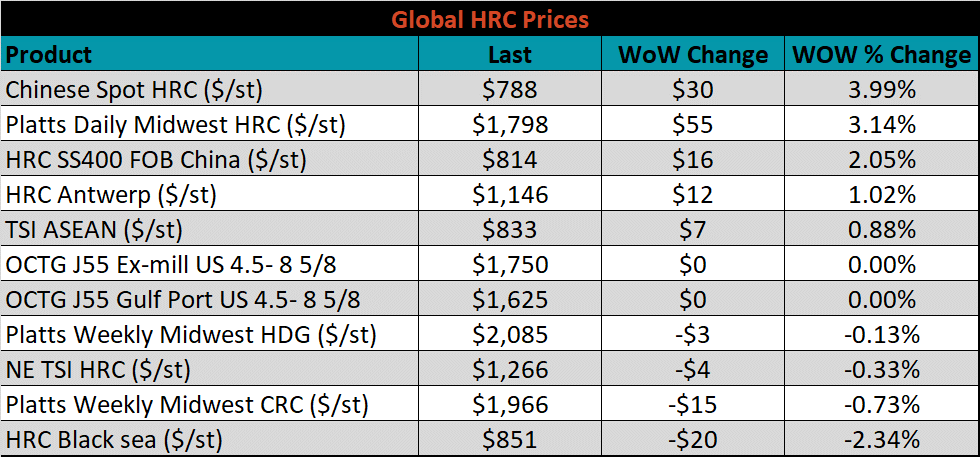
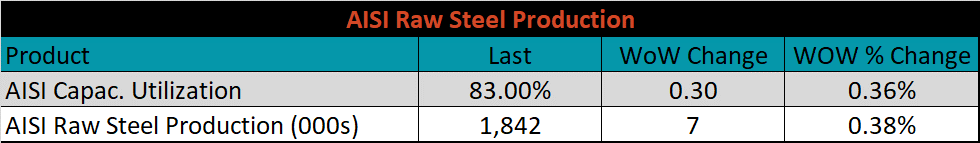
The AISI Capacity Utilization rate increased 0.3% to 83%.
AISI Steel Capacity Utilization Rate (orange) and TSI Daily HRC Price (white)
Imports & Differentials
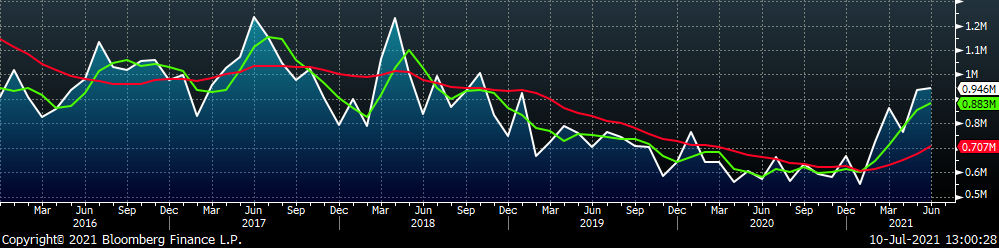
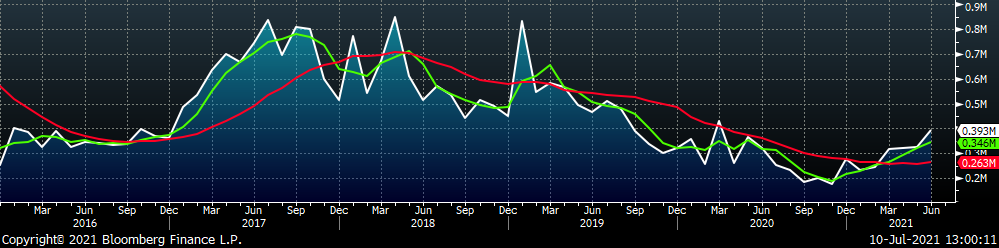
June flat rolled import license data is forecasting an increase of 9k to 946k MoM.
All Sheet Imports (white) w/ 3-Mo. (green) & 12-Mo. Moving Average (red)
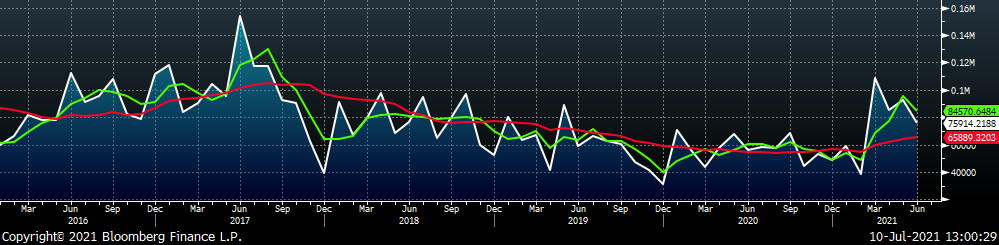
Tube imports license data is forecasting an increase of 67k to 393k in June.
All Tube Imports (white) w/ 3-Mo. (green) & 12-Mo. Moving Average (red)
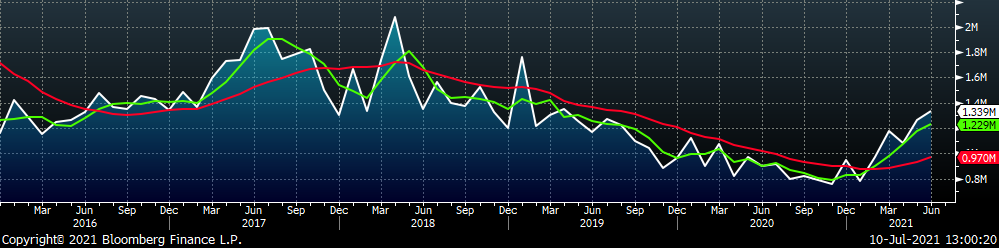
All Sheet plus Tube (white) w/ 3-Mo. (green) & 12-Mo. Moving Average (red)
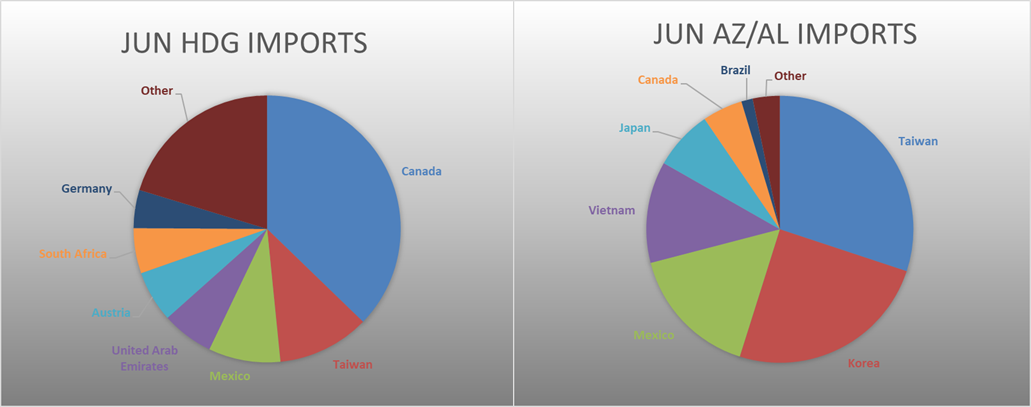
June AZ/AL import license data is forecasting a decrease of 16k to 76k.
Galvalume Imports (white) w/ 3 Mo. (green) & 12 Mo. Moving Average (red)
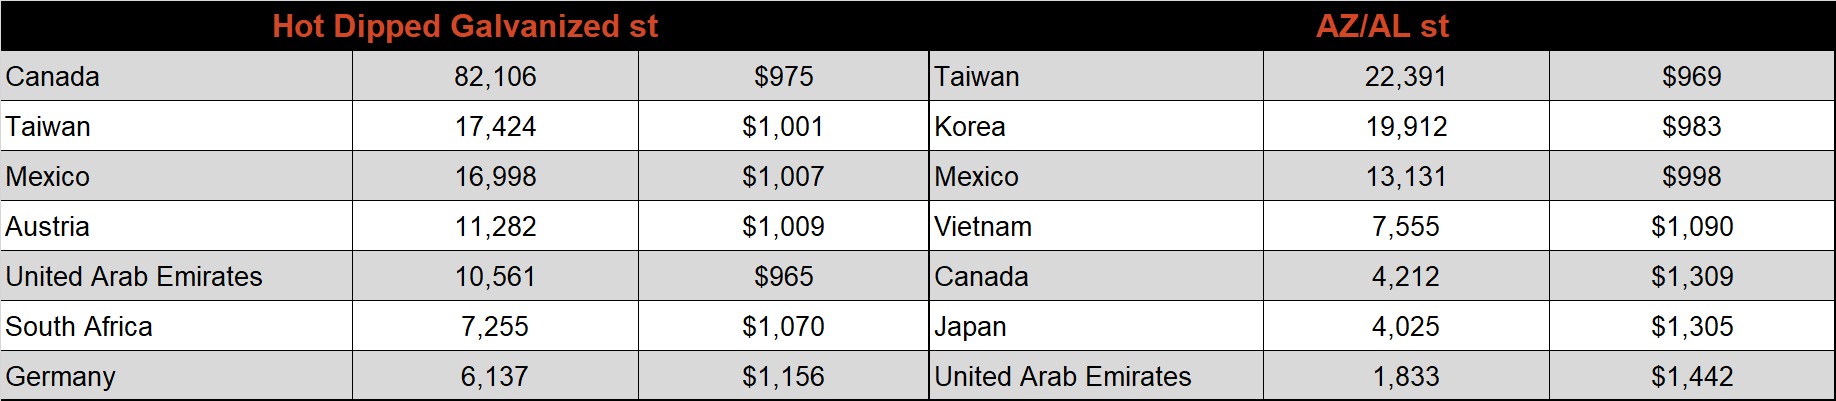
Below is June import license data through July 5th, 2021.
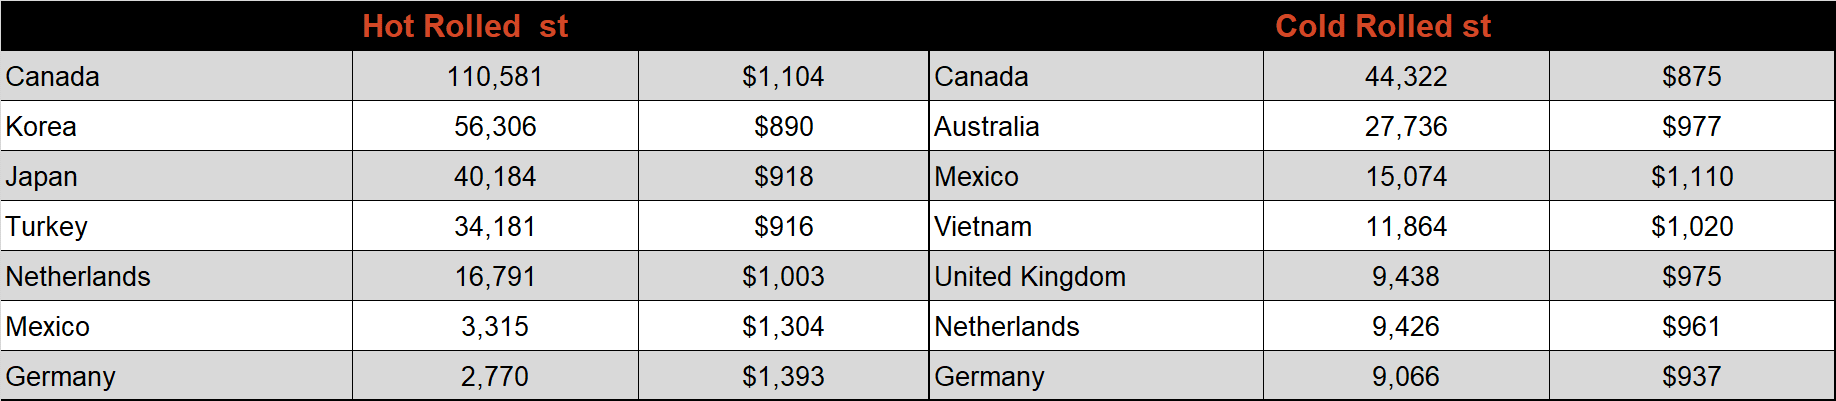
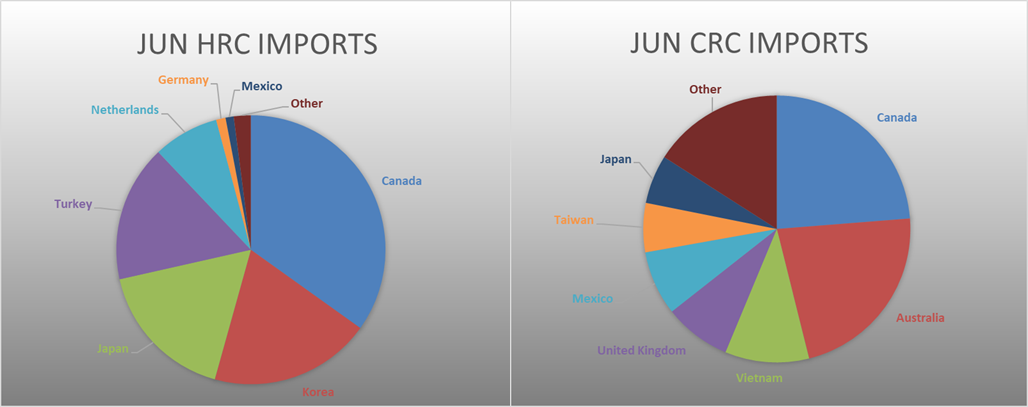
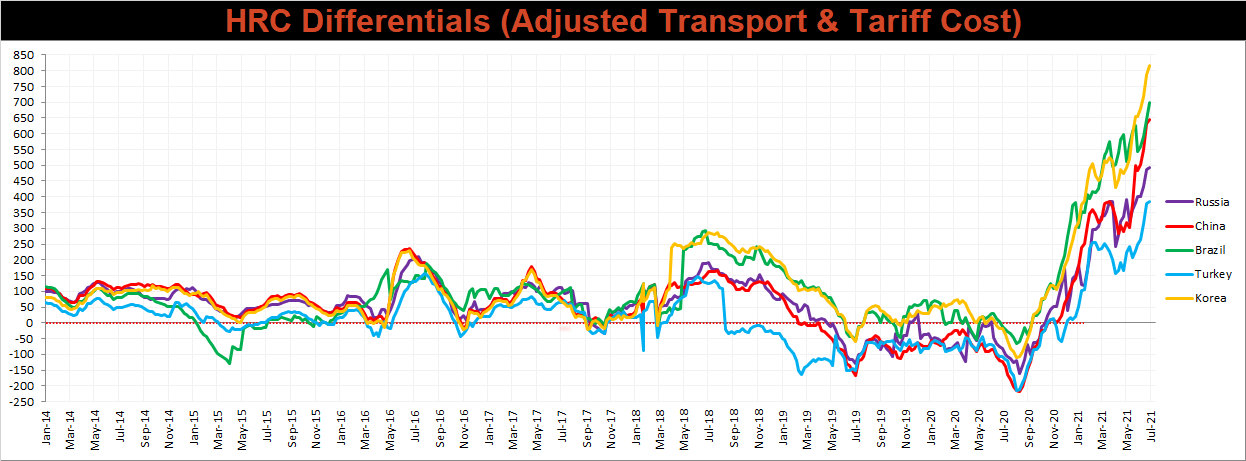
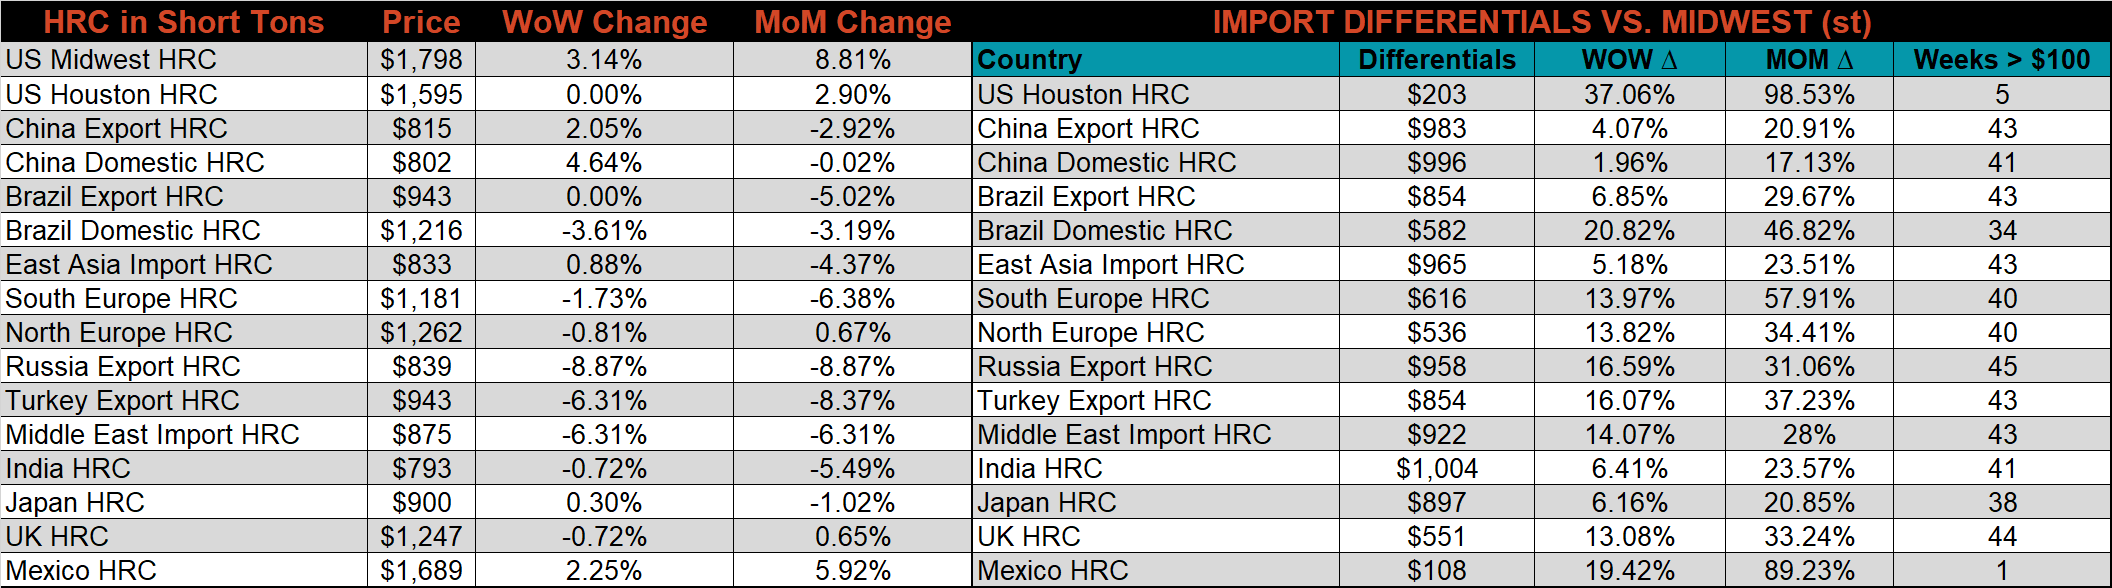
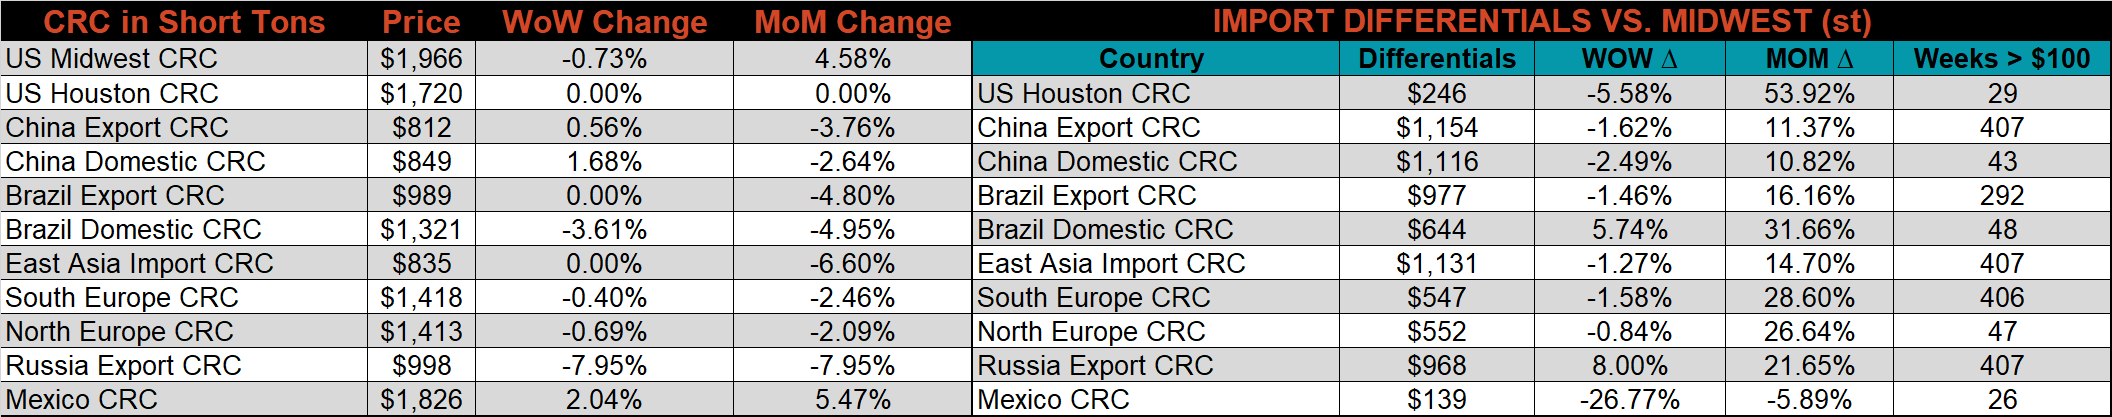
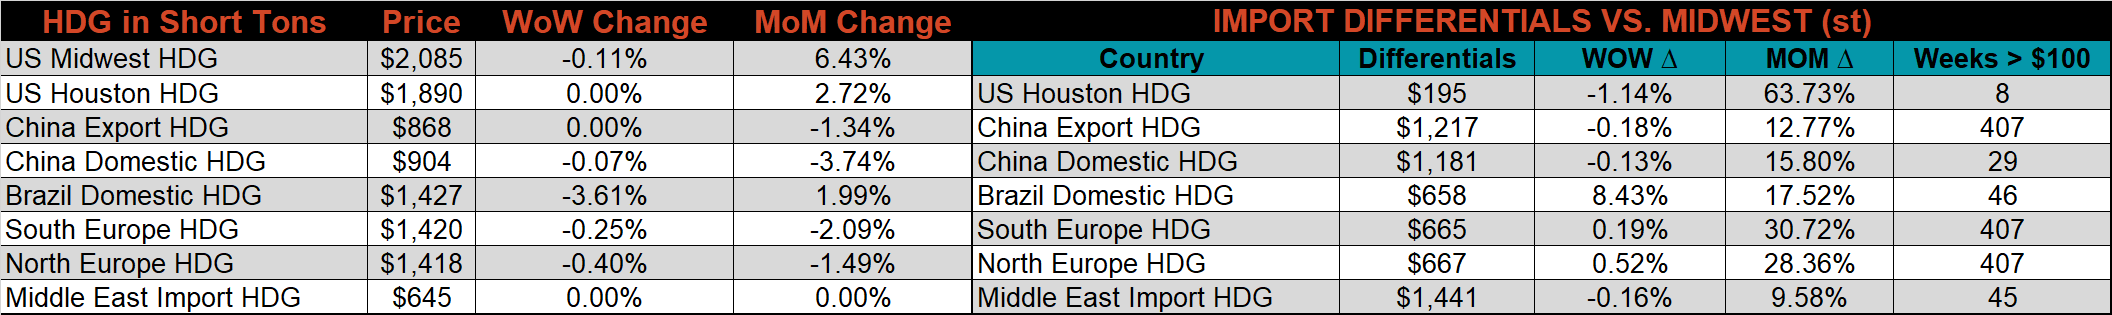
Below is the Midwest HRC price vs. each listed country’s export price using pricing from SBB Platts. We have adjusted each export price to include any tariff or transportation cost to get a comparable delivered price. All watched countries differentials increased this week, at U.S. prices continue to outpace the rest of the world.
SBB Platt’s HRC, CRC and HDG pricing is below. The Midwest HRC price was up 3.1%, while the CRC & HDG prices we down 0.7, and 0.1%, respectively. Globally, the Russian export HRC price was down 8.9%.
Raw Materials
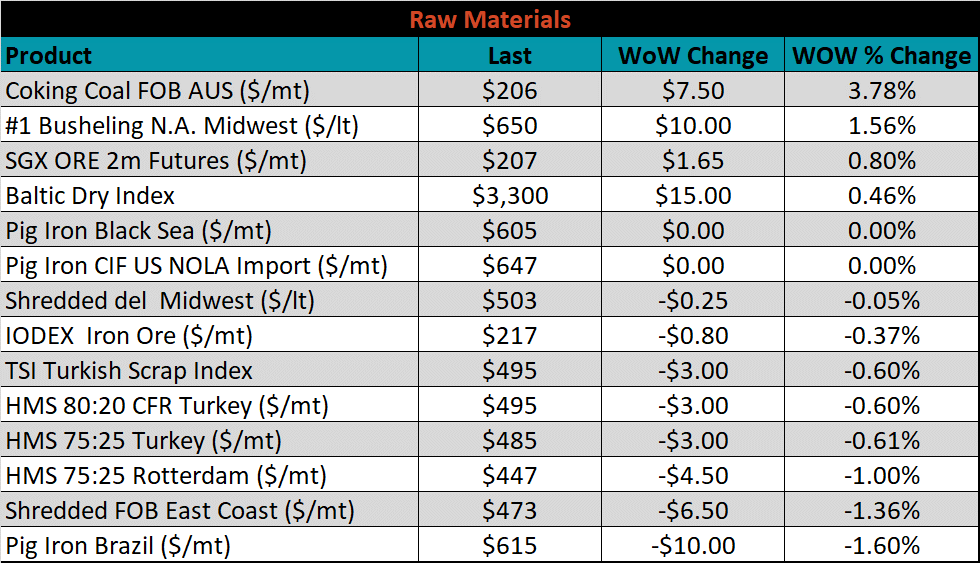
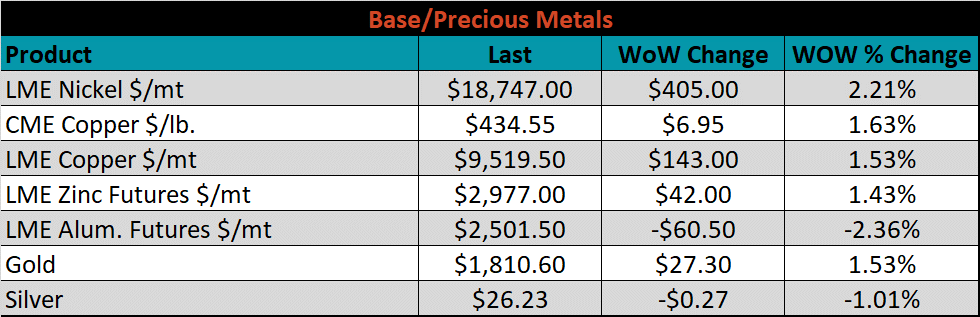
Raw material prices were mixed, with Aussie coking coal up another 3.8%, while Black Sea pig iron was down 1.6%.
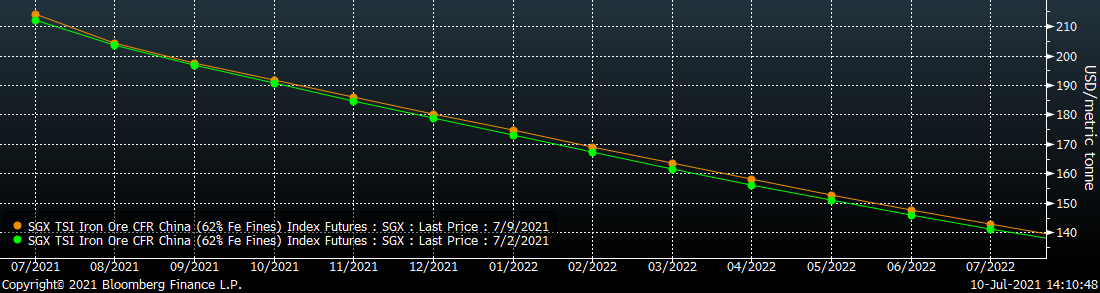
Below is the iron ore future curve with Friday’s settlements in orange, and the prior week’s settlements in green. Last week, the majority of the curve shifted slightly higher, with the exception of August and September expirations which were flat.
SGX Iron Ore Futures Curve
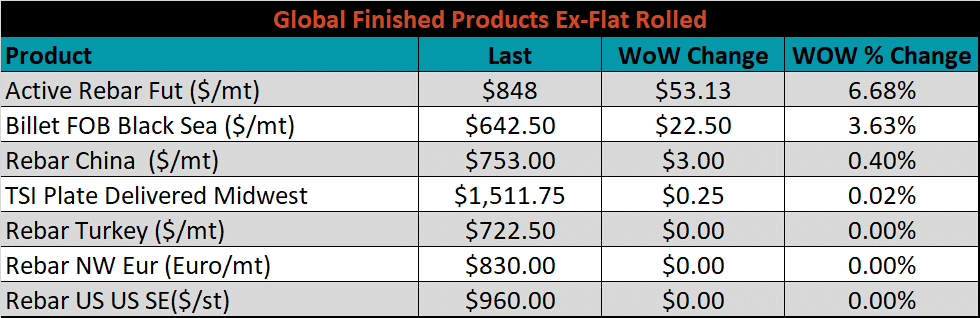
The ex-flat rolled prices are listed below.

Energy
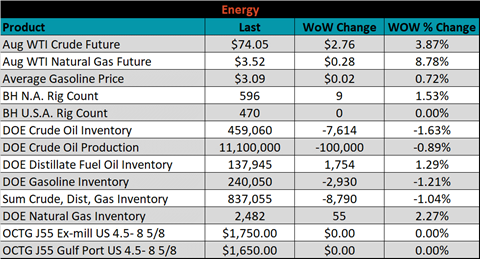
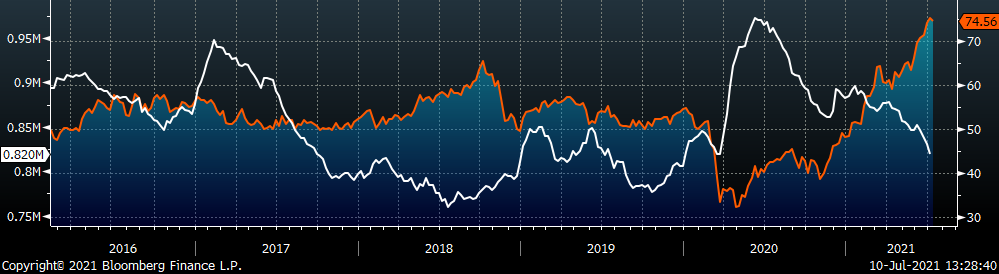
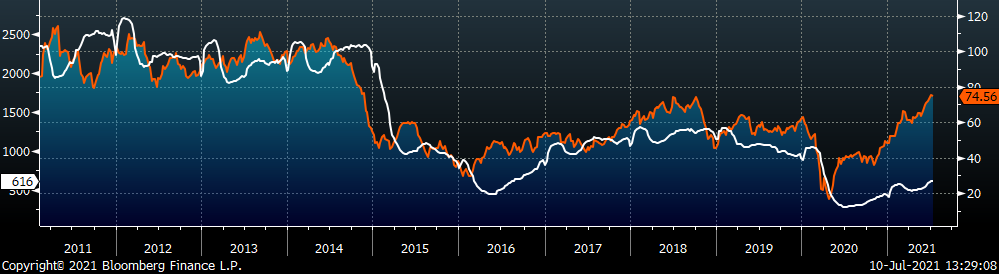
Last week, the August WTI crude oil future was down $0.60 or 0.8% to $74.56/bbl. The aggregate inventory level was down 1.4%, and crude oil production was up to 11.3m bbl/day. The Baker Hughes North American rig count was up 5 rigs, and the U.S. rig count was up 4 rigs.
August WTI Crude Oil Futures (orange) vs. Aggregate Energy Inventory (white)
Front Month WTI Crude Oil Future (orange) and Baker Hughes N.A. Rig Count (white)
The list below details some upside and downside risks relevant to the steel industry. The orange ones are occurring or look to be highly likely. The upside risks look to be in control.
Upside Risks:
- Higher share of discretionary income allocated to goods from steel intensive industries
- Changes in China’s policies regarding ferrous markets, including production cuts and imports
- Strengthening global flat rolled and raw material prices
- Unplanned & extended planned outages, including operational issues leaving mills behind
- Declining/low inventory levels at end users and service centers
- Broad increases in commodity prices due to a weakening US Dollar
- Limited spot transactions skewing market indexes to extreme levels
- Chinese economic stimulus measures
- Fiscal policy measures including a new stimulus and/or infrastructure package
- Low interest rates
- China strict steel capacity cuts
- Energy industry rebound
- Unexpected inflation
- Further section 232 tariffs and quotas restricting supply
Downside Risks:
- Increased domestic production capacity
- Increasing price differentials and hedging opportunities leading to higher imports
- Steel consumers substitute to lower cost alternatives
- Steel buyers and consumers “double ordering” to more than cover steel needs
- Weak labor and construction markets
- Tightening credit markets, as elevated prices push total costs to credit caps
- Reduction and/or removal of domestic trade barriers
- Supply chain disruptions allowing producers to catch up on orders
- Political & geopolitical uncertainty
- Weak global economics/PMIs
- Trade slowdown in China due to tensions with US, Hong Kong, and others
- Domestic automotive industry under pressure
- Chinese restrictions in property market
- The Chinese Financial Crisis
- Unexpected sharp China RMB devaluation