Content
-
Weekly Highlights
- Market Commentary
- Upside & Downside Risks


In the physical market, HRC spot prices continued their grind lower, with further downward pressure and shorter lead times clearly ahead. While we continue to believe that steel prices will not collapse, we do anticipate choppy waters for the remainder of the year, where steps lower in price are continually met with resistance as buyers reenter the market to fulfill their already existing large backlogs. In the remainder of this report, we will dig into the recent macroeconomic shifts in interest rates, inflationary pressure, and the Federal Reserve. While the daily fluctuations of these forces will likely have little impact on your business, overarching trends are starting to emerge. Understanding the potential risks will be vital as we turn to 2022.
Broadly speaking, the Federal Reserve operates under their “dual mandate” where the expressed goals are 1) Price stability and 2) Maximum sustainable employment. How this is done in practice is by the setting of interest rates provided to banks. In turn these rates impact what is available to consumers in the broad economy. Plainly, as interest rates are reduced, banks are incentivized to lend money. The result is that consumers have more money to spend, and the economy grows, which leads to more opportunities and higher employment. This also leads to increased inflation, as consumers with a surplus of money compete to buy a limited number of goods. As a response to this dynamic, the Fed will increase interest rates, which incentivizes saving, rather than investing, resulting in a slower economy and lower inflation.
As things stand, there is clearly significant inflationary pressure moving through the economy. It is a biproduct of unprecedented stimulus by the U.S. government and 2020 interest rate cuts by the Fed, both reacting to the pandemic caused recession.
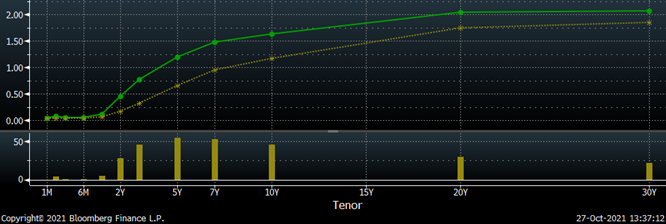
In the face of record levels of inflation, the Fed holds the expressed perspective that this jump in inflation is transitory, meaning the increase in prices will eventually lose momentum and normalize around the 2% level. For this to be the case, we will have to see an easing of commodity prices and supply chain pressure as well as stable demand in the months ahead. Additionally, the FED has already signaled a more hawkish monetary policy with an expected removal of quantitative easing and moderate rate hikes next year. By broadcasting plans for these increases into 2022 & 2023, the Fed retains a measured approach, and the tightening of financial conditions should also facilitate a more moderate and stable pace of demand. The most significant downside risk is that current inflation is not, in fact, transitory and commodity prices broadly continue to increase. This would cause the Fed to quickly act with a shock of interest rate hikes that could threaten the pace of economic growth. Financial markets at large appear to agree with the Fed that inflation will moderate. Since early August, the U.S. Treasury Yield Curve, has steeped due to more significant increases in longer term expirations. The chat below shows the curve on August 2nd (dotted yellow) versus the curve from Friday, October 22nd (solid green). This is a sign that the market anticipates moderately higher interest rates, stable inflation, and economic growth in the future.
Turning to what this means for the steel market and demand, the recent peak in the HRC price is in fact one signal that recent inflation is transitory. Prices lost their momentum late this summer and began to turn around based on buyers’ ability to begin building inventories and inability to continue passing on higher prices. As is frequently the case, HRC prices overshot sustainable long-term levels, however, this rally proved that some of the long-held assumptions about the price of steel simply were not true. First, that demand for steel could not survive with prices above $800, $1,000, or even $1,200 per ton. Second, looking to the forward curve as a predictor of price is a costly mistake. Going forward, our base case, which is supported by what is priced into the treasury curve, the current spot market, the Federal Reserve outlook, and historical rally analysis, is that prices will move lower at a gradual pace, but we will not return to pre-Covid levels. Higher HRC prices may have shocked you, but they did not shock the broader economy.

Below are the most pertinent upside and downside price risks:
Upside Risks:
Downside Risks:

The Platts TSI Daily Midwest HRC Index increased by $2.50 to $1,902.50.

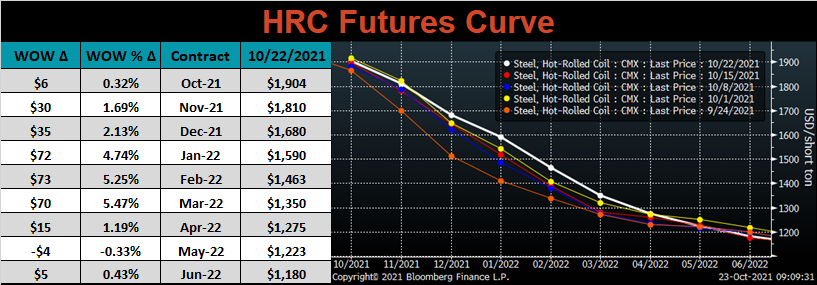
The CME Midwest HRC futures curve is below with last Friday’s settlements in white. Last week, the curve was mostly higher, with 1Q22 expirations up most significantly, around $70.
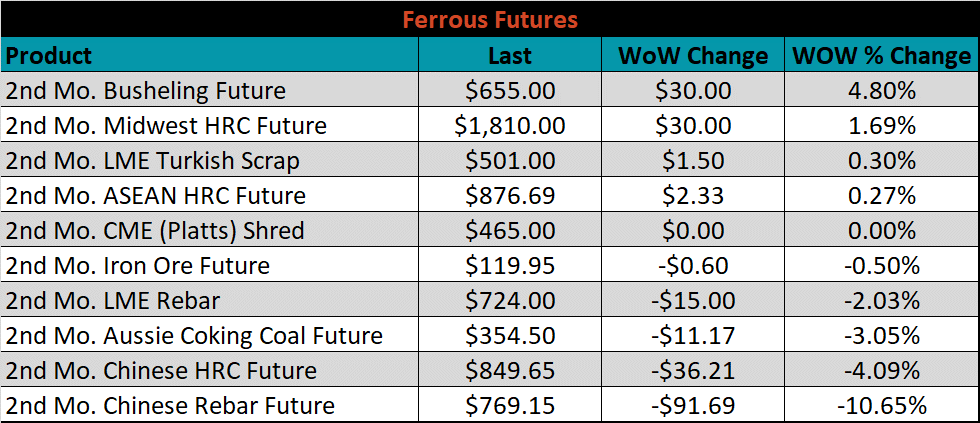
November ferrous futures were mixed. Busheling gained 4.8%, while Chinese rebar lost another 10.7%.
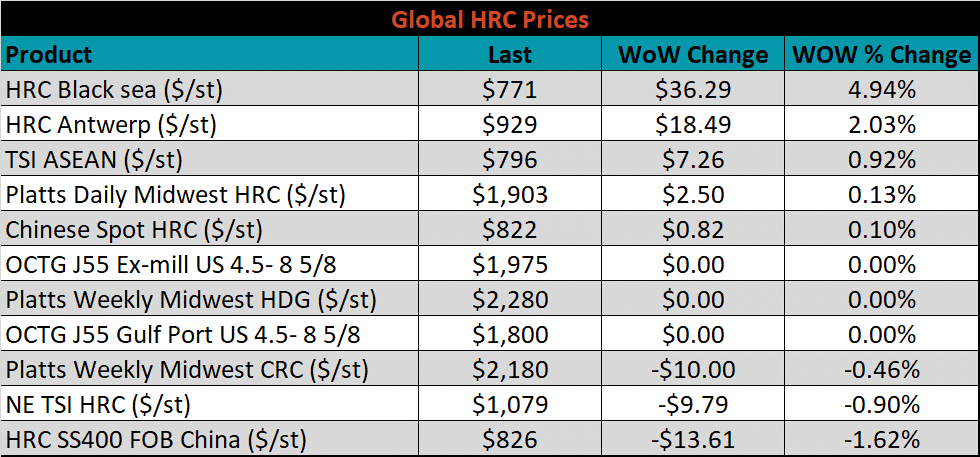
Global flat rolled indexes were mixed as well, with Black Sea HRC up another 4.9%, while the Chinese HRC export price was down 1.6%.
The AISI Capacity Utilization was up 1.1% to 85.3%.


October flat rolled import license data is forecasting an increase of 5k to 1,068k MoM.

Tube imports license data is forecasting a decrease of 211k to 278k in October.


October AZ/AL import license data is forecasting a decrease of 22k to 105k.

Below is October import license data through October 18th, 2021.

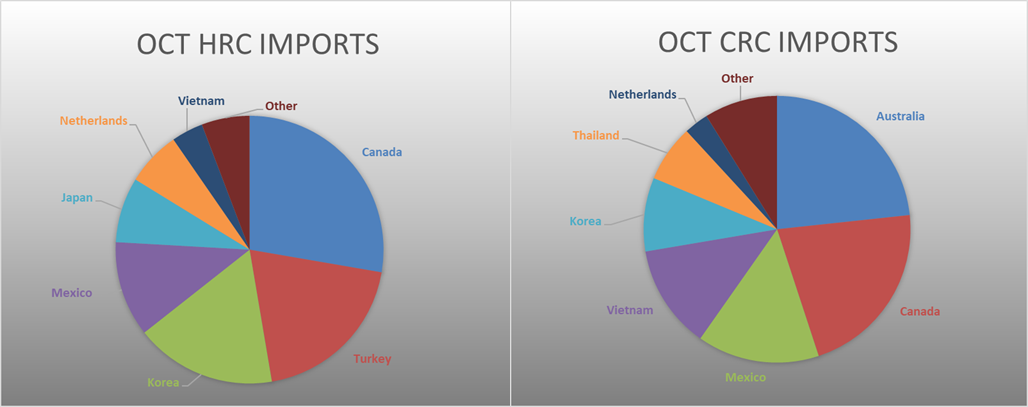

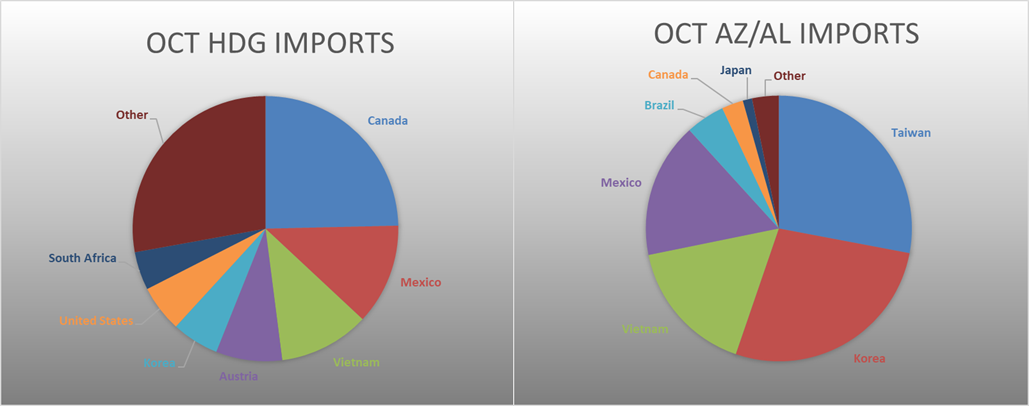
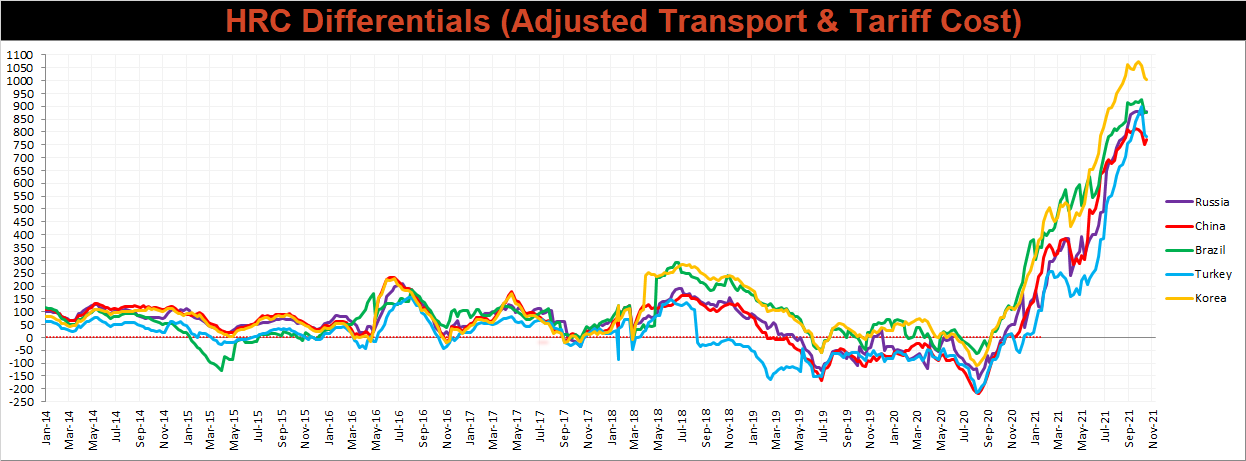
Below is the Midwest HRC price vs. each listed country’s export price using pricing from SBB Platts. We have adjusted each export price to include any tariff or transportation cost to get a comparable delivered price. Differentials decreased for Korea and Turkey, as their prices increased more than the U.S. domestic price.
SBB Platt’s CRC, HDG and HRC pricing is below. The Midwest HDG price was unchanged, while the HRC price was up 0.1%, and the CRC price was down 0.5%. Outside of the U.S., the Chinese domestic HRC price was down 3.6%.


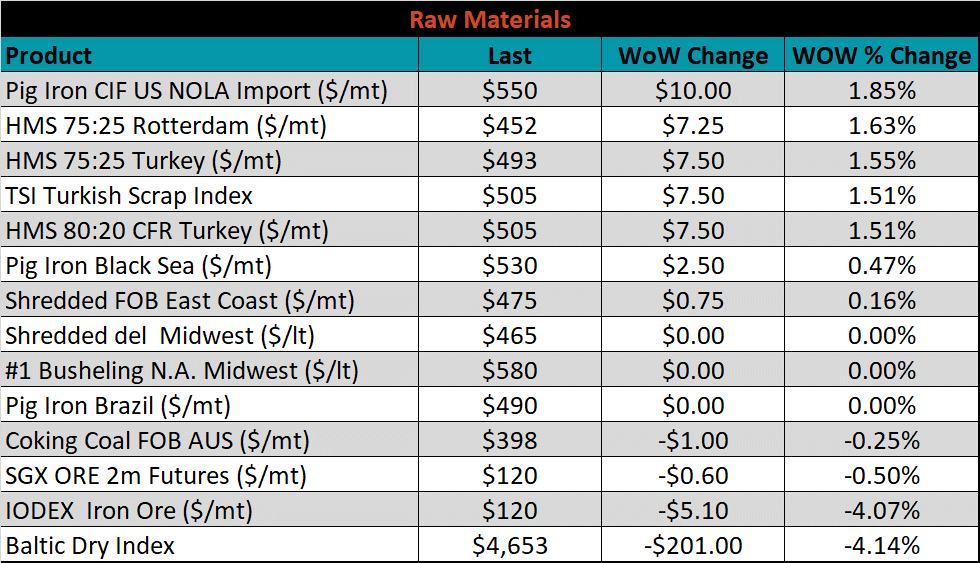
Raw material prices were mixed. New Orleans imported pig iron was up 1.9%, while the IODEX iron ore index was down 4.1%.
Below is the iron ore future curve with Friday’s settlements in orange, and the prior week’s settlements in green. Last week, the entire curve was shifted lower, more significantly in the front month expirations than in the back.

The ex-flat rolled prices are listed below.


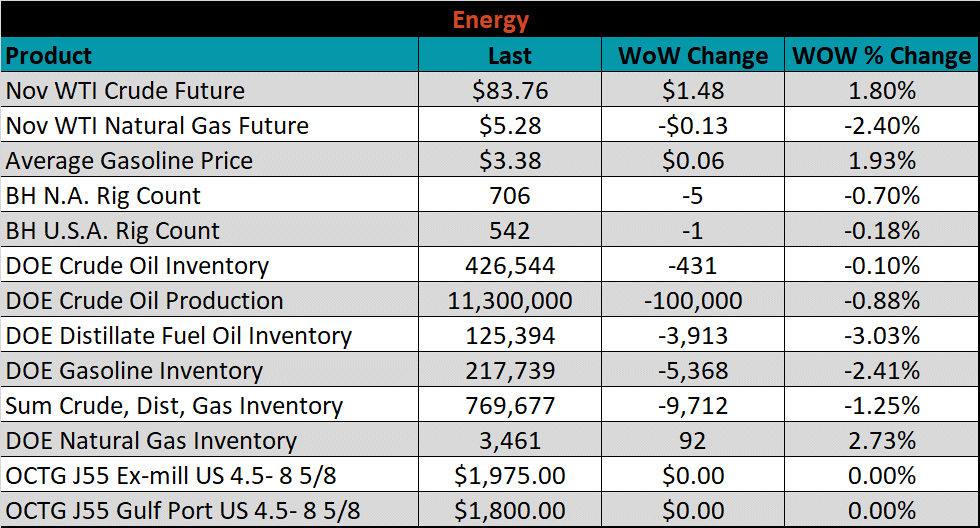
Last week, the November WTI crude oil future was up another $1.48 or 1.8% to $83.76/bbl. The aggregate inventory level was down 1.3%, and crude oil production dipped to 11.3m bbl/day. The Baker Hughes North American rig count was down 5 rigs, and the U.S. rig count was down 1 rig.


The list below details some upside and downside risks relevant to the steel industry. The bolded ones are occurring or highly likely.
Upside Risks:
Downside Risks: