Content
-
Weekly Highlights
- Market Commentary
- Upside & Downside Risks


In last week’s report we referenced a recent shift in mill behavior, where they are turning away orders that don’t fit their book and pushing back on low offers even to the point of leaving tons on the table. Since then, that dynamic has started picking up steam. For weeks, mills have been pointing to March/April as a pivot point for the falling market. This is largely because of the significant number of planned outages from all domestic producers, as well as the fact that warmer weather and the corresponding increase in economic activity will start to kick in. This is further compounded by the recent announcement from Cleveland Cliffs that they are indefinitely idling blast furnace #4 at Indiana Harbor. Additionally, imports are arriving at a significantly slower pace than in Q4. We are less than one week away from the beginning of March, and it is a compelling case. Our view is that since actual transaction pricing remains below the published spot prices and most reports indicate that end users are comfortable with their current inventories, published prices will continue to fall over the coming weeks. We are, however, quickly approaching an inflection point, and the fundamental support for HRC is consolidating around $1,000. While it is possible that the price could continue push below that level in the short-term, an important question to ask yourself is what will happen next.
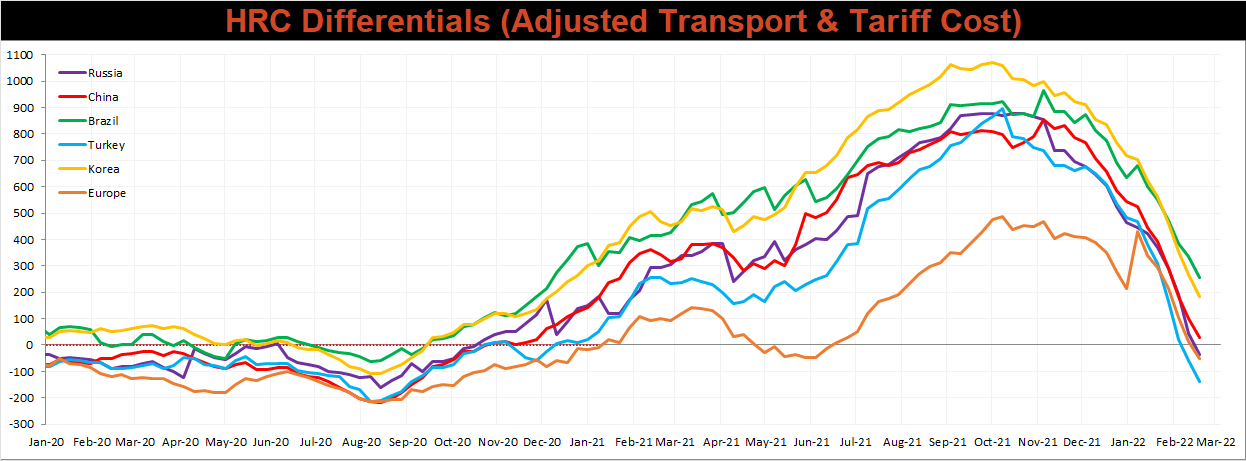
We continue to reference global strength in pricing, and the chart below shows the 3rd month HRC future (currently April) minus current global export prices.
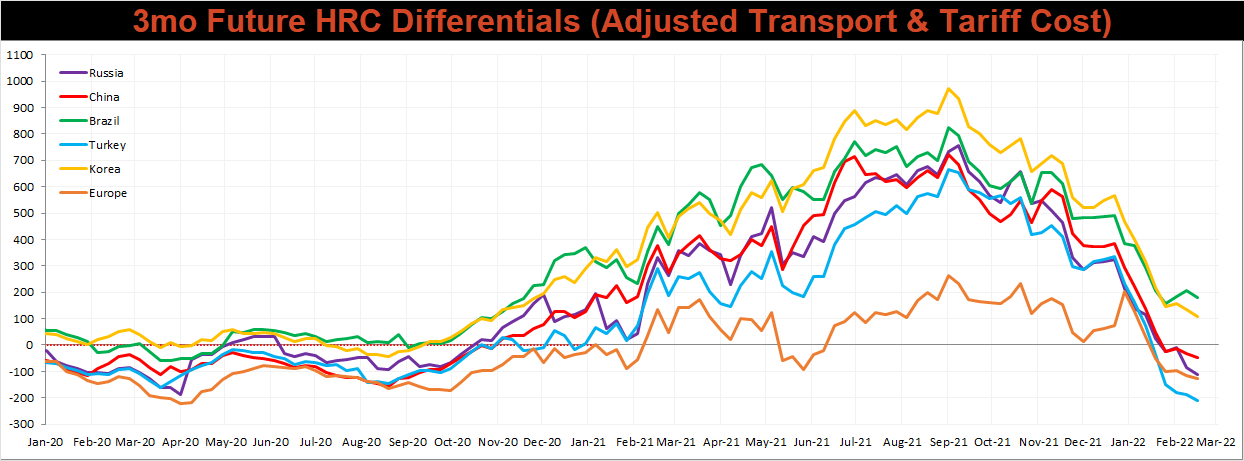
Once you adjust for existing tariffs and transportation costs, near-term domestic prices are below the rest of the world (except for Korea and Brazil, who are both on quotas). This price correction has already led to a nearly 50% decline in HRC price, but now, it is losing downward momentum. As more of these support levels are reached and mills take off production, the last gasp of a falling “spot market” will happen sooner than you think. As it currently stands, the futures curve allows you to lock in the remainder of the year below $1,000. It is important to note that prices in 2H22 have been increasing since late January, even as the spot price has fallen. If you are only focused on getting the lowest price on you spot material today, these opportunities may pass you by. Historically speaking, by the time the spot price reaches its bottom, the futures have already moved.

Below are the most pertinent upside and downside price risks:
Upside Risks:
Downside Risks:

The Platts TSI Daily Midwest HRC Index decreased by another $80 to $1,040.

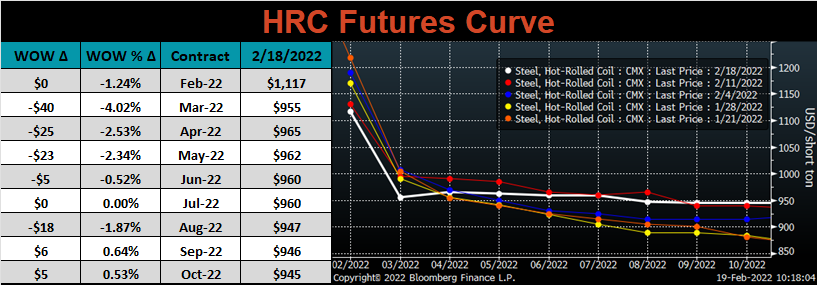
The CME Midwest HRC futures curve is below with last Friday’s settlements in white. The curve flattened further this week. The front of the curve was under pressure again as the spot price fell. The back was largely unchanged, with prices around the highest levels of the past month.
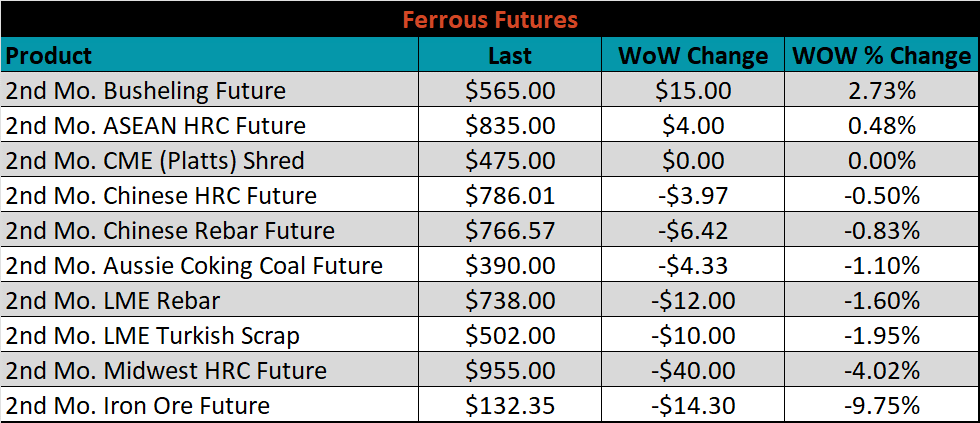
March ferrous futures were mixed. Midwest busheling gained another 2.7%, while iron ore lost 9.8%.
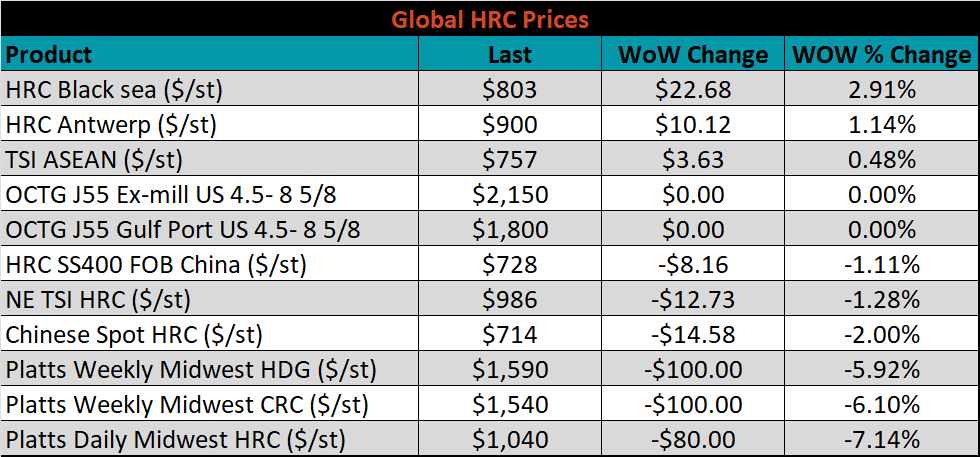
Global flat rolled indexes were mixed. Midwest HRC was down another 7.1%, while Black Sea HRC rose 2.9%.
The AISI Capacity Utilization was down another 1.3% to 79.8%. This represents the first time that capacity utilization has dipped below 80% since the end of May, last year.


February flat rolled import license data is forecasting a decrease of 314k to 855k MoM.

Tube imports license data is forecasting a decrease of 103k to 362k in February.


February AZ/AL import license data is forecasting a decrease of 6k to 106k.

Below is February import license data through February 14th, 2022.

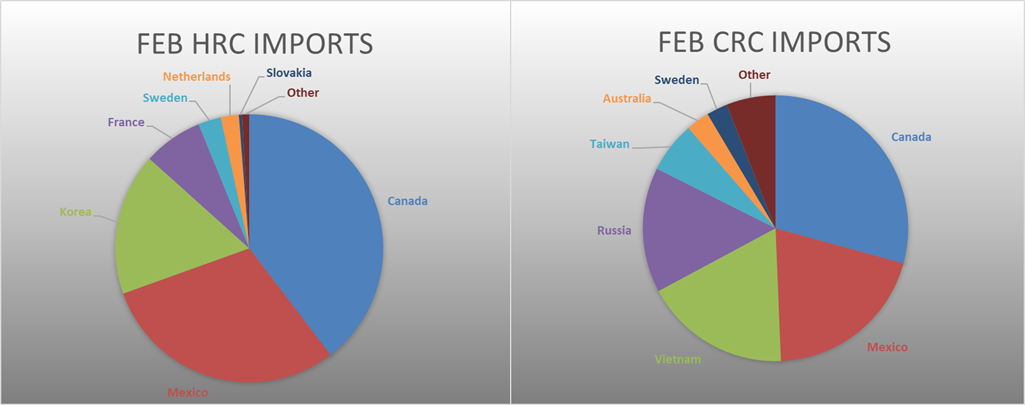

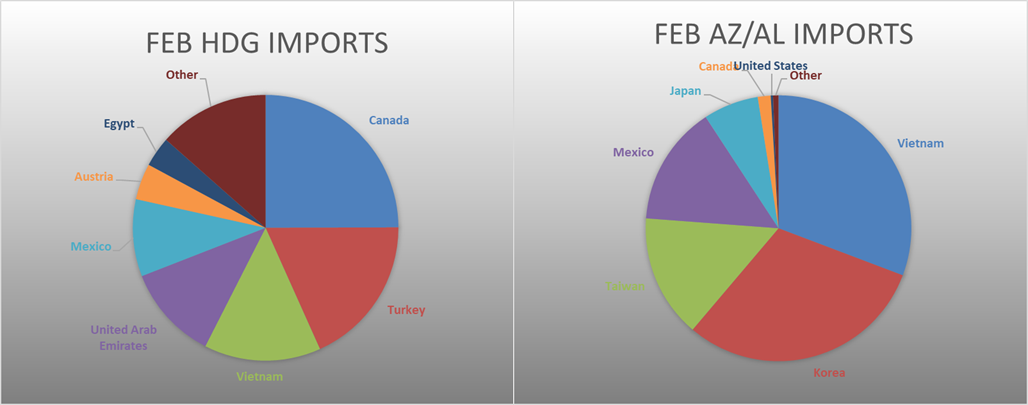
Below is the Midwest HRC price vs. each listed country’s export price using pricing from SBB Platts. We have adjusted each export price to include any tariff or transportation cost to get a comparable delivered price. All the watched countries differentials decreased again this week, as the domestic price continues to fall faster than all other global prices.
SBB Platt’s HRC, CRC and HDG pricing is below. The Midwest HRC, CRC, and HDG prices were down 7.1%, 6.1%, and 5.9%, respectively. Outside of the U.S., the Brazilian domestic HRC price was up, 3.6%.


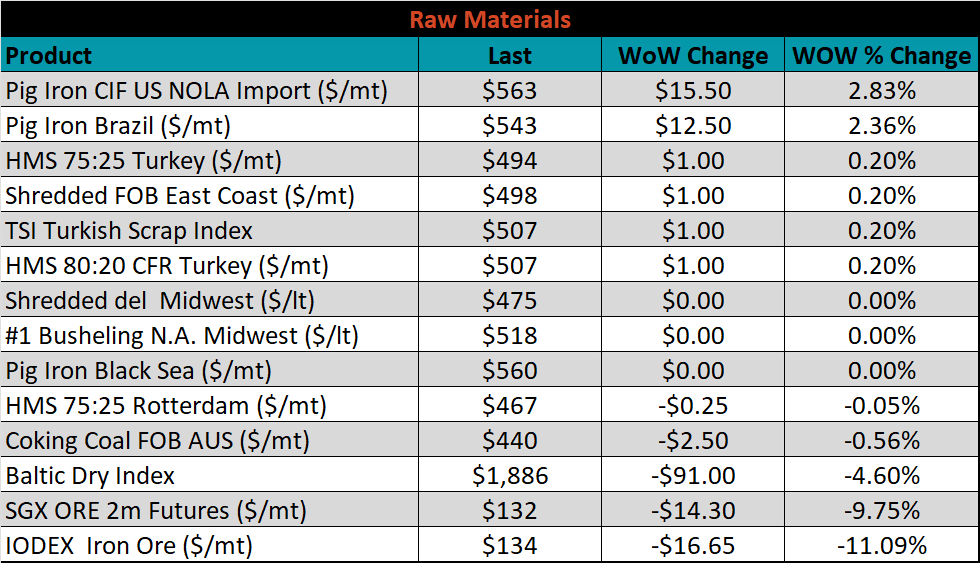
Raw material prices were mixed, with NOLA imported pig iron, up 2.8%, and the IODEX down 11.1%.
Below is the iron ore future curve with Friday’s settlements in orange, and the prior week’s settlements in green. Last week, the entire curve sold off sharply, most significantly in the March expiration.

The ex-flat rolled prices are listed below.


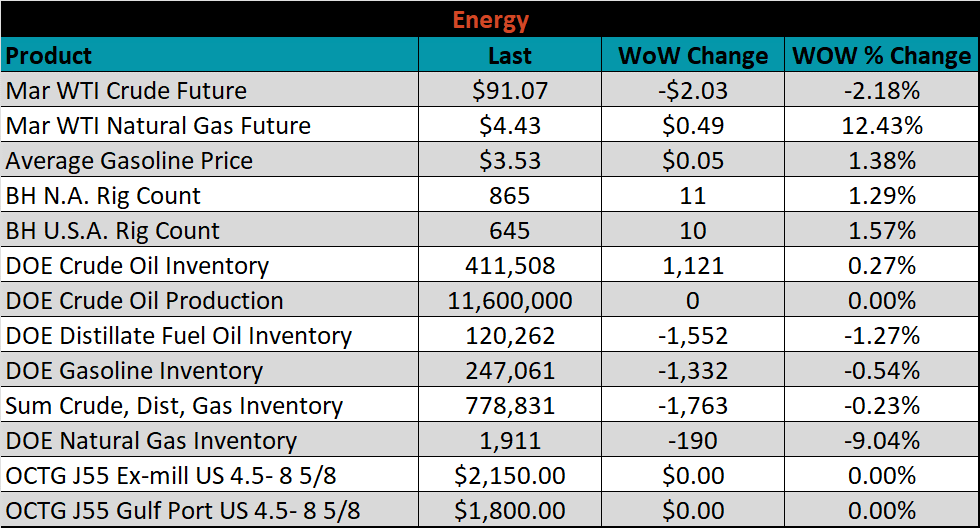
Last week, the March WTI crude oil future lost $2.03 or 2.2% to $91.07/bbl. The aggregate inventory level was down 0.2%, while crude oil production remains at 11.6m bbl/day. The Baker Hughes North American rig count was up by another 11 rigs, and the U.S. rig count was up 10 rigs.


The list below details some upside and downside risks relevant to the steel industry. The bolded ones are occurring or highly likely.
Upside Risks:
Downside Risks: