

March 4, 2022

Market Commentary
As the whole world continues to digest the vast implications of the Russian invasion into Ukraine, we turn to the U.S. domestic physical and financial steel market where the gap between the two has never been this pronounced. The physical market, while firmer now than other time since last summer, continues to be less responsive to the global news. We anticipate this to be short lived as foreign raw material and finished steel prices make their way to the domestic market, leading to astronomical upside risk in the physical market, similar to what is occurring in other commodity and metals markets. The most likely result will leave many reluctant domestic buyers burned and without good options for supply.
Turning to the financial market, this incredible about-face in pricing may seem like a shock. However, dynamics within the physical market between buyers and mills had already begun changing over the last 6 weeks. It was clear that there was significant upside risk for a strong rebound in 2022 curve pricing, regardless of the conflict. The rapid step-change in the curve obviously has a risk premium and significant supply uncertainty priced in, but steel consumption will always be the primary driver of prices. Even during the buyer’s strike driven by excess inventory levels, real steel demand (i.e. consumption) has been stable and strong.
The best support for this comes from this month’s economic data, all released at the beginning of the month, but collected mostly prior to the invasion. In it, we see faster growth rates within the manufacturing sector, 32 straight months of growing construction spending, and better than anticipated job growth. The key point is that the data below shows that the domestic steel market was bottoming prior to the Russian invasion. For buyers who are merely reacting to yesterday’s prices and not evaluating upcoming upside and downside risks, the impending rally is going to be yet another challenging environment.
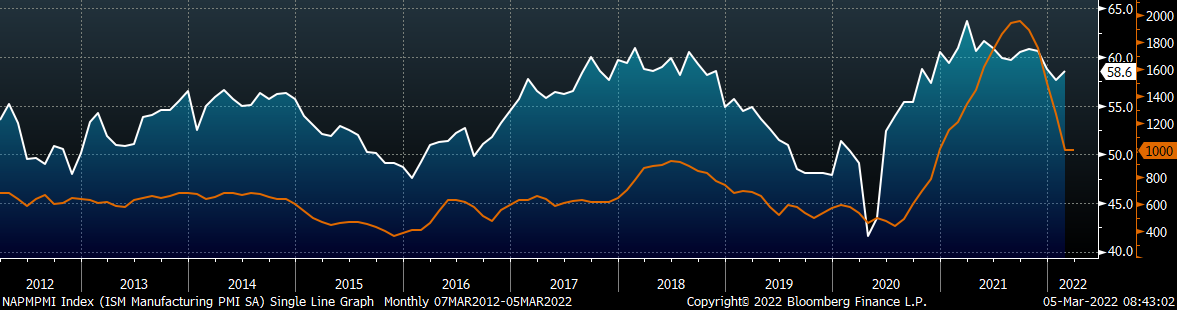
ISM PMI
The chart below is the Platts Midwest HRC index (orange) and the ISM Manufacturing PMI (white). The topline ISM Manufacturing PMI increased further, while the Midwest HRC price declined in February.
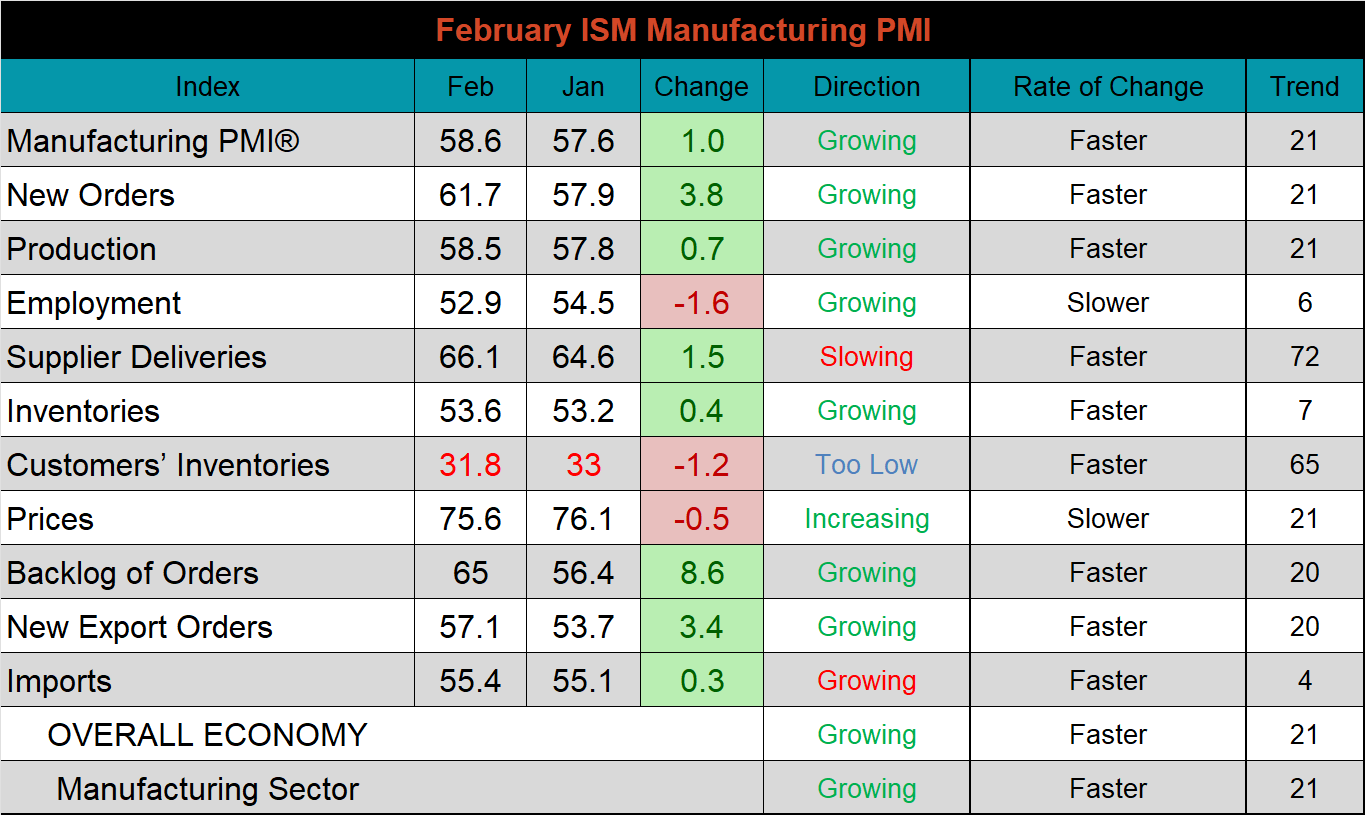
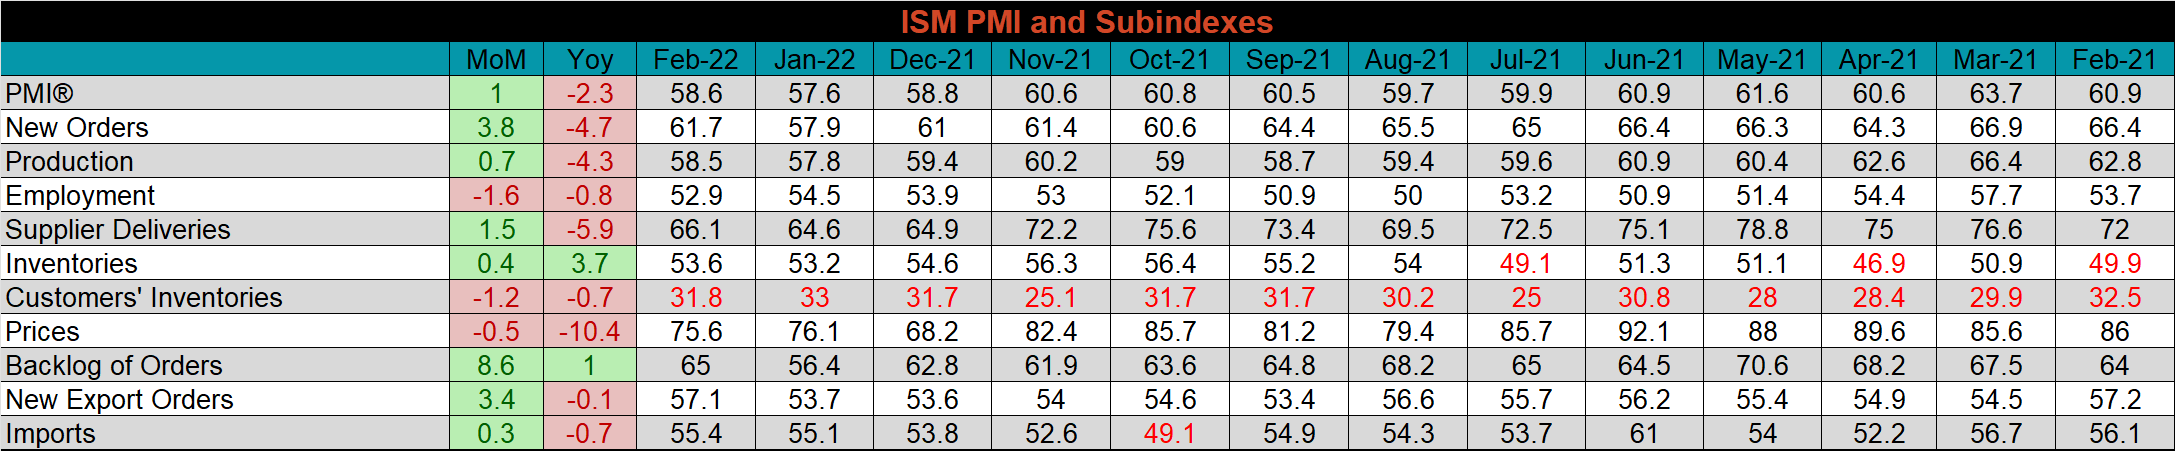
The February ISM Manufacturing PMI and subindexes are below.
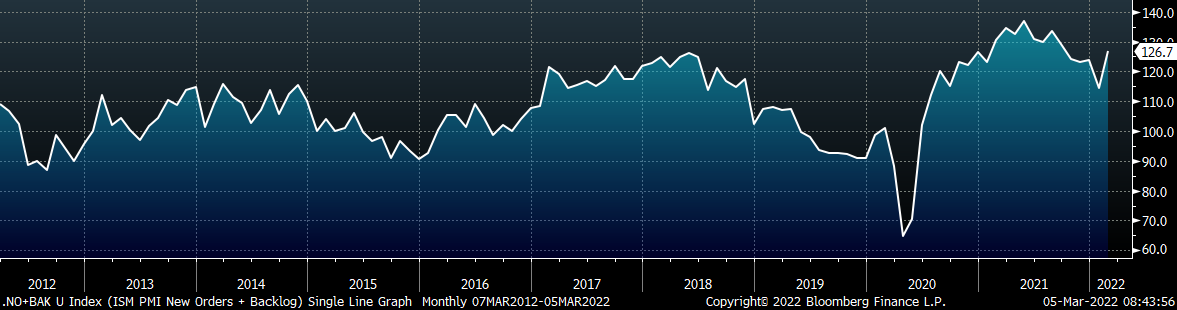
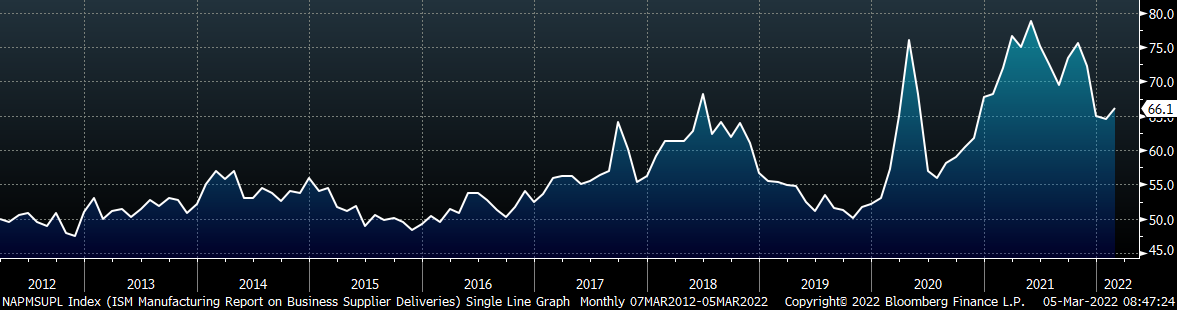
The chart below shows the new orders plus backlog subindexes, which were in a downtrend since the middle of last year. This month, however, they were the two strongest MoM increases followed closely by new export orders. This is a clear signal of strong demand for manufactured goods. The second chart shows supplier deliveries, which was slightly higher and shows continued constraints for supply chains and logistics.
ISM Manufacturing PMI New Orders + Backlog
ISM Manufacturing PMI Supplier Deliveries
The table below shows the historical values of each subindex over the last year.
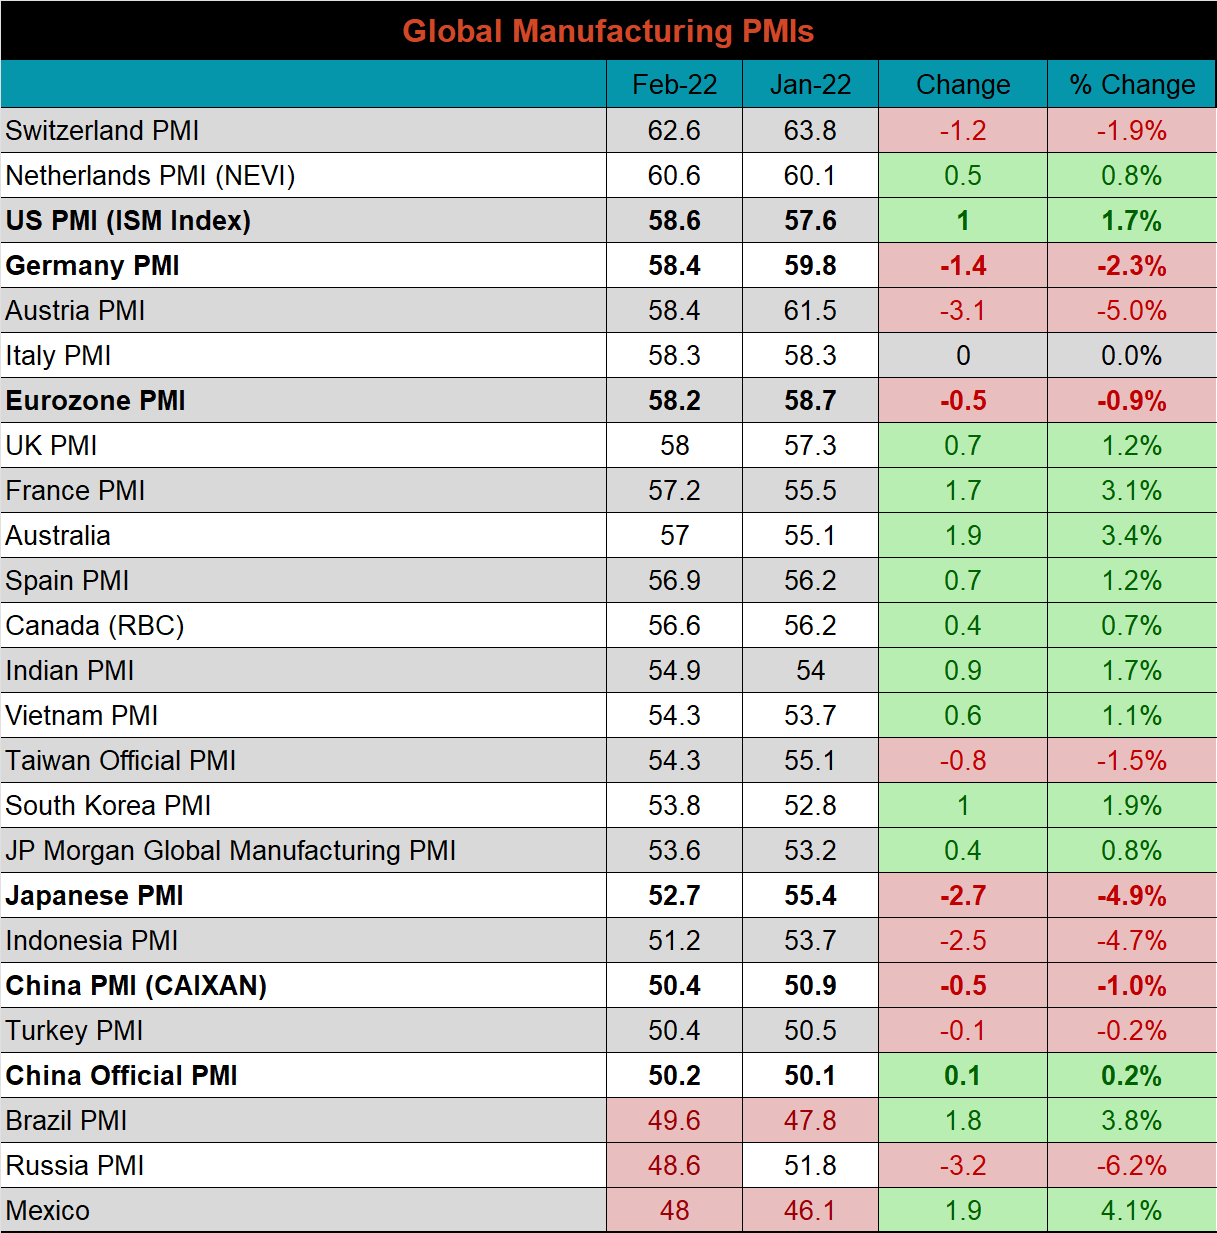
Global PMI
February global PMI printings depict another month of an expanding global manufacturing sector, with 19 of the 22 watched countries seeing their respective manufacturing industries grow.
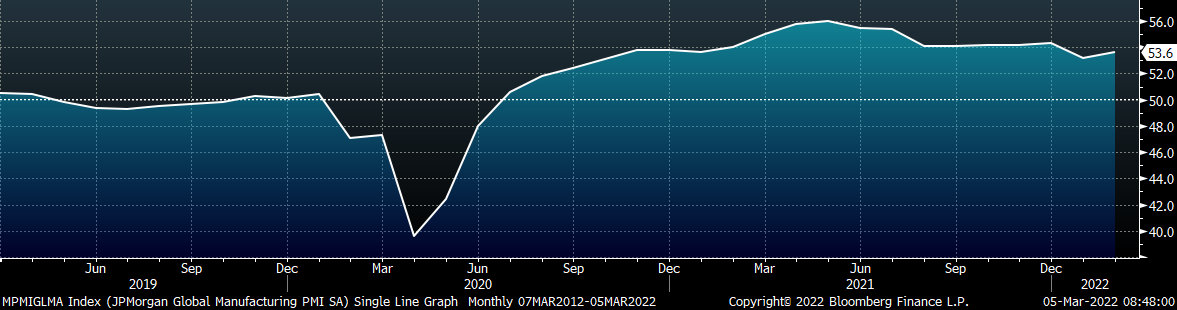
J.P. Morgan Global Manufacturing
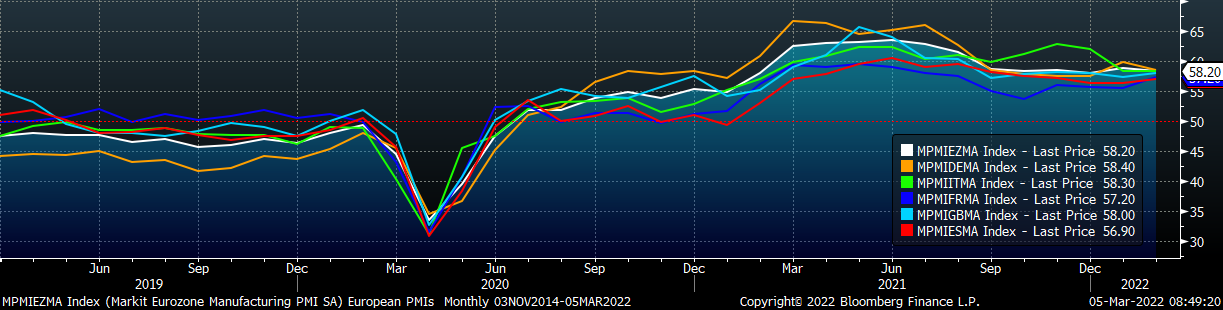
Eurozone (white), German (orange), Italian (green), Spanish (red), and French (blue), U.K. (teal) Manufacturing PMIs
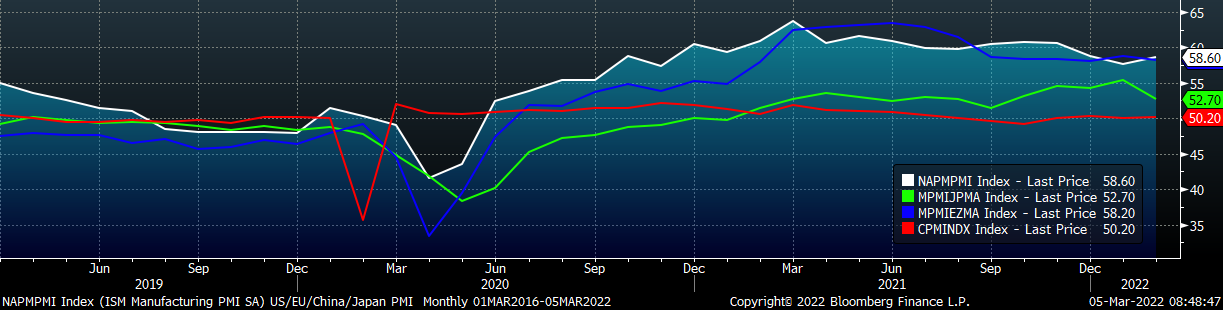
US (white), Euro (blue), Chinese (red) and Japanese (green) Manufacturing PMIs
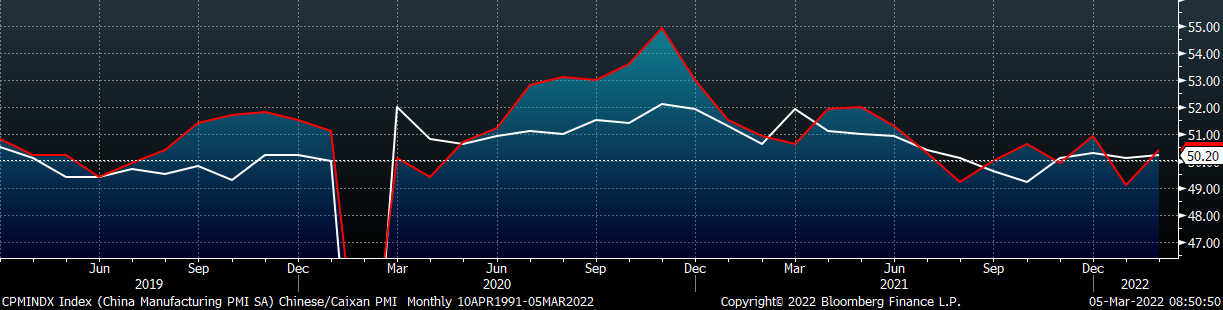
The Caixan PMI index printed lower, while the Chinese official PMI printed higher, but both continue to expand.
China Official (white) and Caixan (red) Manufacturing PMIs
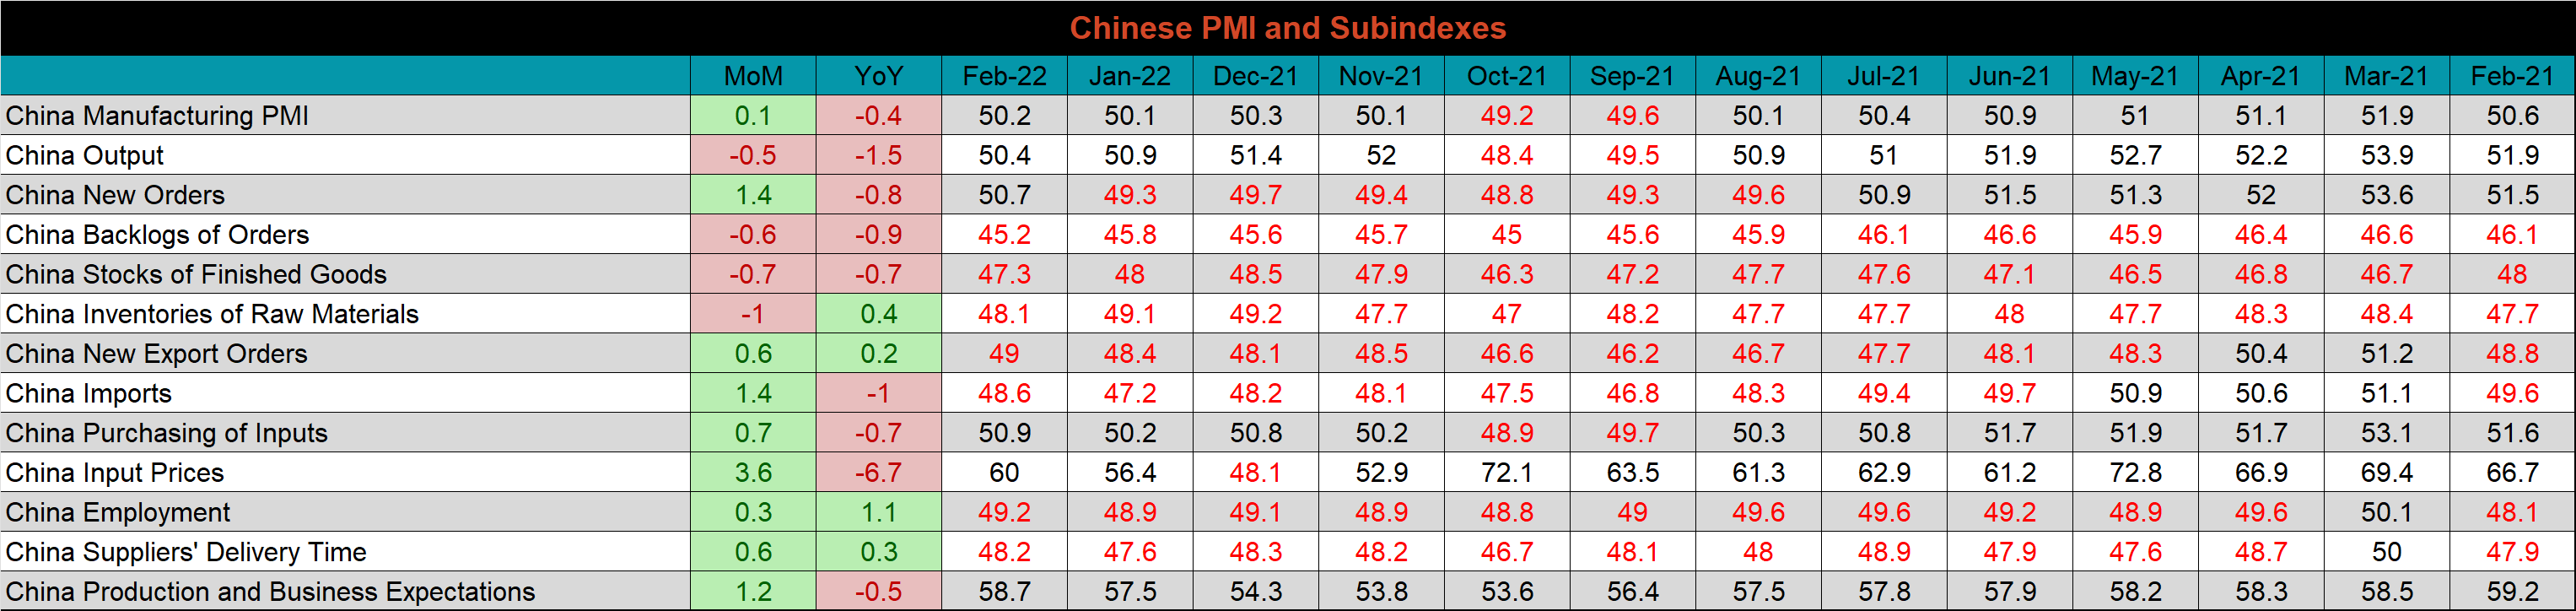
The table below breaks down China’s official manufacturing PMI subindexes. Input prices, jumped higher again, putting pressure on many “demand proxy” subindexes.
Construction Spending
January seasonally adjusted U.S. construction spending was up 1.3% compared to December, and 8.2% higher than January 2021.
January U.S. Construction Spending
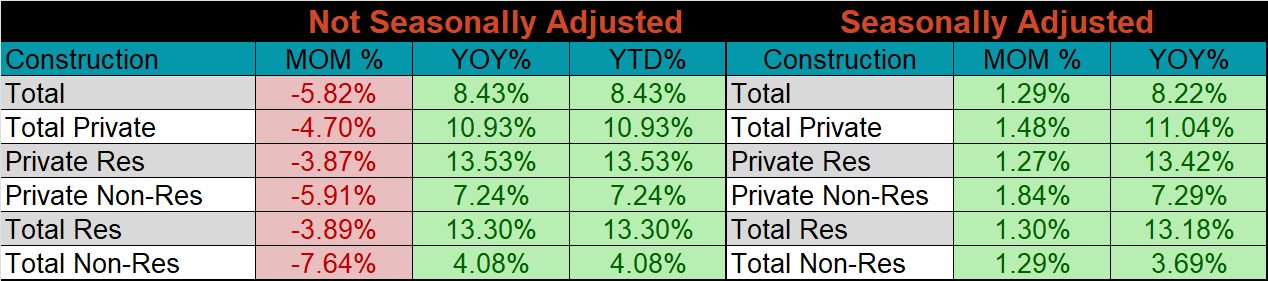
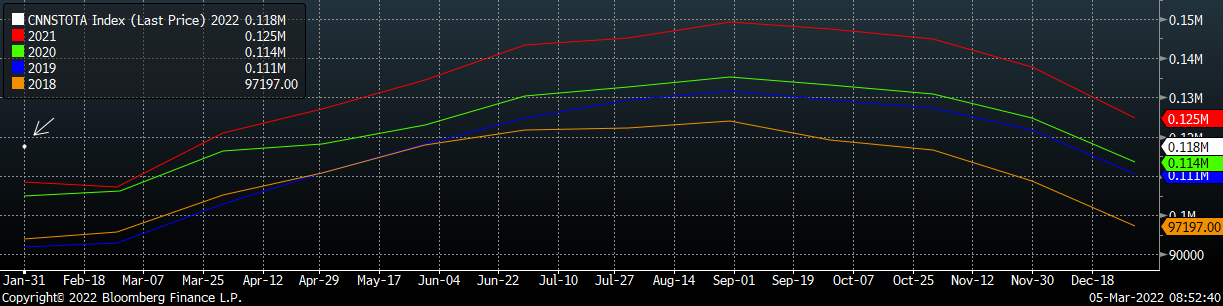
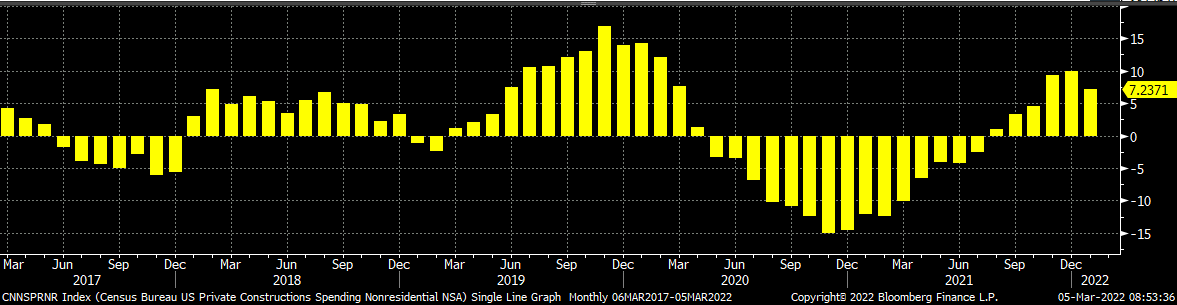
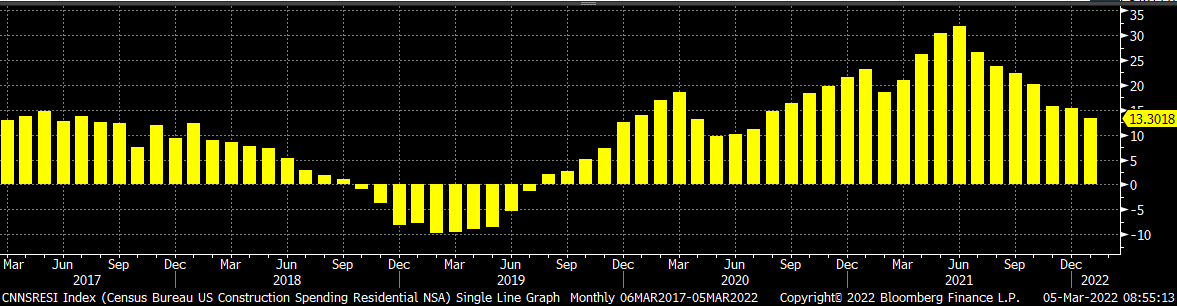
The white line in the chart below represents not seasonally adjusted construction spending in 2021 and compares it to the spending of the previous 4 years. The two bottom charts below show the YoY changes in construction spending. Both residential and non-residential spending continue to grow YoY as we approach warmer weather and construction season.
U.S. Construction Spending NSA
U.S. Private Nonresidential Construction Spending NSA YoY % Change
U.S. Residential Construction Spending NSA YoY % Change
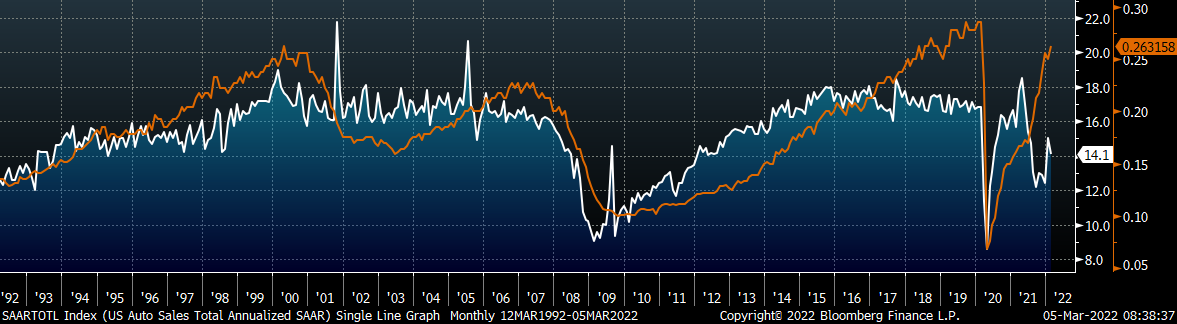
Auto Sales
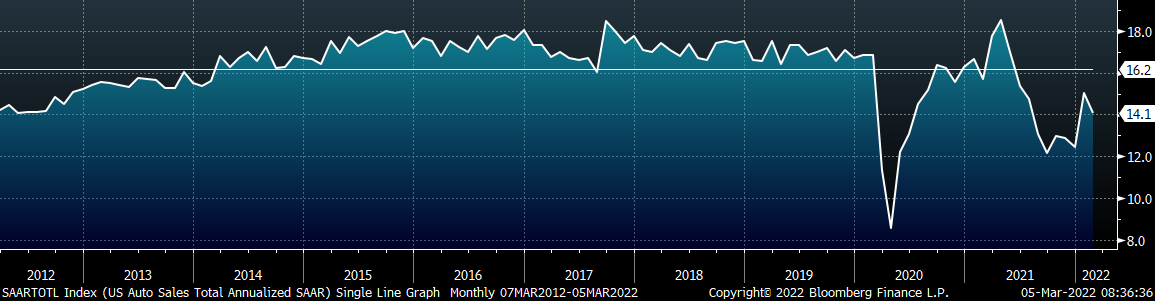
February U.S. light vehicle sales dipped slightly to a 14.1m seasonally adjusted annualized rate (S.A.A.R) and remains below the 10-year average of 16.2m. The second chart shows the relationship between the unemployment rate and auto sales. The unemployment rate is inverted to show that declining unemployment typically leads to increasing auto sales. The labor market was better than anticipated in February, while the auto sector continues to face supply chain headwinds. Pent-up demand for new cars persists, and we anticipate sustained demand for steel once supply constraints are resolved.
February U.S. Auto Sales (S.A.A.R.)
February U.S. Auto Sales (orange) and the Inverted Unemployment Rate (white)
Risks
Below are the most pertinent upside and downside price risks:
Upside Risks:
- Inventory at end users and service centers below normal operational levels
- Higher share of discretionary income allocated to goods from steel intensive industries
- Changes in China’s policies regarding ferrous markets, including production cuts and exports
- Unplanned & extended planned outages, including operational issues leaving mills behind
- Energy & construction industry rebound
- Easing labor and supply chain constraints allowing increased manufacturing activity
- Mills extending outages/taking down capacity to keep prices elevated
- Global supply chains and logistics restraints causing regional shortages
Downside Risks:
- Increased domestic production capacity
- Elevated price differentials and hedging opportunities leading to sustained higher imports
- Steel consumers substitute to lower cost alternatives
- Steel buyers and consumers “double ordering” to more than cover steel needs
- Tightening credit markets, as elevated prices push total costs to credit caps
- Supply chain disruptions allowing producers to catch up on orders
- Limited desire to restock at elevated prices, causing a “Buyer’s Strike”
- Economic slowdown caused by the emergence of Coronavirus Variants
HRC Futures
All of the below data points are as of March 4, 2022.
The Platts TSI Daily Midwest HRC Index was unchanged and remains at $1,000.
Platts TSI Daily Midwest HRC Index
The CME Midwest HRC futures curve is below with last Friday’s settlements in white. The entire curve shifted dramatically higher, as the market reacts to the new reality of a global supply shock. Expirations from June onward are more expensive than peak pandemic pricing in late August of last year.
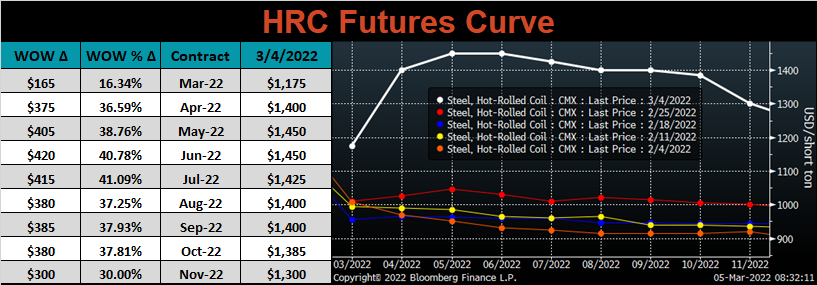
April ferrous futures exploded higher, led by Aussie coking coal and Midwest HRC, each up 37.2% and 36.6%, respectively.
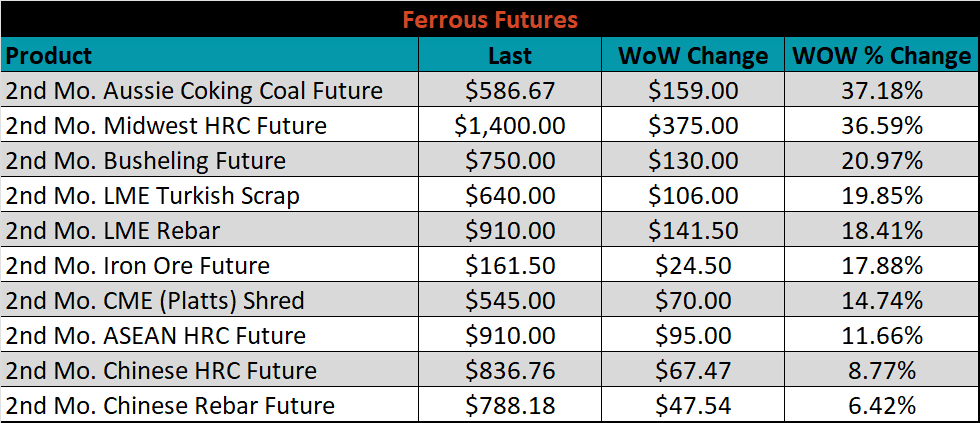
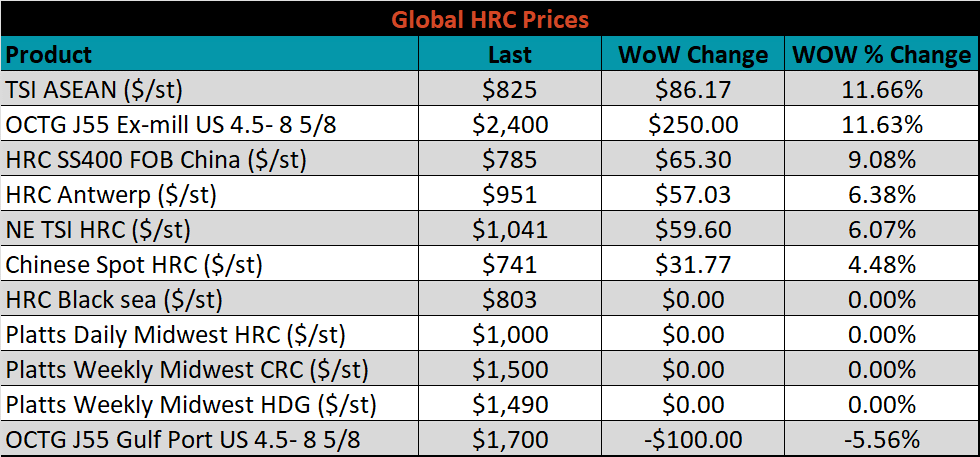
Global flat rolled indexes were all higher, led by TSI ASEAN HRC, up 11.7%.
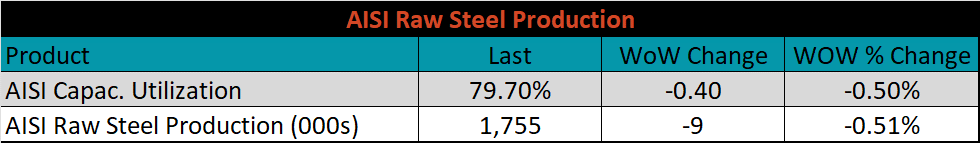
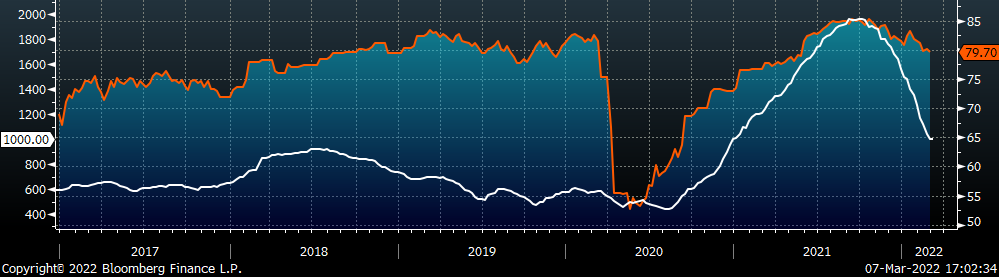
The AISI Capacity Utilization was down 0.4% to 79.7%.
AISI Steel Capacity Utilization Rate (orange) and Platts TSI Daily Midwest HRC Index (white)
Imports & Differentials
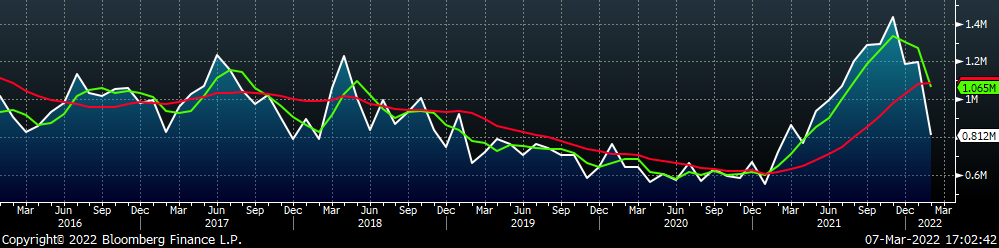
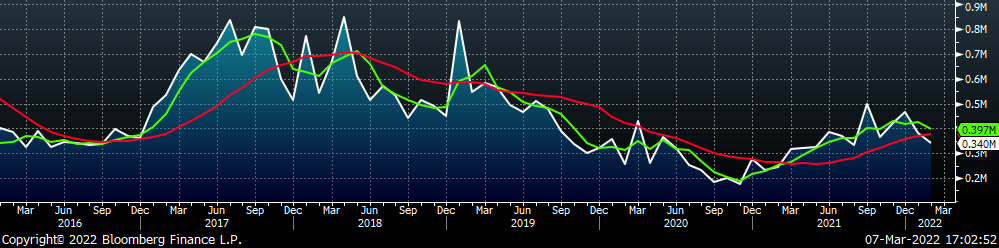
February flat rolled import license data is forecasting a decrease of 383k to 812k MoM.
All Sheet Imports (white) w/ 3-Mo. (green) & 12-Mo. Moving Average (red)
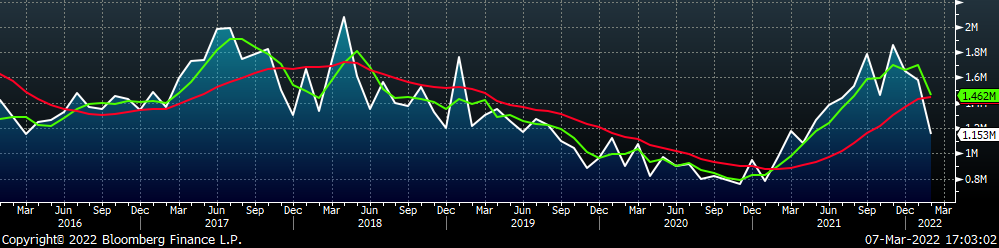
Tube imports license data is forecasting a decrease of 43k to 340k in February.
All Tube Imports (white) w/ 3-Mo. (green) & 12-Mo. Moving Average (red)
All Sheet plus Tube (white) w/ 3-Mo. (green) & 12-Mo. Moving Average (red)
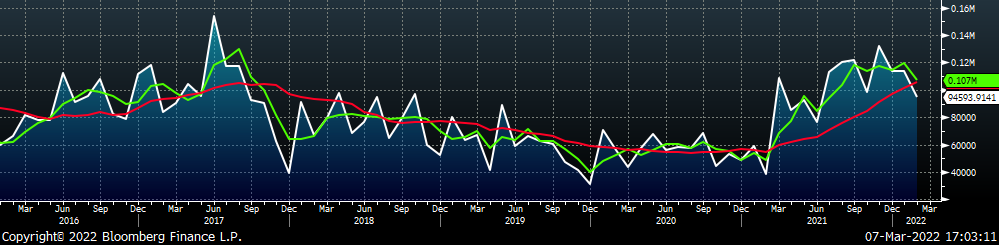
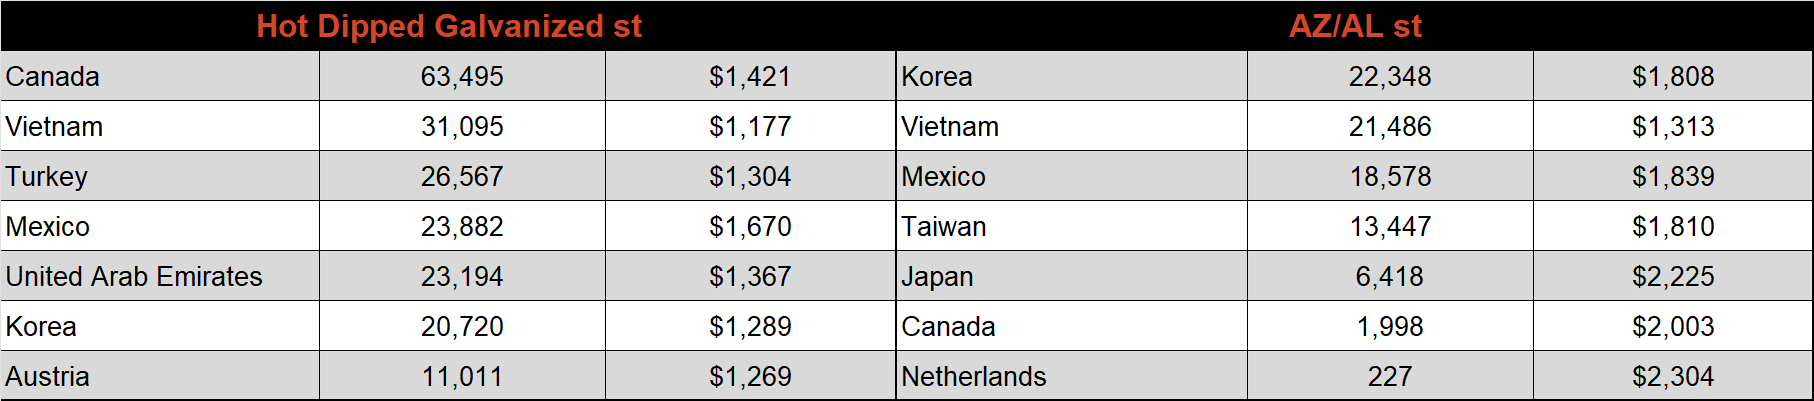
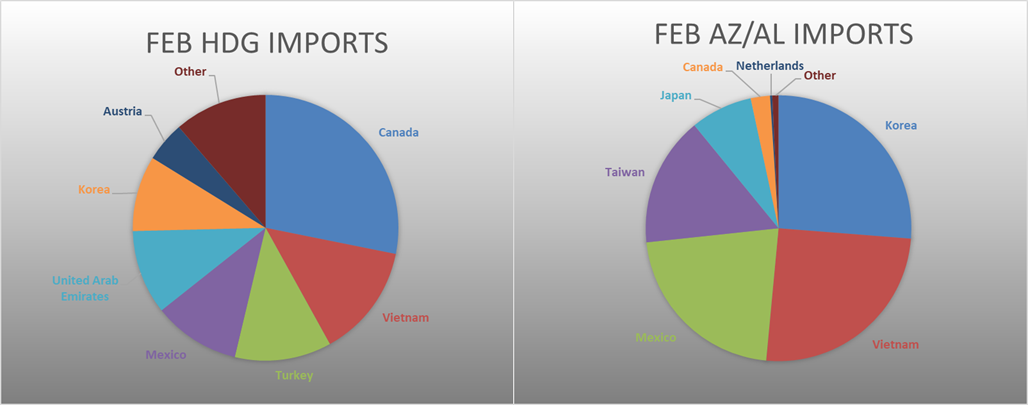
February AZ/AL import license data is forecasting a decrease of 19k to 95k.
Galvalume Imports (white) w/ 3 Mo. (green) & 12 Mo. Moving Average (red)
Below is February import license data through February 28th, 2022.
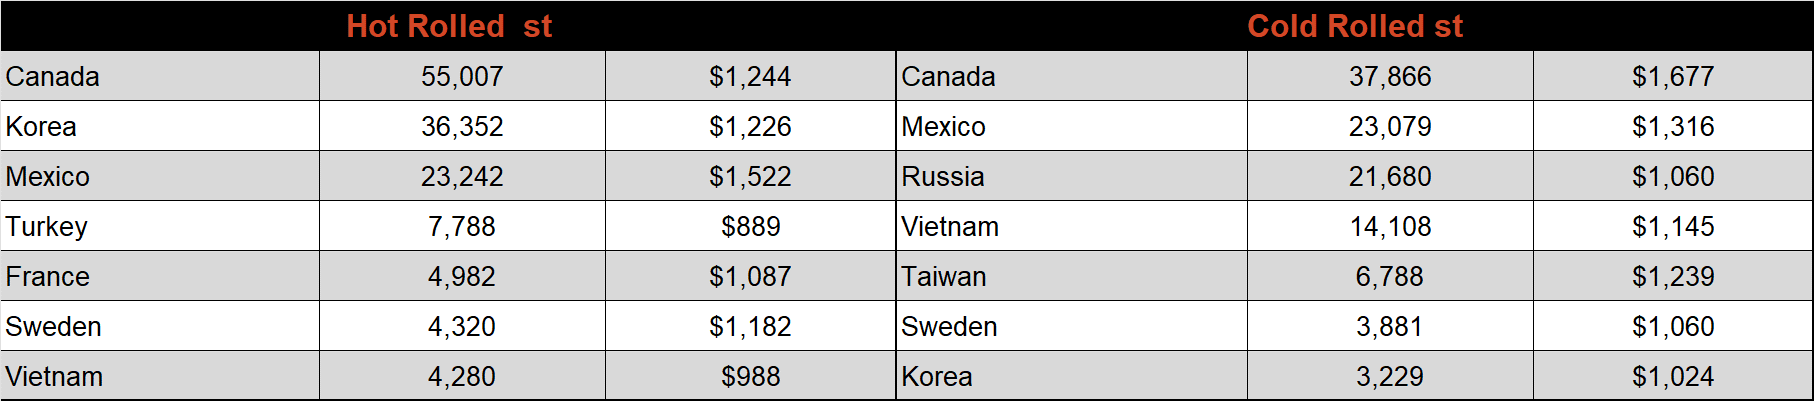
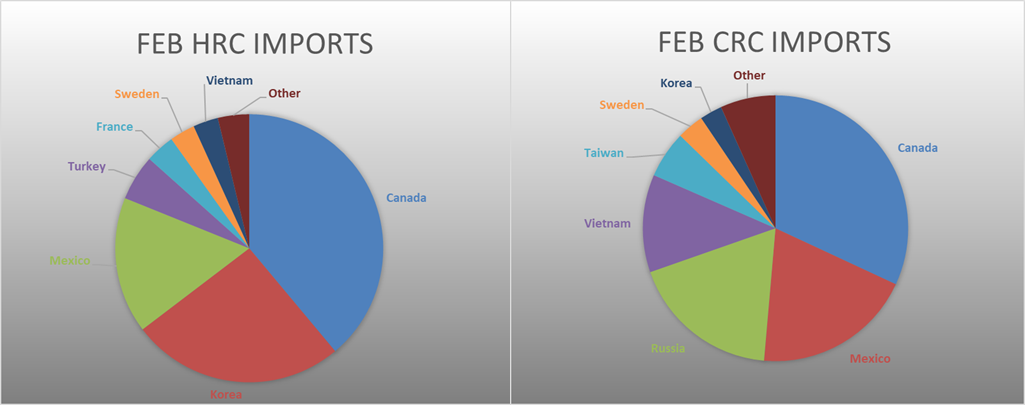
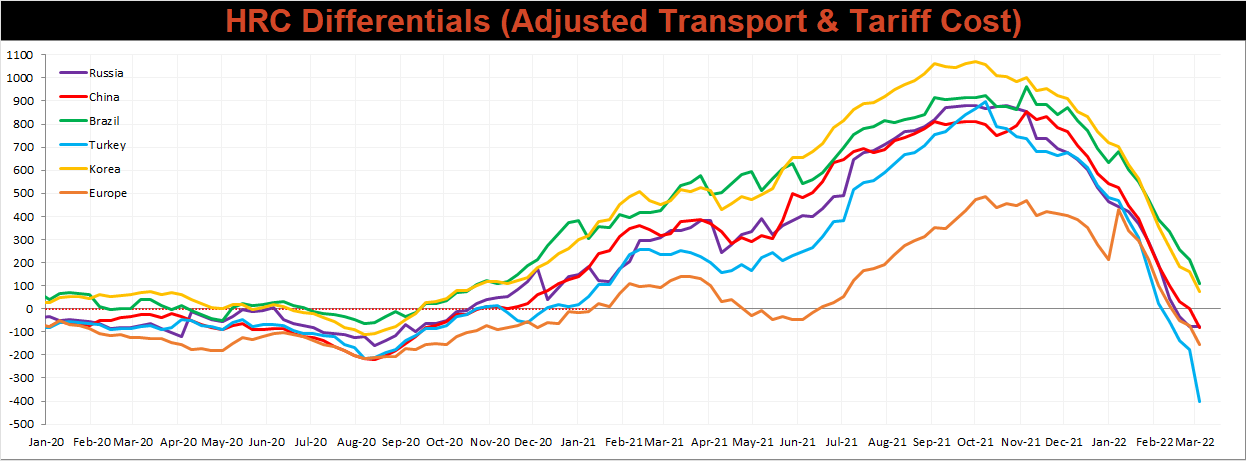
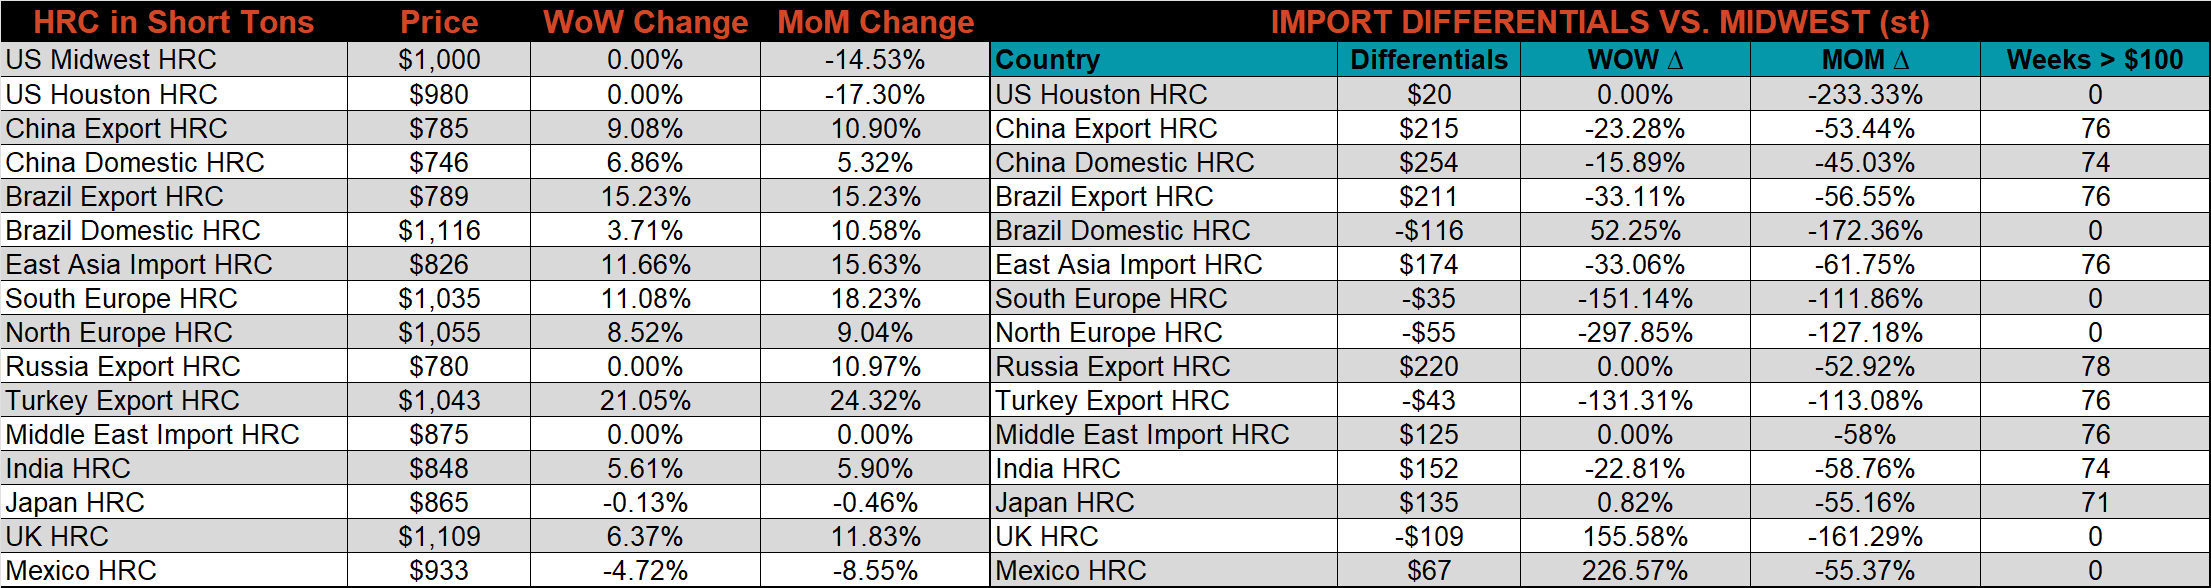
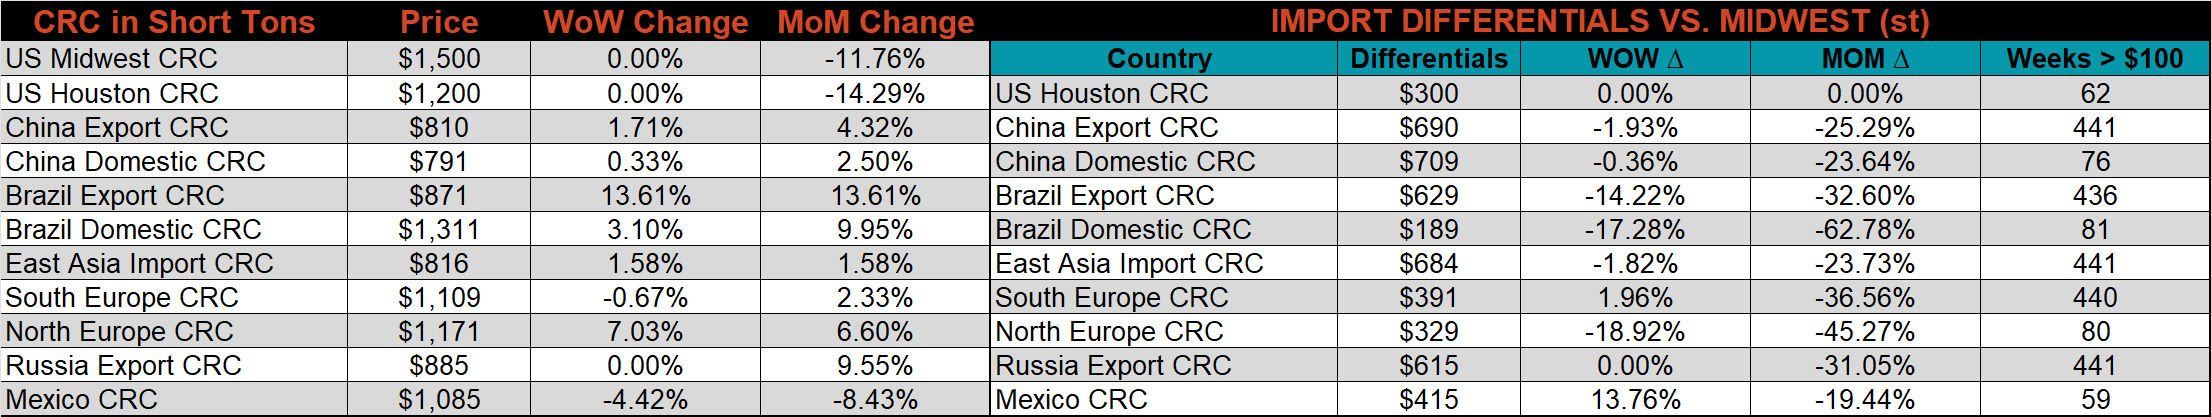
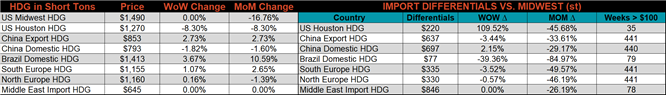
Below is the Midwest HRC price vs. each listed country’s export price using pricing from SBB Platts. We have adjusted each export price to include any tariff or transportation cost to get a comparable delivered price. All the watched countries differentials decreased again this week, as global prices increased dramatically and the U.S. Midwest price was unchanged at $1,000.
SBB Platt’s HRC, CRC and HDG pricing is below. The Midwest HRC, CRC, and HDG prices were all unchanged last week, as mills pulled quotes across the board. Outside of the U.S., global prices were significantly higher, led by the Turkish HRC price was up, 21.1%.
Raw Materials
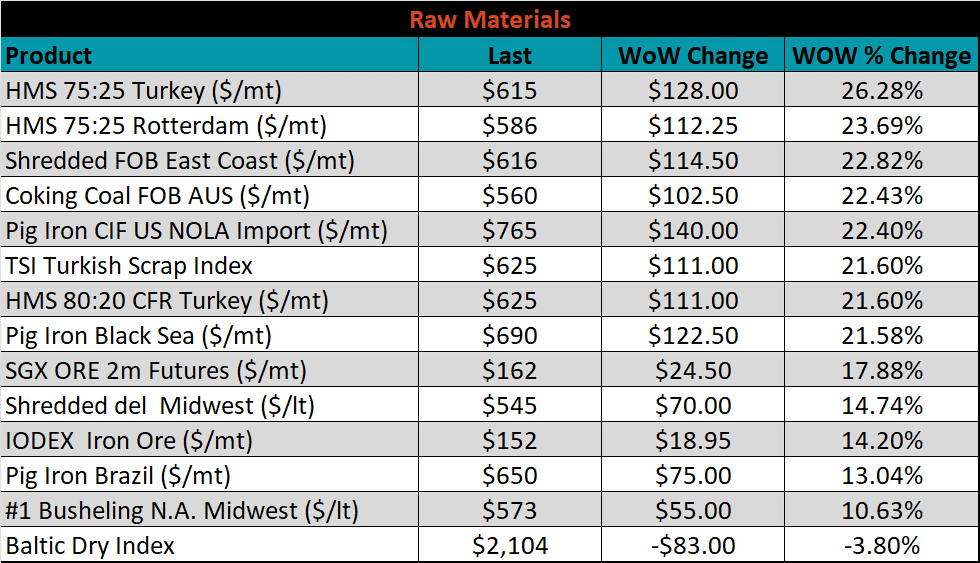
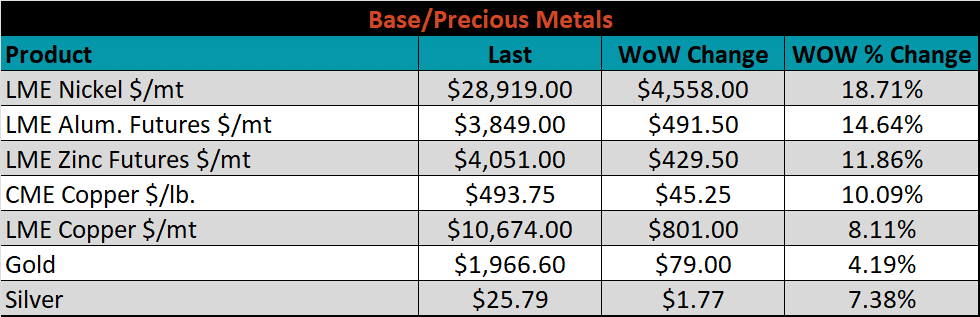
Raw material prices jumped higher this week, led by Turkish 75:25 HMS, up 26.3%. The section of the steel making process has the most significant upside risk, as the CIS makes up the largest share of global production.
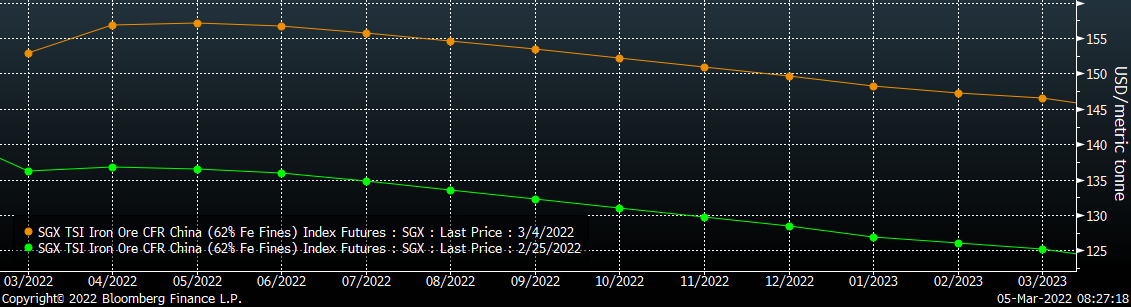
Below is the iron ore future curve with Friday’s settlements in orange, and the prior week’s settlements in green. Last week, the entire curve shifted dramatically higher.
SGX Iron Ore Futures Curve
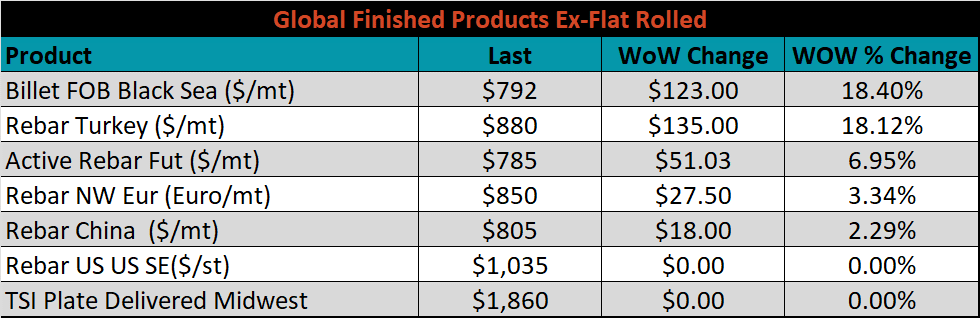
The ex-flat rolled prices are listed below.


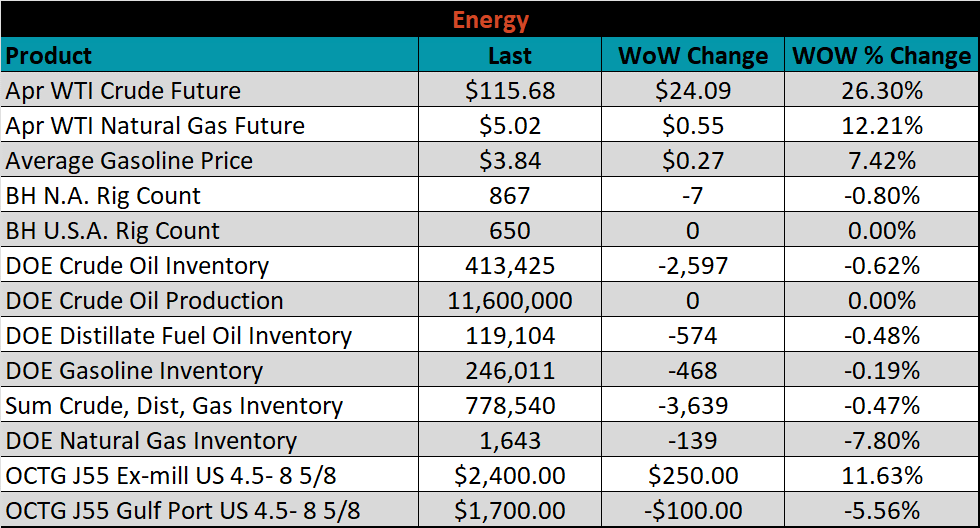
Energy
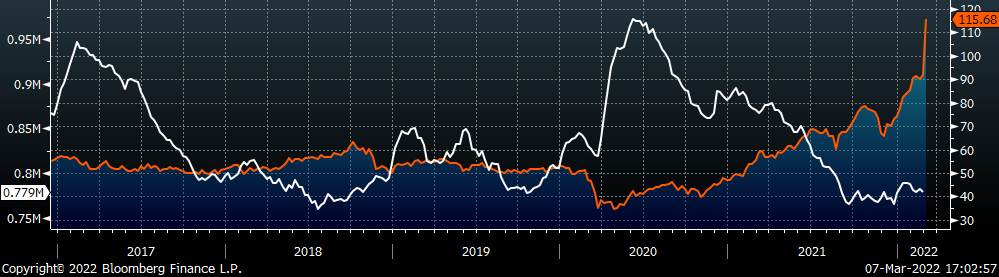
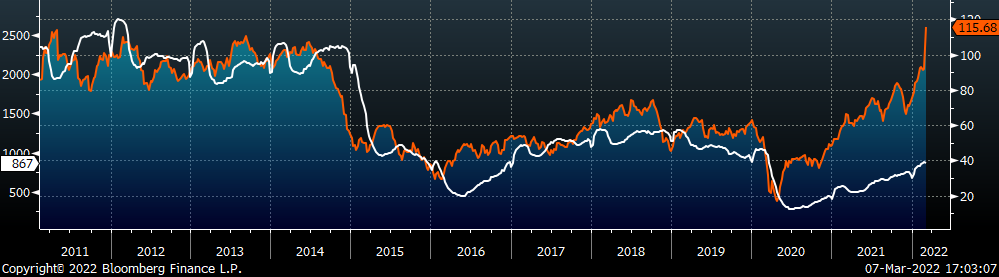
Last week, the April WTI crude oil future gained $24.09 or 26.3% to $115.68/bbl. The aggregate inventory level was down 0.5%, while crude oil production remains at 11.6m bbl/day. The Baker Hughes North American rig count was down 7 rigs, and the U.S. rig count was unchanged.
April WTI Crude Oil Futures (orange) vs. Aggregate Energy Inventory (white)
Front Month WTI Crude Oil Future (orange) and Baker Hughes N.A. Rig Count (white)


The list below details some upside and downside risks relevant to the steel industry. The bolded ones are occurring or highly likely.
Upside Risks:
- Inventory at end users and service centers below normal operational levels
- Higher share of discretionary income allocated to goods from steel intensive industries
- Changes in China’s policies regarding ferrous markets, including production cuts and exports
- Unplanned & extended planned outages, including operational issues leaving mills behind
- Energy & construction industry rebound
- Easing labor and supply chain constraints allowing increased manufacturing activity
- Mills extending outages/taking down capacity to keep prices elevated
- Global supply chains and logistics restraints causing regional shortages
- A weakening US Dollar
- Fiscal policy measures including a new stimulus and/or infrastructure package
- Fluctuating auto production, pushing steel demand out into the future
- Low interest rates
- Threat of further protectionist trade policies muting imports
- Unexpected and sustained inflation
Downside Risks:
- Increased domestic production capacity
- Elevated price differentials and hedging opportunities leading to sustained higher imports
- Steel consumers substitute to lower cost alternatives
- Steel buyers and consumers “double ordering” to more than cover steel needs
- Tightening credit markets, as elevated prices push total costs to credit caps
- Supply chain disruptions allowing producers to catch up on orders
- Limited desire to restock at elevated prices, causing a “Buyer’s Strike”
- Economic slowdown caused by the emergence of Coronavirus Variants
- Reduction and/or removal of domestic trade barriers
- Political & geopolitical uncertainty
- Chinese restrictions in property market
- Unexpected sharp China RMB devaluation