Content
-
Weekly Highlights
- Market Commentary
- Upside & Downside Risks


As the physical market continues to heat up, we at FGM have noticed a stark contrast in customer reactions to the current price rally over the last month. There still appears to be a significant portion of buyers on the sidelines, eerily similar periods in last year’s rally where participants tried to hold off purchases until the very last minute. We are highlighting the similarities because our view is that the existing upside risk is being severely discounted by most analysts and market observers. Through our analysis, the physical spot market and future market both remain hundreds of dollars below levels that would lead to any type of significant demand destruction based on the current environment. This leads us to believe there will be very little resistance in rising prices until HRC starts approaching last year’s peak. While pace and timing remain unclear, evidence of this type of monumental upside risk has already started. We have already seen record level increases in the spot market, and this rally is only 2 weeks removed from the bottom.
During the 2020-2021 rally, mills were reluctant to raise prices, due their own operational issues and the unprecedented nature of the rally. No one in the marketplace knew whether steel consumers would be able to turn inventory above $1,400 or if buyers would ever be willing to pay $2,000 for steel, until it happened. It has not even been 6 months since prices peaked and anyone who thinks mills don’t remember how much you were willing to pay last year is only fooling themselves. The difference between then and now, however, is that pricing decisions are going to be largely driven by a shortage in raw materials, thus directly impacting margin at the mills. The chart below shows pig iron (blue), busheling (white), and shredded scrap (green) over the last 5 years.

Estimates suggest that most mills have approximately two months of raw material inventory on hand at any time. That means that the ripple effect of them reckoning with input costs that are already 20-50% higher than last year’s peak has not started. Taking a step back, the real problem today is that there is not a straight-forward solution to the problem we currently face. Even an overnight resolution to the war does not fully bring back global production that has been sucked out of the market, and it likely does not normalize trade and sanctions between the West and Russia. This suggests that the factors driving this upcycle are even more uncertain than the previous cycle which led to record high prices. Moreover, $2,000/t HRC prices are no longer uncharted territory, and the most likely result of all this cost pressure is that those previous highs will eventually be tested.

Below are the most pertinent upside and downside price risks:
Upside Risks:
Downside Risks:

The Platts TSI Daily Midwest HRC Index rebounded significantly and was up another $100 to $1,300.

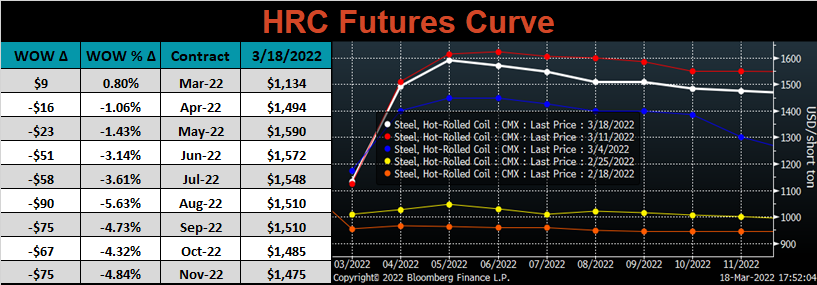
The CME Midwest HRC futures curve is below with last Friday’s settlements in white. The entire curve shifted lower, after 3 straight weeks of significant increases. Prices from May onward remain more than $500 higher than a month ago.
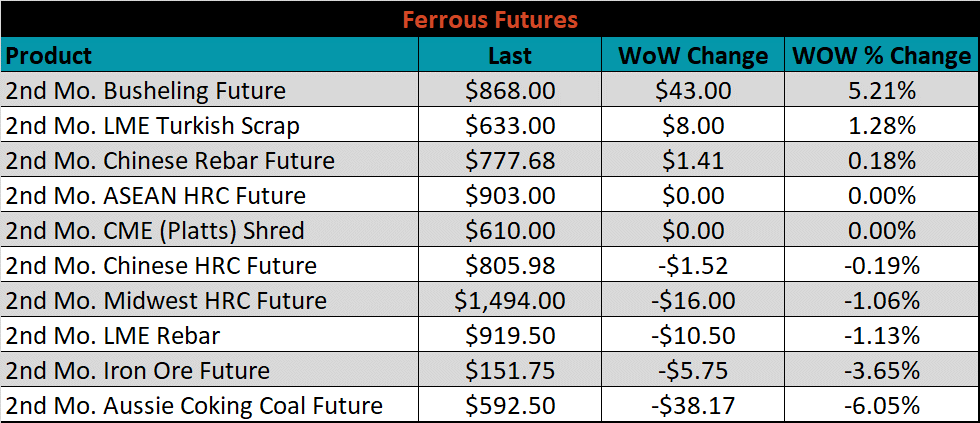
April ferrous futures were mixed, with Aussie coking coal lost 6.1%, while busheling gained another 5.2%.
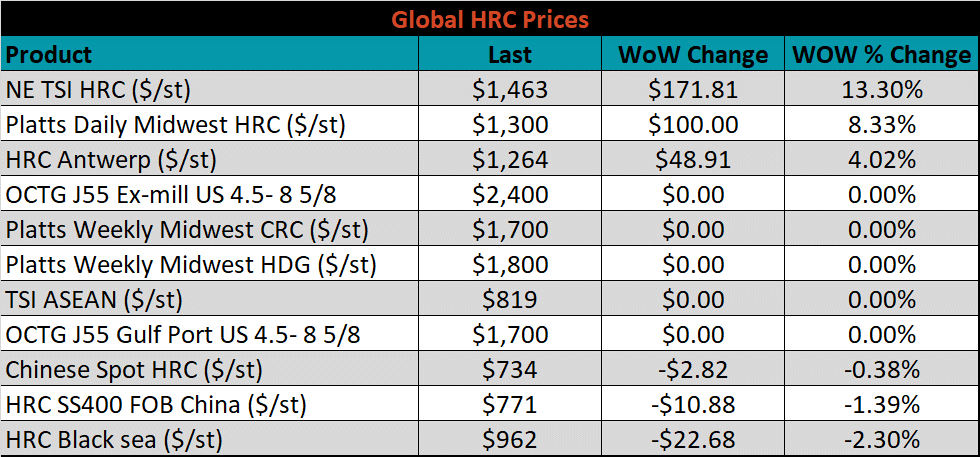
Global flat rolled indexes were mixed. Northern European HRC was up another 13.3%, while Black Sea HRC was down 2.3%.
The AISI Capacity Utilization was down 0.1% to 79.9%.


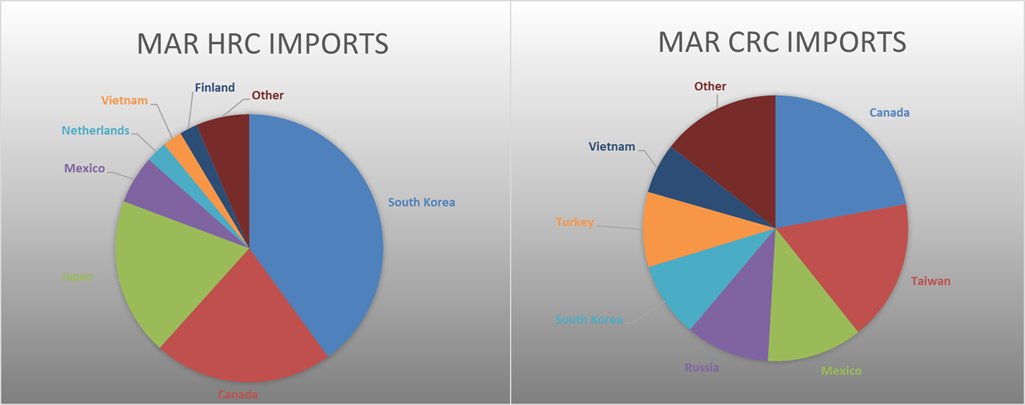
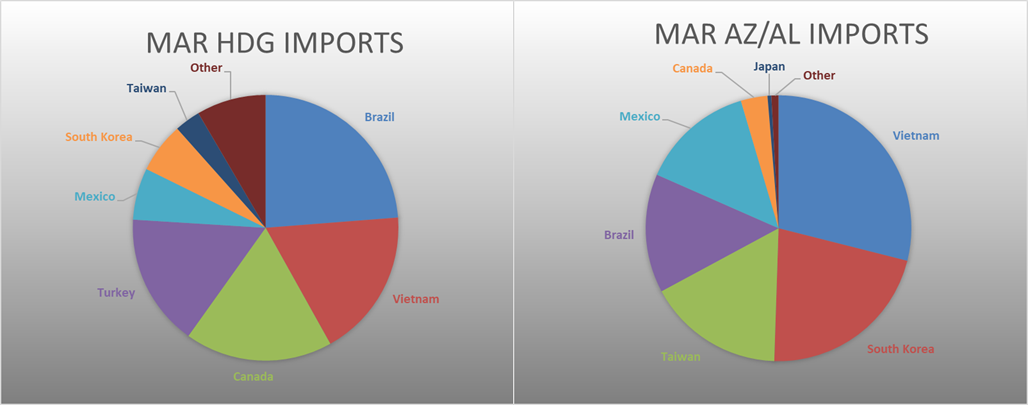
March flat rolled import license data is forecasting an increase of 366k to 1.14M MoM.

Tube imports license data is forecasting an increase of 154k to 515k in March.


March AZ/AL import license data is forecasting an increase of 20k to 106k.

Below is March import license data through March 14th, 2022.


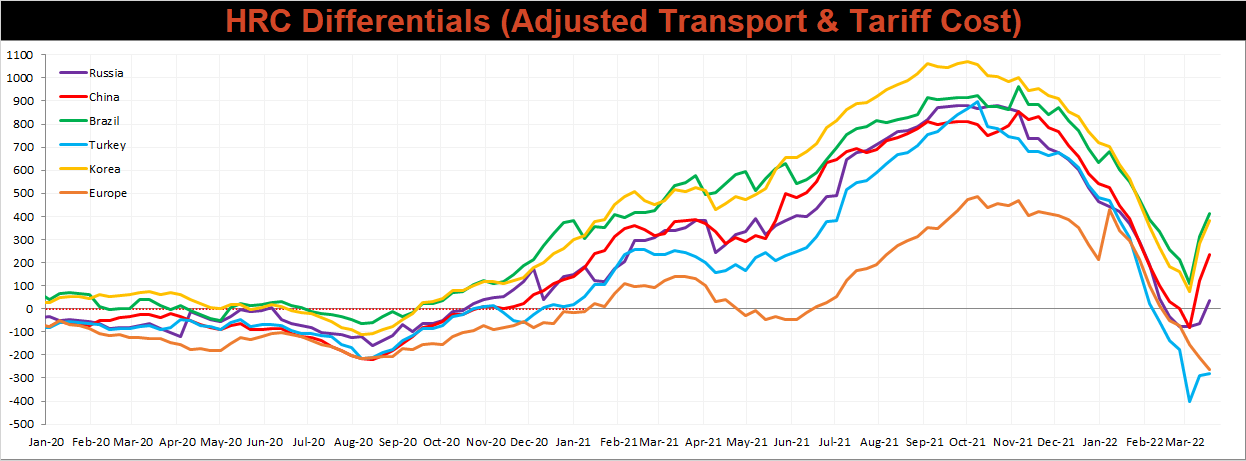
Below is the Midwest HRC price vs. each listed country’s export price using pricing from SBB Platts. We have adjusted each export price to include any tariff or transportation cost to get a comparable delivered price. For the second week in a row, every differential increased except for in the E.U., where their price continues to increase more significantly than U.S. prices.
SBB Platt’s HRC, CRC and HDG pricing is below. The Midwest HRC price was up another 8.3%, while CRC & HDG were unchanged. Outside of the U.S., global prices were mostly higher again, led this time by the North European HRC, up, 11.5%.


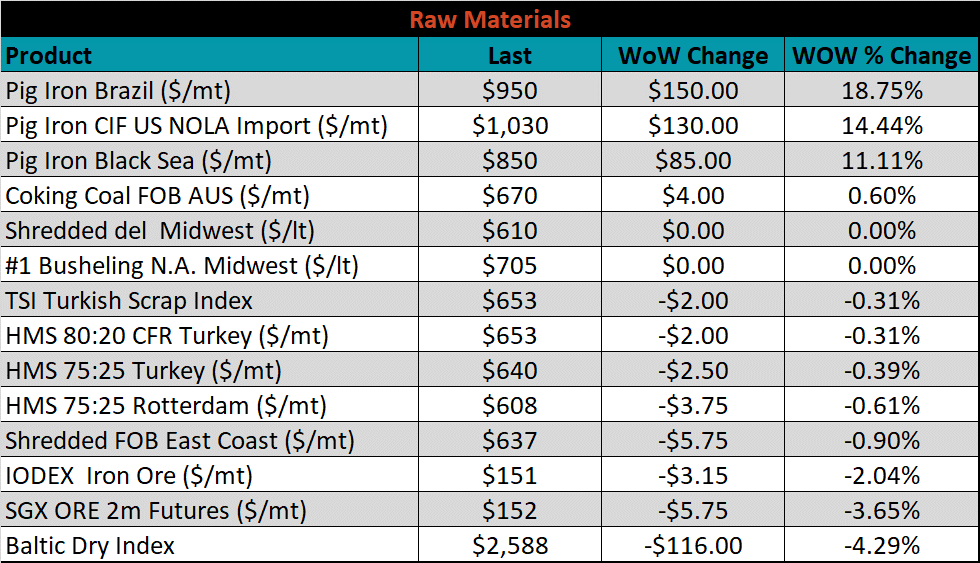
Raw material prices were mostly higher again this week, led by Brazilian pig iron, up another 18.8%, while April iron ore futures which lost 3.7%.
Below is the iron ore future curve with Friday’s settlements in orange, and the prior week’s settlements in green. Last week, the entire curve shifted lower, more significantly from June 2022, onward.

The ex-flat rolled prices are listed below.


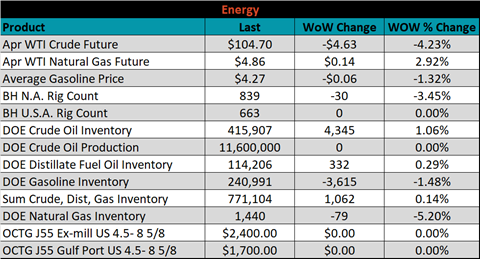
Last week, the April WTI crude oil future lost another $4.63 or 4.2% to $104.70/bbl. The aggregate inventory level was up 0.1% and crude oil production remains at 11.6m bbl/day. The Baker Hughes North American rig count was down 30 rigs, and the U.S. rig count was unchanged.


The list below details some upside and downside risks relevant to the steel industry. The bolded ones are occurring or highly likely.
Upside Risks:
Downside Risks: