Content
-
Weekly Highlights
- Market Commentary
- Upside & Downside Risks


The chart below shows December data for privately owned housing starts (white) and private building permits (blue) shown here in units (thousands). These figures are seasonally adjusted and have corresponding horizontal dotted lines at their current values going back to 2019.

By comparing starts and permits, you can get a snapshot of current activity as well as demand coming downstream. A quick glance at the chart shows the clear downtrend which started in early 2022. However, a more significant takeaway from the data is that current levels for both are significantly higher than in the decade leading up to the pandemic. This is an indication that although the recent surge in residential construction appears to be turning over, current levels remain relatively strong.
Looking forward, it is important to note that building permits have been below housing starts for two straight months, an event which happened only ~6% of the time going back to 2000. This is likely the result of rapid rate increases from the Federal Reserve over the last year, which will certainly be a headwind for the remainder of 2023. What does this mean for the steel industry? While residential construction is less steel intensive than non-residential, it is the most sensitive to interest rate movement. On top of that, a significant slowdown in residential construction has longer term implications for appliances and the auto-sector, as well as broader economic slowdown. In the same way that we monitored the auto industry for insight into resolution of the chip shortage, we will turn to construction activity as a leading indicator for how other industrial sectors will react to the current rate hike cycle.

Upside Risks:
Downside Risks:

The Platts TSI Daily Midwest HRC Index was up another $10 this week, ending at $740.


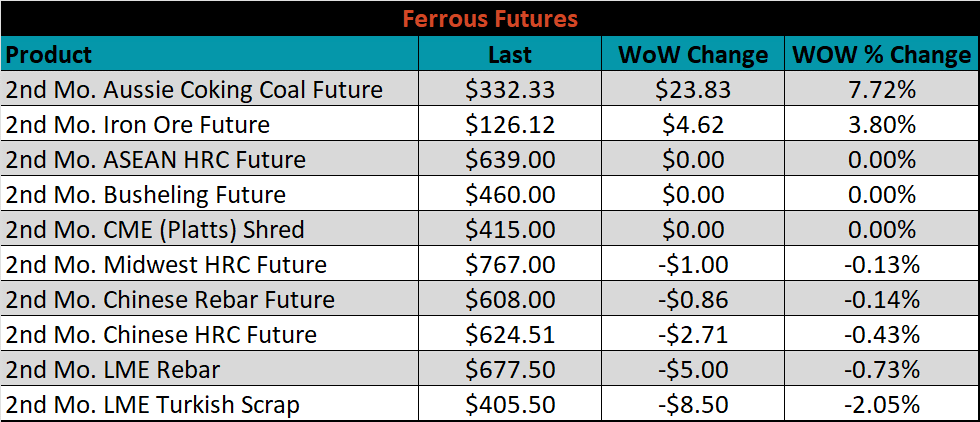
The 2nd month ferrous futures were mostly higher. Iron ore gained 4.4%, while LME Rebar lost 1.3%.
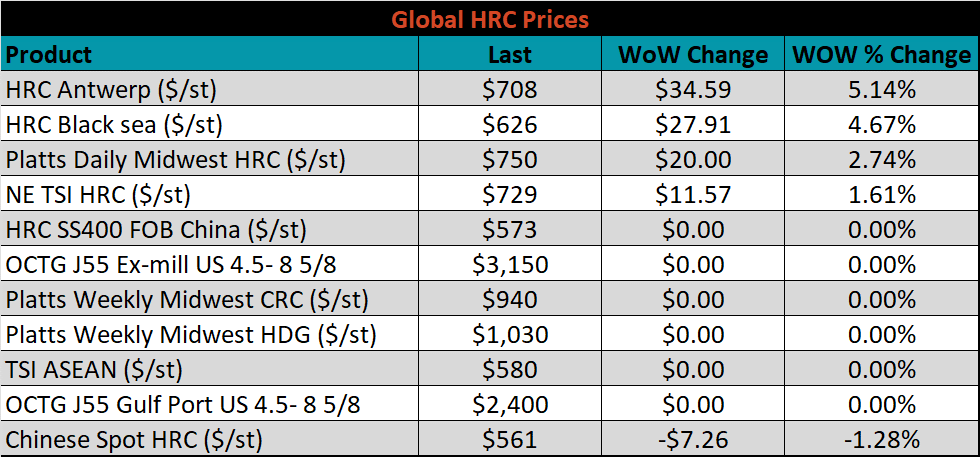
Global flat rolled indexes were mixed this week. Antwerp HRC was up 5.1%, while Chinese Spot HRC lost 1.3%.
The AISI Capacity Utilization was up 0.4% to 71.7%.


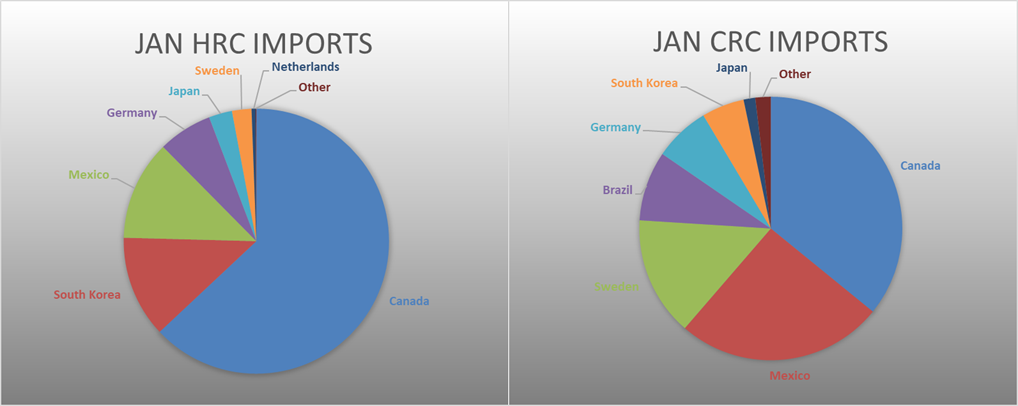
January flat rolled import license data is forecasting a decrease of 121k to 645k MoM.

Tube imports license data is forecasting a decrease of 42k to 585k in January.


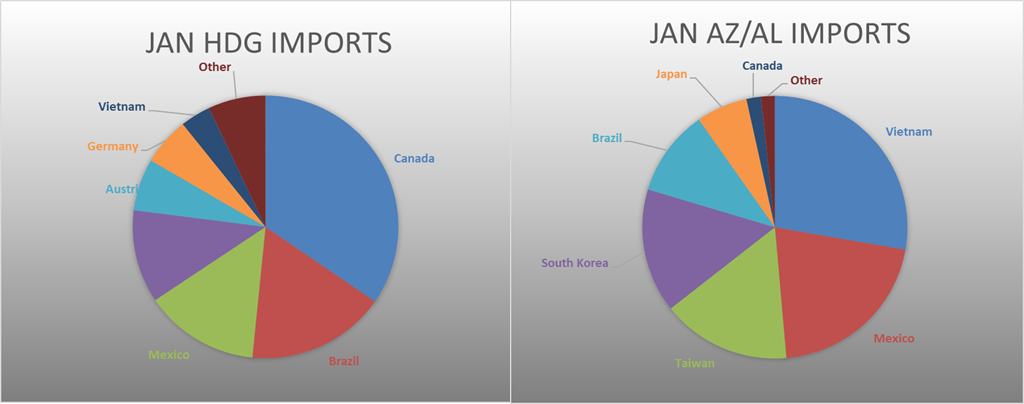
January AZ/AL import license data is forecasting an increase of 26k to 84k.

Below is January import license data through January 16th, 2023.


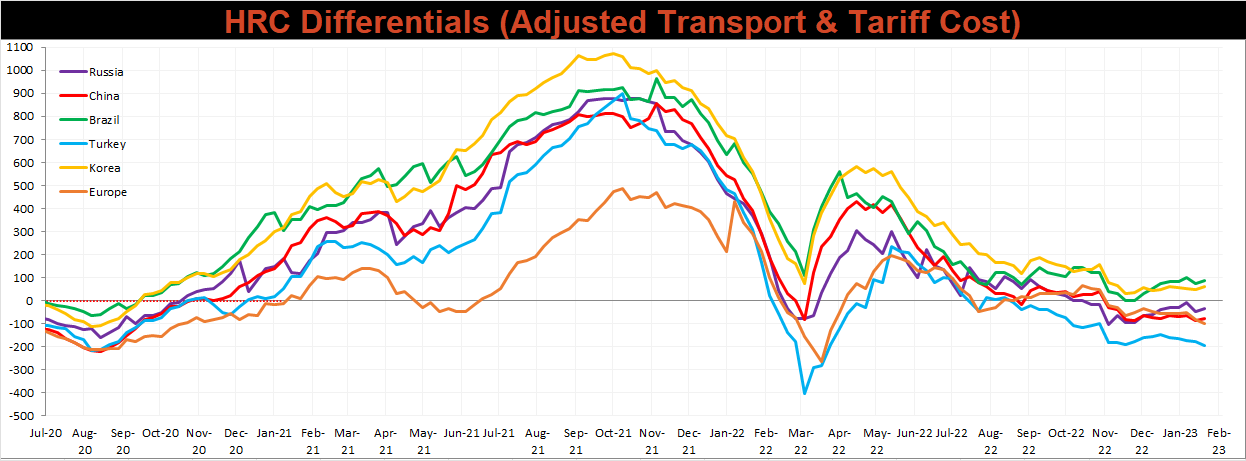
Below is the Midwest HRC price vs. each listed country’s export price using pricing from SBB Platts. We have adjusted each export price to include any tariff or transportation cost to get a comparable delivered price. Differentials decreased for Northern European and Turkish HRC, as their respective prices increased more than U.S. domestic prices, while the remaining watched differentials increased.
Global prices were mostly higher again this week, led by Mexican CRC, up 9.3%.


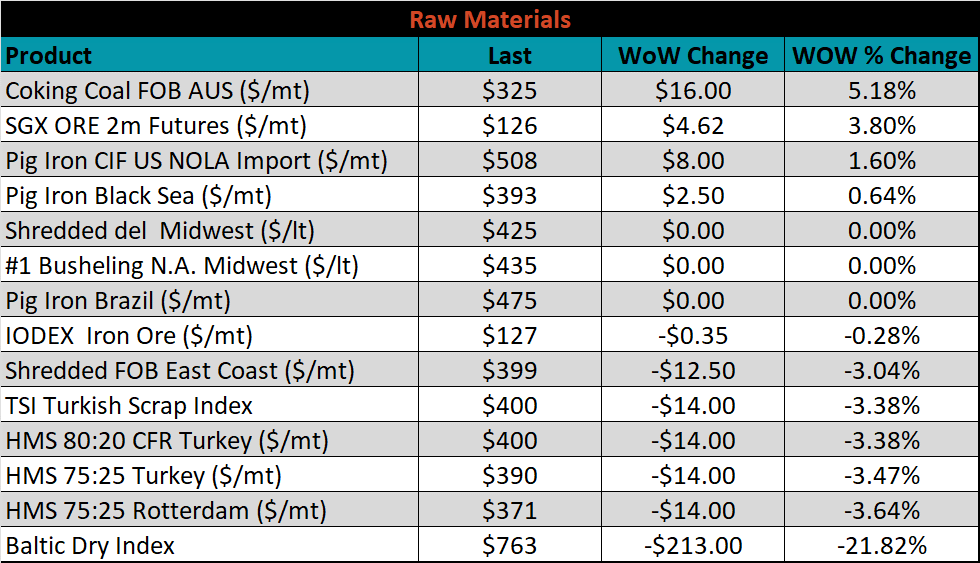
Raw material prices were mixed this week, with Aussie coking coal up 5.2%, while Rotterdam HMS was down another 3.6%. The Baltic Dry Index continues it’s sharp decline, falling another 21.8% this week. The Baltic Dry Index is at it’s lowest level since the pandemic recovery took place.

The ex-flat rolled prices are listed below.


Below are inventory levels for Chinese finished steel products and iron ore. Rebar and HRC Inventories continued their rapid seasonal restock while iron ore ports inventory slipped. There was not a data release for the 5-city inventory level this week, due to the Lunar New Year holiday.


Base and precious metal futures were mostly higher this week, LME Nickel was the biggest gainer, up 7.4% on the week. Compared to other base/industrial metals, nickel has lagged, down 6.2% on the year. Among precious metals, silver was the biggest mover this week, down 1.8%.


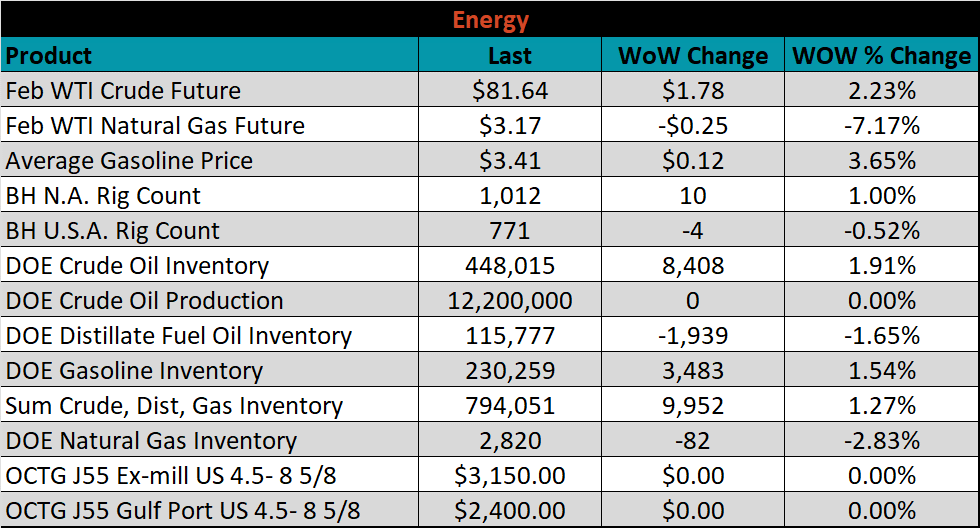
Last week, the February WTI crude oil future gained another $1.78 or 2.2% to $81.64/bbl. The aggregate inventory level was up 1.3%. The Baker Hughes North American rig count was up by another 10 rigs, while the U.S. rig count decreased by 4 rigs.


The list below details some upside and downside risks relevant to the steel industry. The bolded ones are occurring or highly likely.
Upside Risks: