Flack Capital Markets | Ferrous Financial Insider
April 14, 2023 – Issue #375
April 14, 2023 – Issue #375
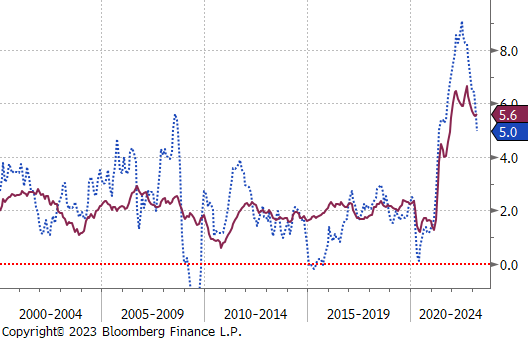
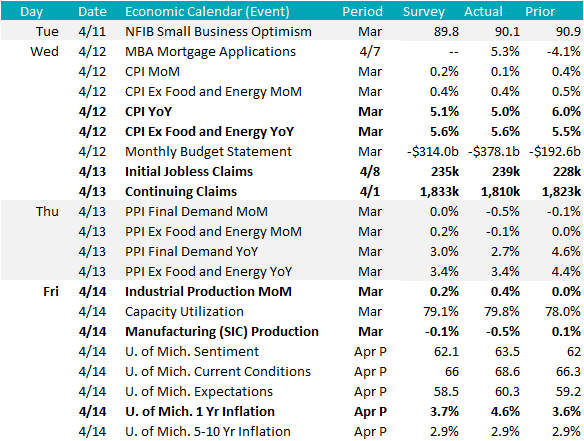
Multiple interesting pieces of inflation data were released last week. To begin, both topline and core CPI price readings in March showed monthly deceleration in upward pressure. YoY readings had topline CPI down to 5% versus 6% in February and Core prices up slightly, 5.6%, versus 5.5% in February. Both are well off their peaks from the second half of last year, however, there is a small detail that will likely garner much attention from the FOMC if the trend continues. The 3-month annualized Core CPI, which is the sum of the monthly change in prices for the 3 most recent months multiplied by 4. This calculation provides insight into the how prices are trending in the shorter term versus YoY readings which move slowly. Heading in 2023, price pressure had been steadily decelerating and bottomed out at 4% in December. Since then, that number has been moving higher and is now at 5.2%.
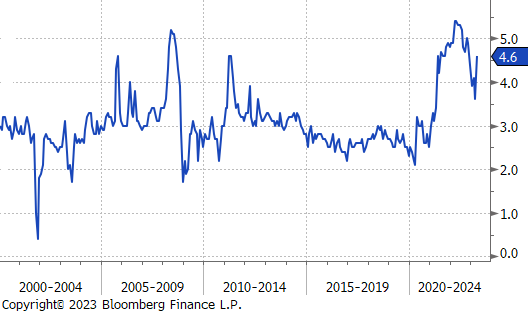
This reacceleration, while concerning, remains well off its recent peaks of 8.8% in June of 2021, or 8% in December of 2021. The point of highlighting this dynamic is to show that the fight against inflation is not over. In a similar vein, the University of Michigan released their preliminary April Consumer Sentiment Survey. The topline number printed slightly above expectations, mostly driven by better-than-expected “current conditions” results. Deeper in the report is the 1yr inflation expectations, which came in at 4.6%, a sharp increase above expectations of a slightly higher 3.7%. Turning to FED action, the market is currently pricing in a 25-bps hike in the upcoming meeting in the beginning of May. This would also bring the terminal rate in line with where the summary of economic projections (SEP) from the FOMC has been since December.
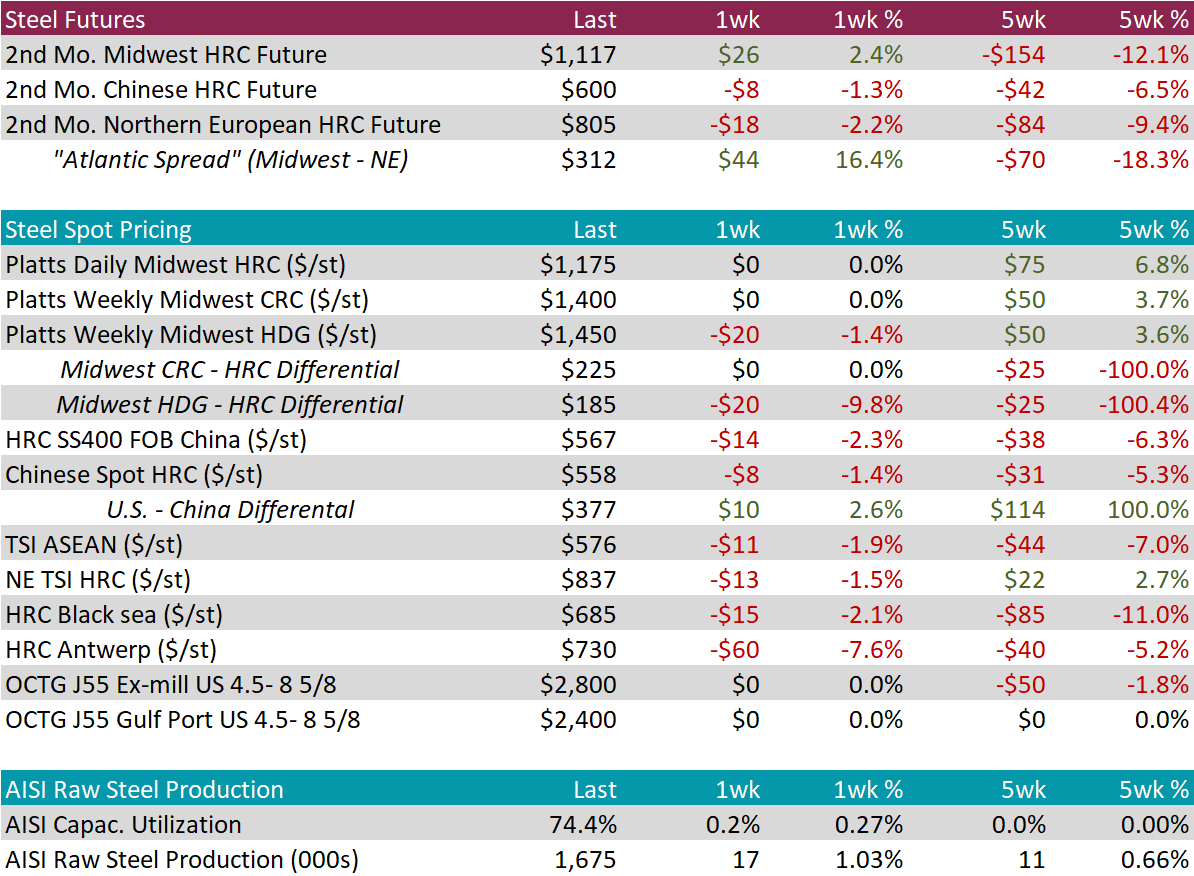
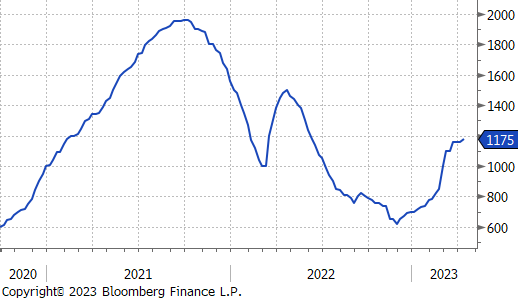
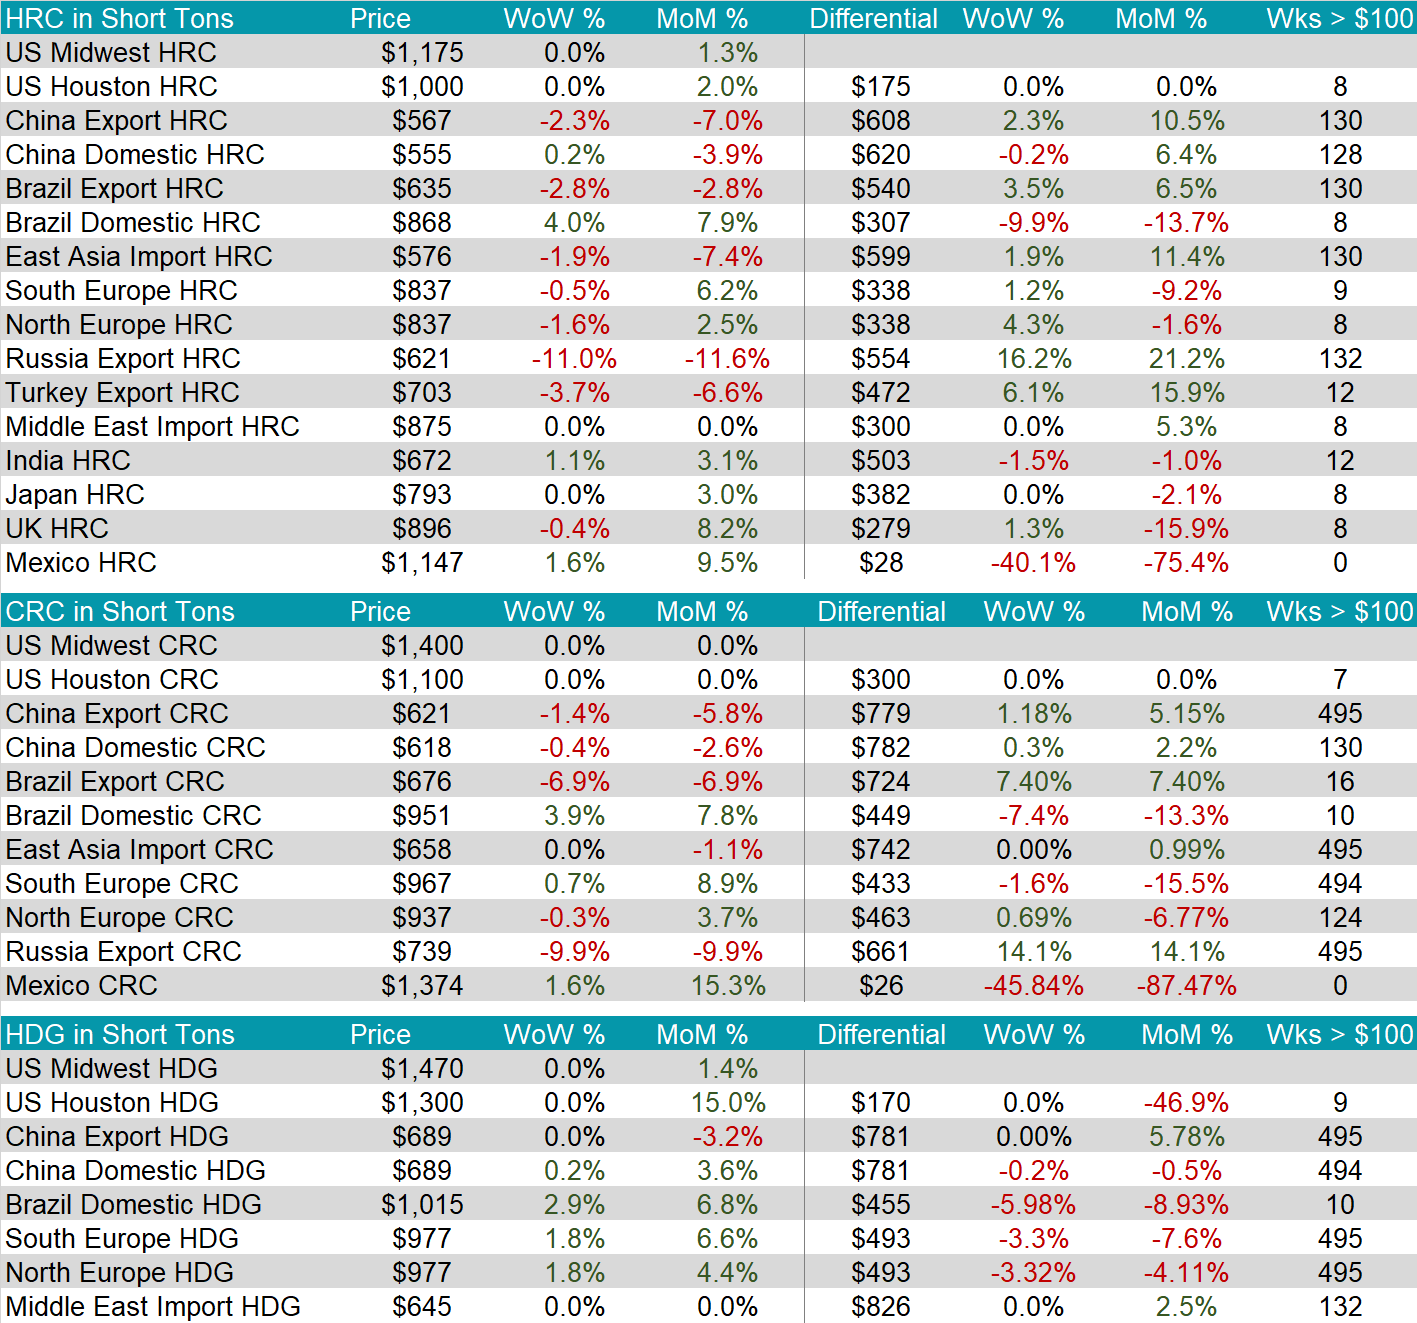
The 2nd Month (May) HRC Future was up $26 or 2.4% after falling steadily for multiple weeks. The spot price remains stable at $1,175 and it has been above the 2nd month future since the last week of May.
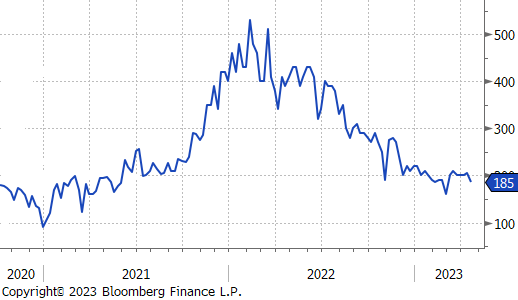
Tandem products spot pricing continues to soften, with HDG down 1.4% this week and anecdotal evidence of significantly more availability than HRC. This caused the HDG – HRC Differential to compress further, now back down to $185.
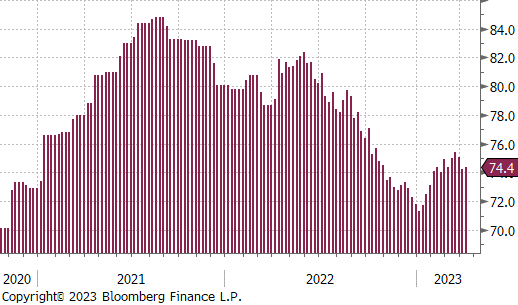
Domestic production was up slightly this week with capacity utilization increasing 0.2% to 74.4% after 3 straight weeks of declines. Stability of demand remains an upside price risk because of this mill restraint.
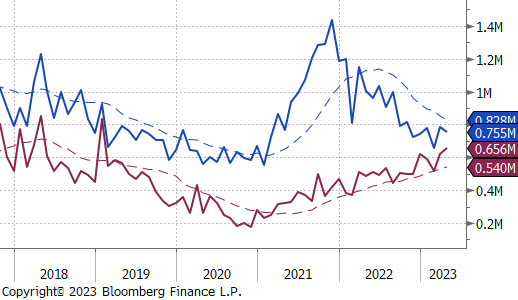
April Projection – Sheet 755k (down 29k MoM); Tube 656k (up 37k MoM)
March Projection – Sheet 784k (up 126k MoM); Tube 619k (up 100k MoM)
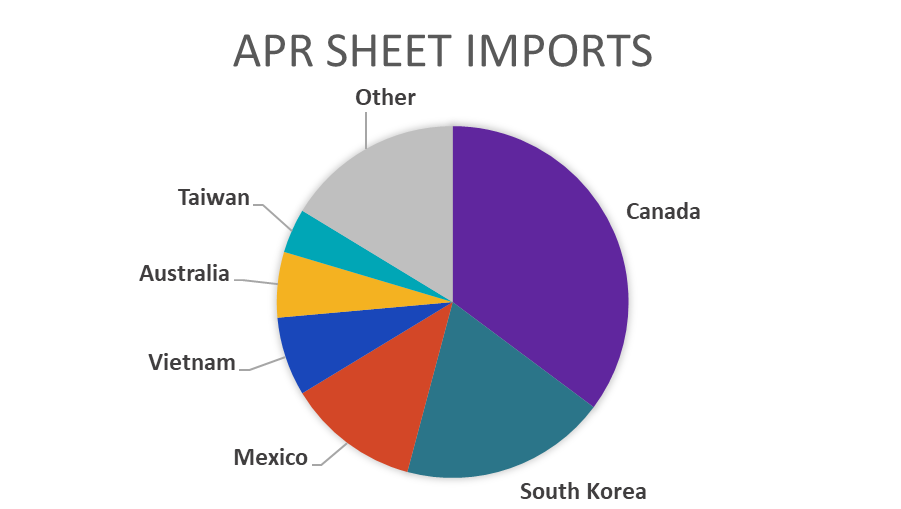
Arrivals remain surprisingly subdued given how long differentials have been positive. While we do anticipate a higher trend going into warmer months, pervasive market concerns around demand should keep a ceiling on imports in the short term.
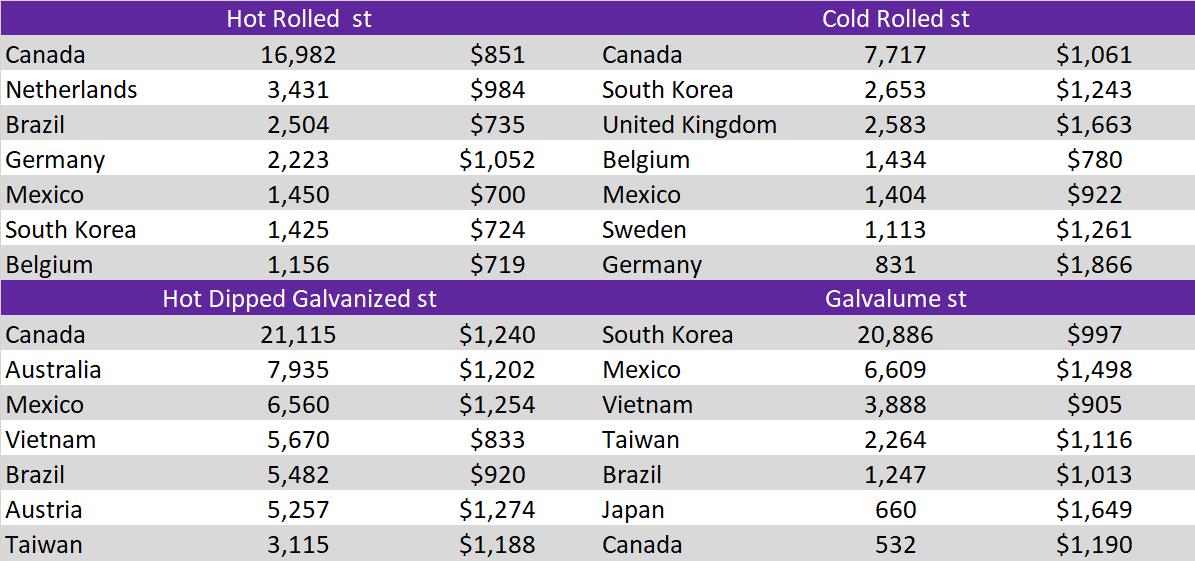
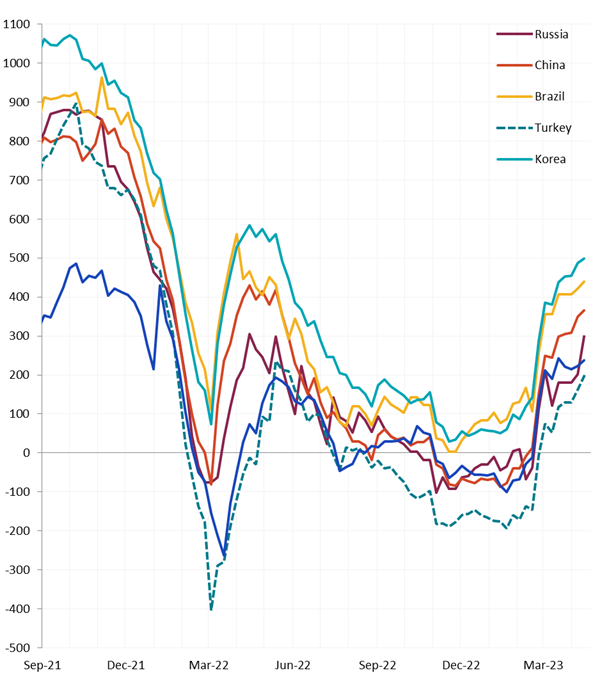
Global differentials moved sharply higher this week, as the rest of the world continues to sell off. Most notably this week, the Northern European price rolled over, down 1.6%.
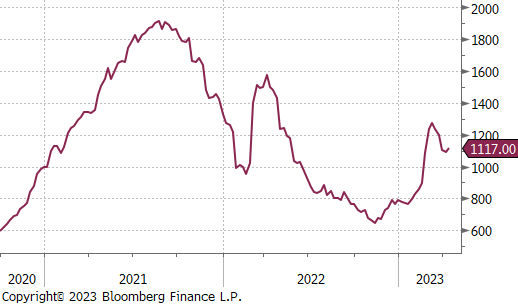
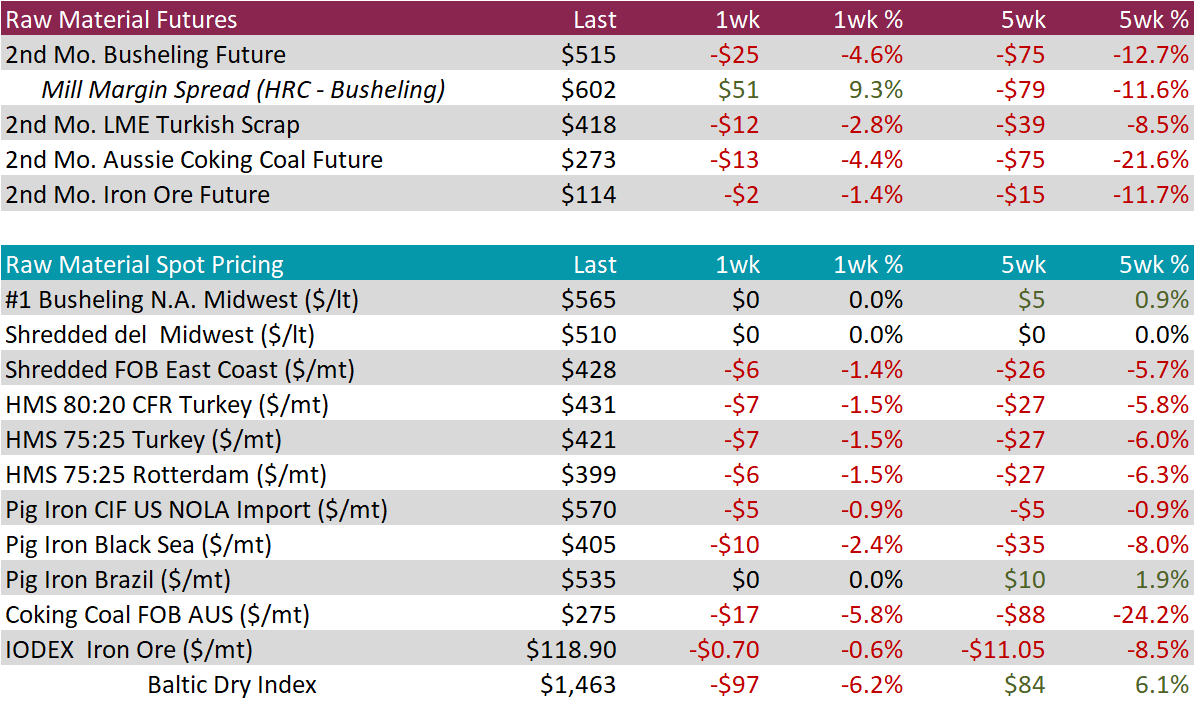
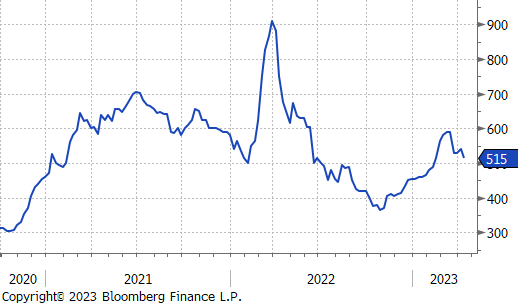
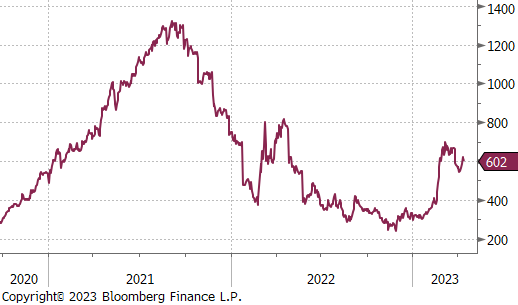
Spot busheling pricing was unchanged again this week, after last week’s settlement, however, the 2nd month busheling future price was down $25 or 4.6%. This, along with the higher HRC future price, caused the mill margin spread to expand back up to $602.
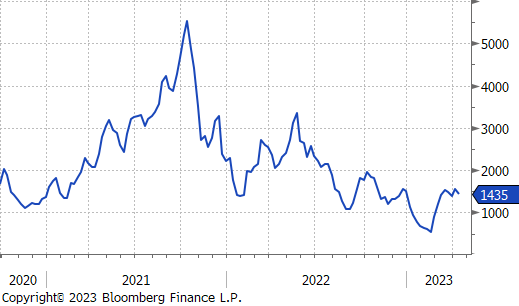
The 2nd month Aussie coking coal future sold off further this week, down another 4.4% and 21.6% over the last 5-weeks.
Dry Bulk / Freight
The Baltic dry index was down 6.2%, but it has been moving in a tight range for the last 6-weeks.
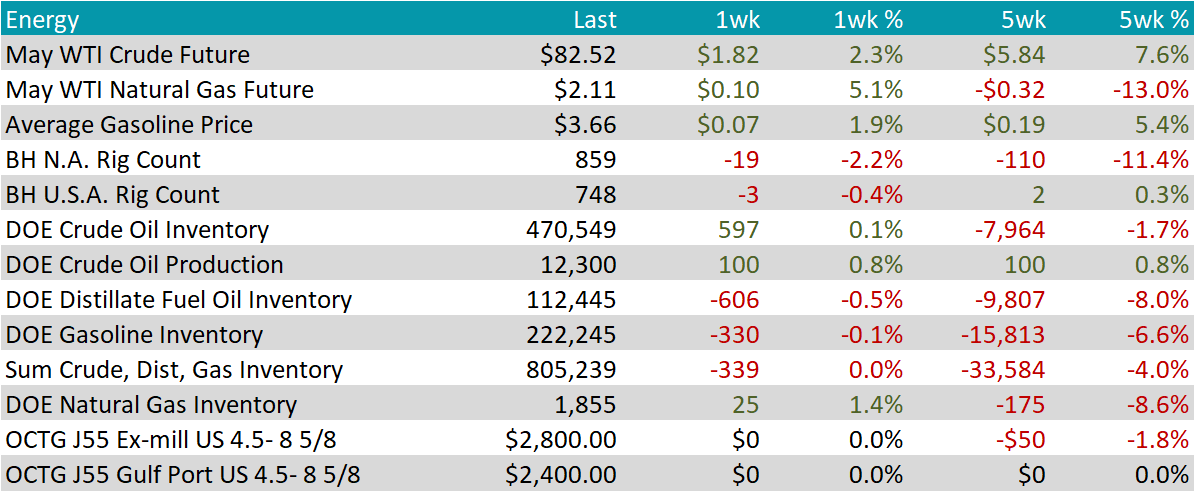
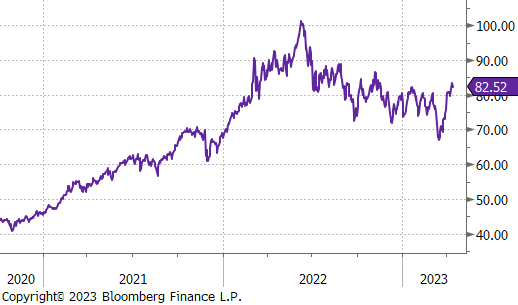
The May WTI crude oil future gained another $1.82 or 2.3% to $82.52/bbl.
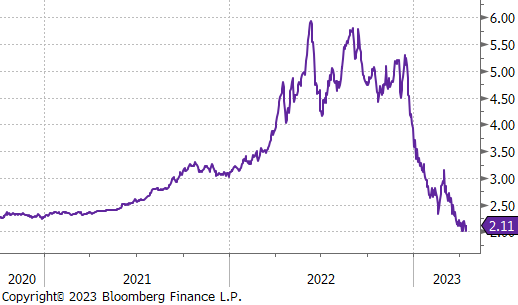
The May WTI natural gas future gained $0.10 or 5.1% to $2.11/bbl.
The aggregate inventory level was down slightly, but the move is measured at 0%. Over the last 5-weeks, this inventory levels is down 4%.
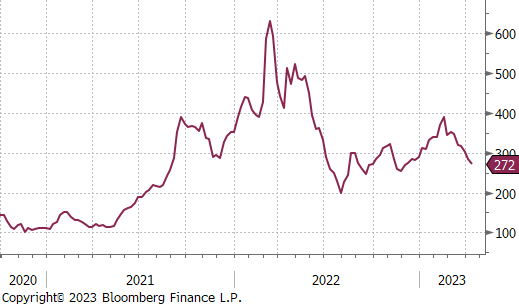
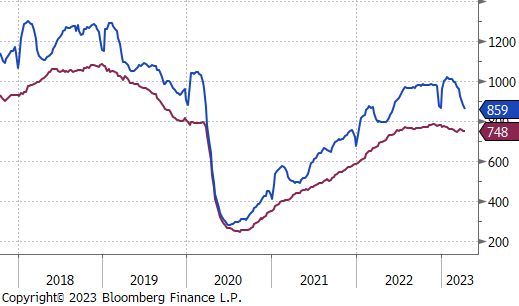
The Baker Hughes North American rig count continues to slide, down another 19 rigs, with the U.S. rig count down 3 rigs.
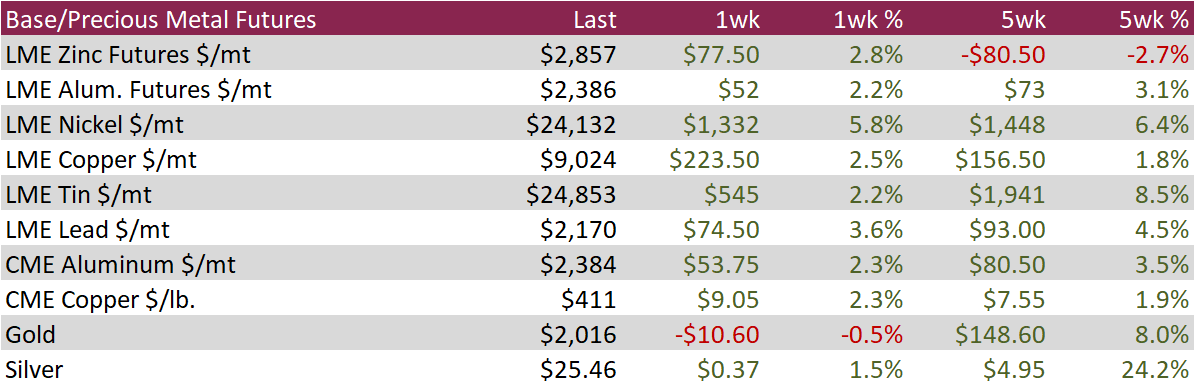
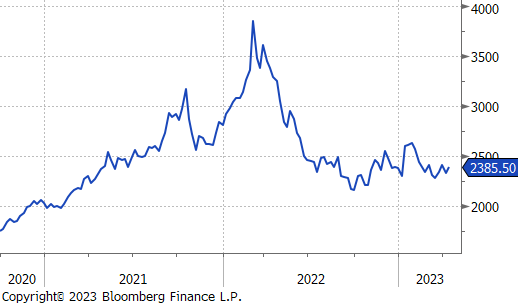
Aluminum futures on the LME finished the week ending April 14th with a 2.3% advance amid expectations for less aggressive interest rate hikes from the Federal Reserve and a continued increase in Chinese demand. In industry news, MetalX and Manna Capital Partners will invest over $200 million to construct a 220 million/lb year aluminum rolling slab facility in the US Midwest that will produce alloys with low carbon emissions for the beverage packaging and automotive industries, according to Platts.
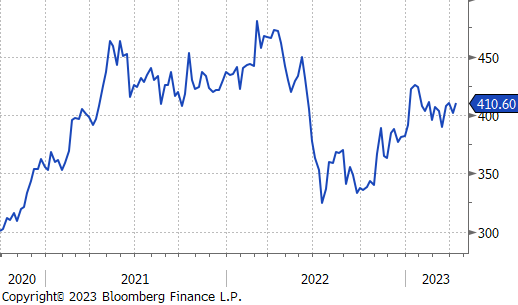
Copper futures advanced 2.5% during the week, recouping the losses sustained in the week prior and breaking back above $9,000 per metric ton. Futures hit a 7-week high on Friday before pulling back as investors locked in profits driven by a weaker dollar and tightening inventories. Copper inventories in warehouses monitored by the Shanghai Futures Exchange were down 4% last week, while copper held in LME registered warehouses has fallen to the lowest level since 2005.
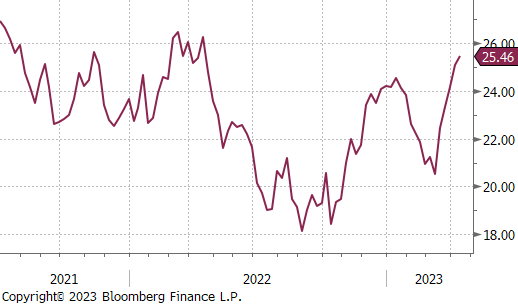
Silver futures finished the week 1.5% higher, capping off a 5-week advance but failing to hold above the key resistance level of $26 per troy ounce. Silver ETFs increased their silver holdings by 2.13 million troy ounces during the week, while money manager long-only positions rose to the highest level in 10 weeks.
Following up on last week’s Market Analysis this week’s data for continuing and initial jobless claims show that the trend remains intact, and the labor market continues to cool at a moderate level.
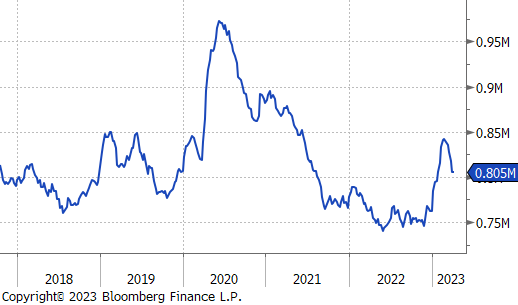
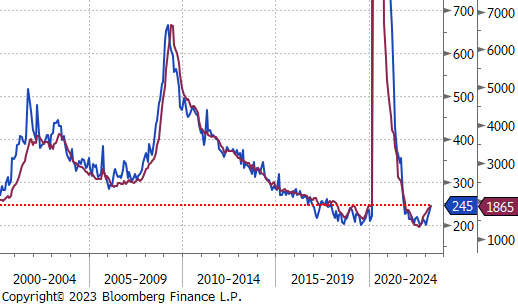
Manufacturing production in March a subsection of industrial production was down 0.5%, well below expectations, however, that figure is slightly misleading due to a significant upward revision to the February data, showing that even though it retraced, manufacturing activity in the first quarter was stable. The underlying index is to the right.
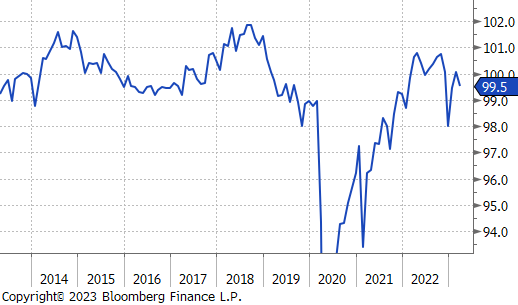
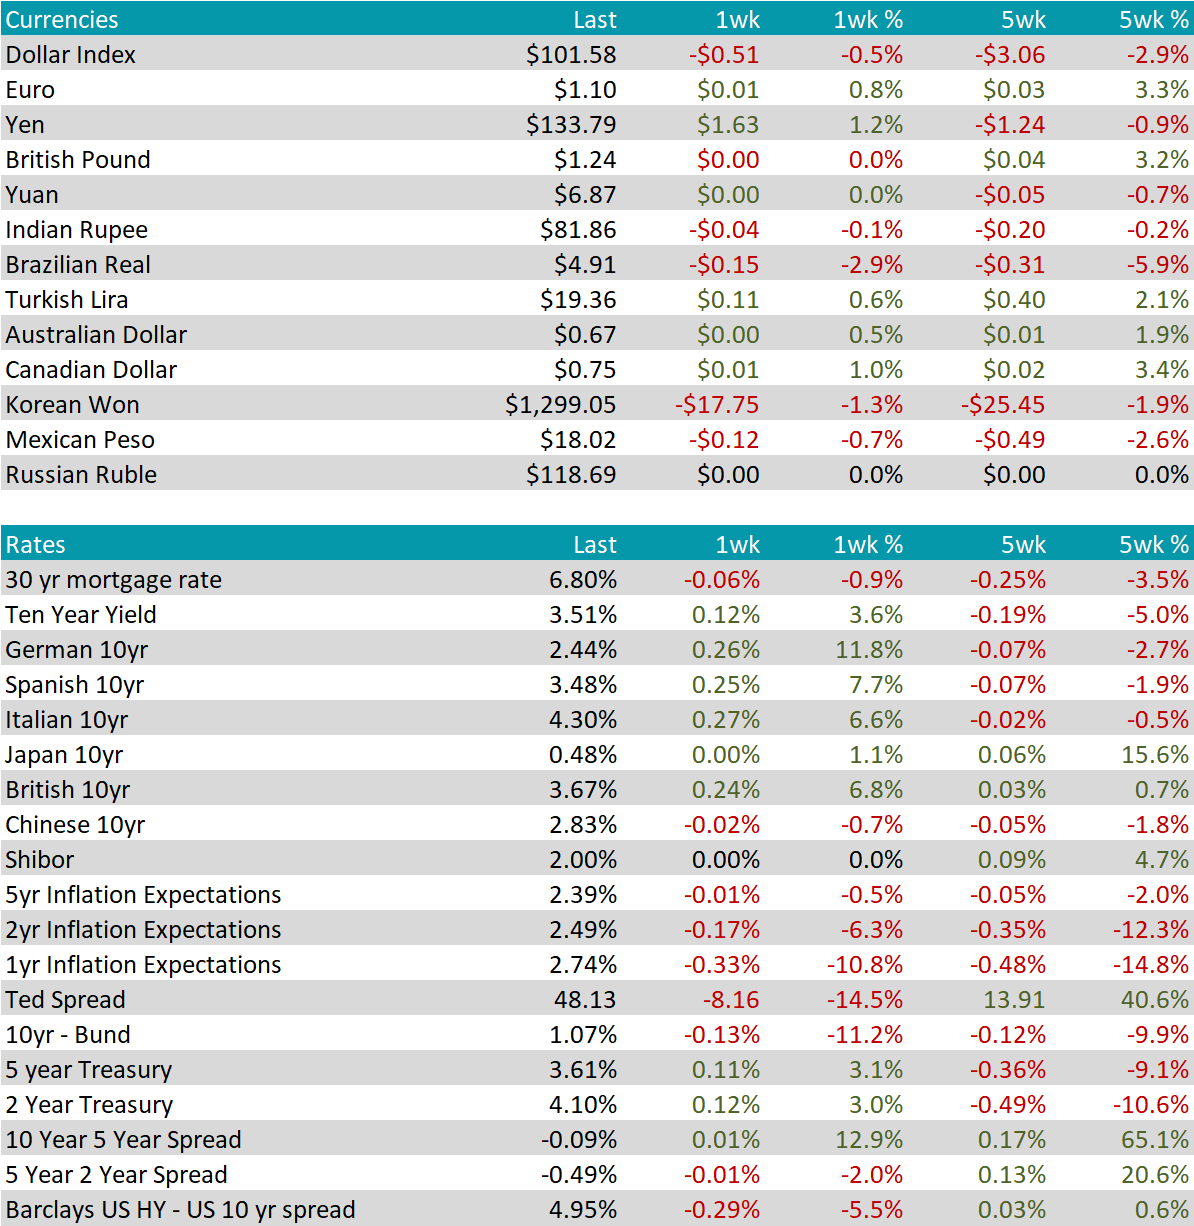
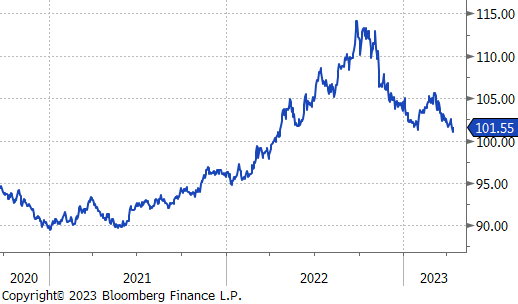
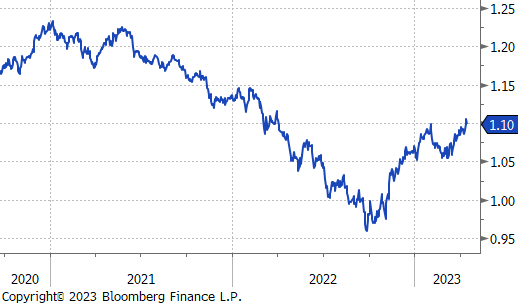
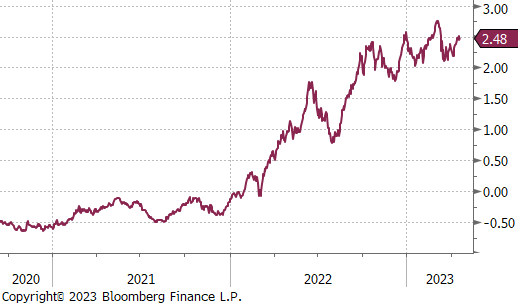
The U.S. dollar sold off this week down to 101.58, this is a continuation of the broader trend that began in early May. The Euro ended the week at 1.10. This has been a strong resistance level since early April 2022.
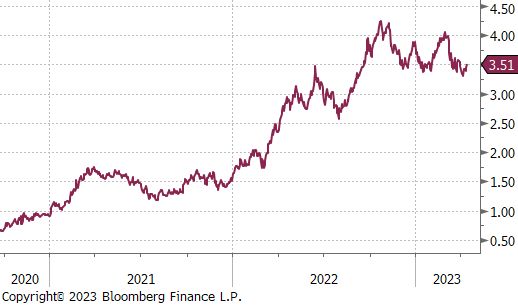
The U.S. 10yr Treasury yield was up 12 bps, and the German 10yr Treasury yield was up 24 bps. Taking a step back from the weekly changes, the structural trends between the U.S. and Europe are fundamentally different since December. The U.S. is reaching lower floors after every sell off, while German yields, a stand in for the rest of Europe, are higher. This is largely because the inflation outlook for Europe is worse than in the U.S., suggesting the ECB may need to continue hiking after the Fed has ended.