Flack Capital Markets | Ferrous Financial Insider
April 21, 2023 – Issue #376
April 21, 2023 – Issue #376
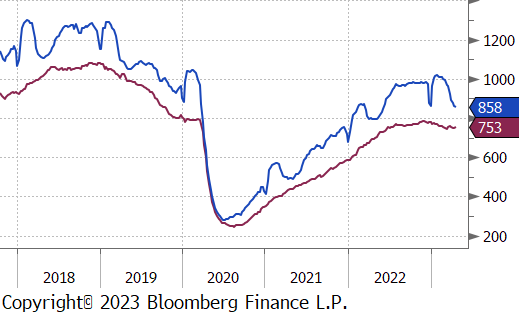
Since the beginning of the year, we have been closely watching and writing about the relationship between housing starts and building permits and what it means for the pipeline of steel demand. While residential construction is less steel intensive than non-residential, we identified this as the canary in the coal mine for higher interest rates. Furthermore, increased residential construction historically leads to higher demand for durable goods and autos.
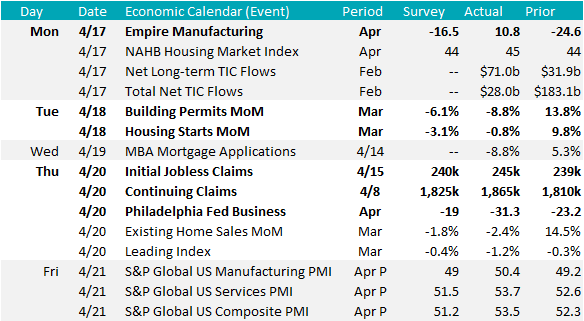
After an immediate negative reaction to the Fed’s rate hike cycle in March of last year, both permits and starts have both held up remarkably well since the beginning of 2023 with the current data above mid-2019 levels. That said, March data showed mixed results versus expectations with building permits down 8.8% versus an expectation of down 6.1% and housing starts down only 0.8% versus an expectation of 3.1%. This does signal a tightening of the pipeline after February’s gangbusters permits data, however, the healthy dynamic of more permits than starts remains intact.
Taking a step back, the unexpected increase in activity is the real takeaway from the first quarter, which can be seen in every other category of steel consumption. At the end of 2022, no one predicted HRC to reach $1,200, and the fact of the matter is that the market was overprepared for demand to disappear by holding inventories at hand to mouth levels. Through the data available and by anecdotal evidence, it does not appear as though this problem has been corrected. While pricing data shows that global and domestic steel prices have lost their upward momentum, and are beginning to rollover, we anticipate that limited availability will keep the floor elevated if demand holds at current or higher levels.
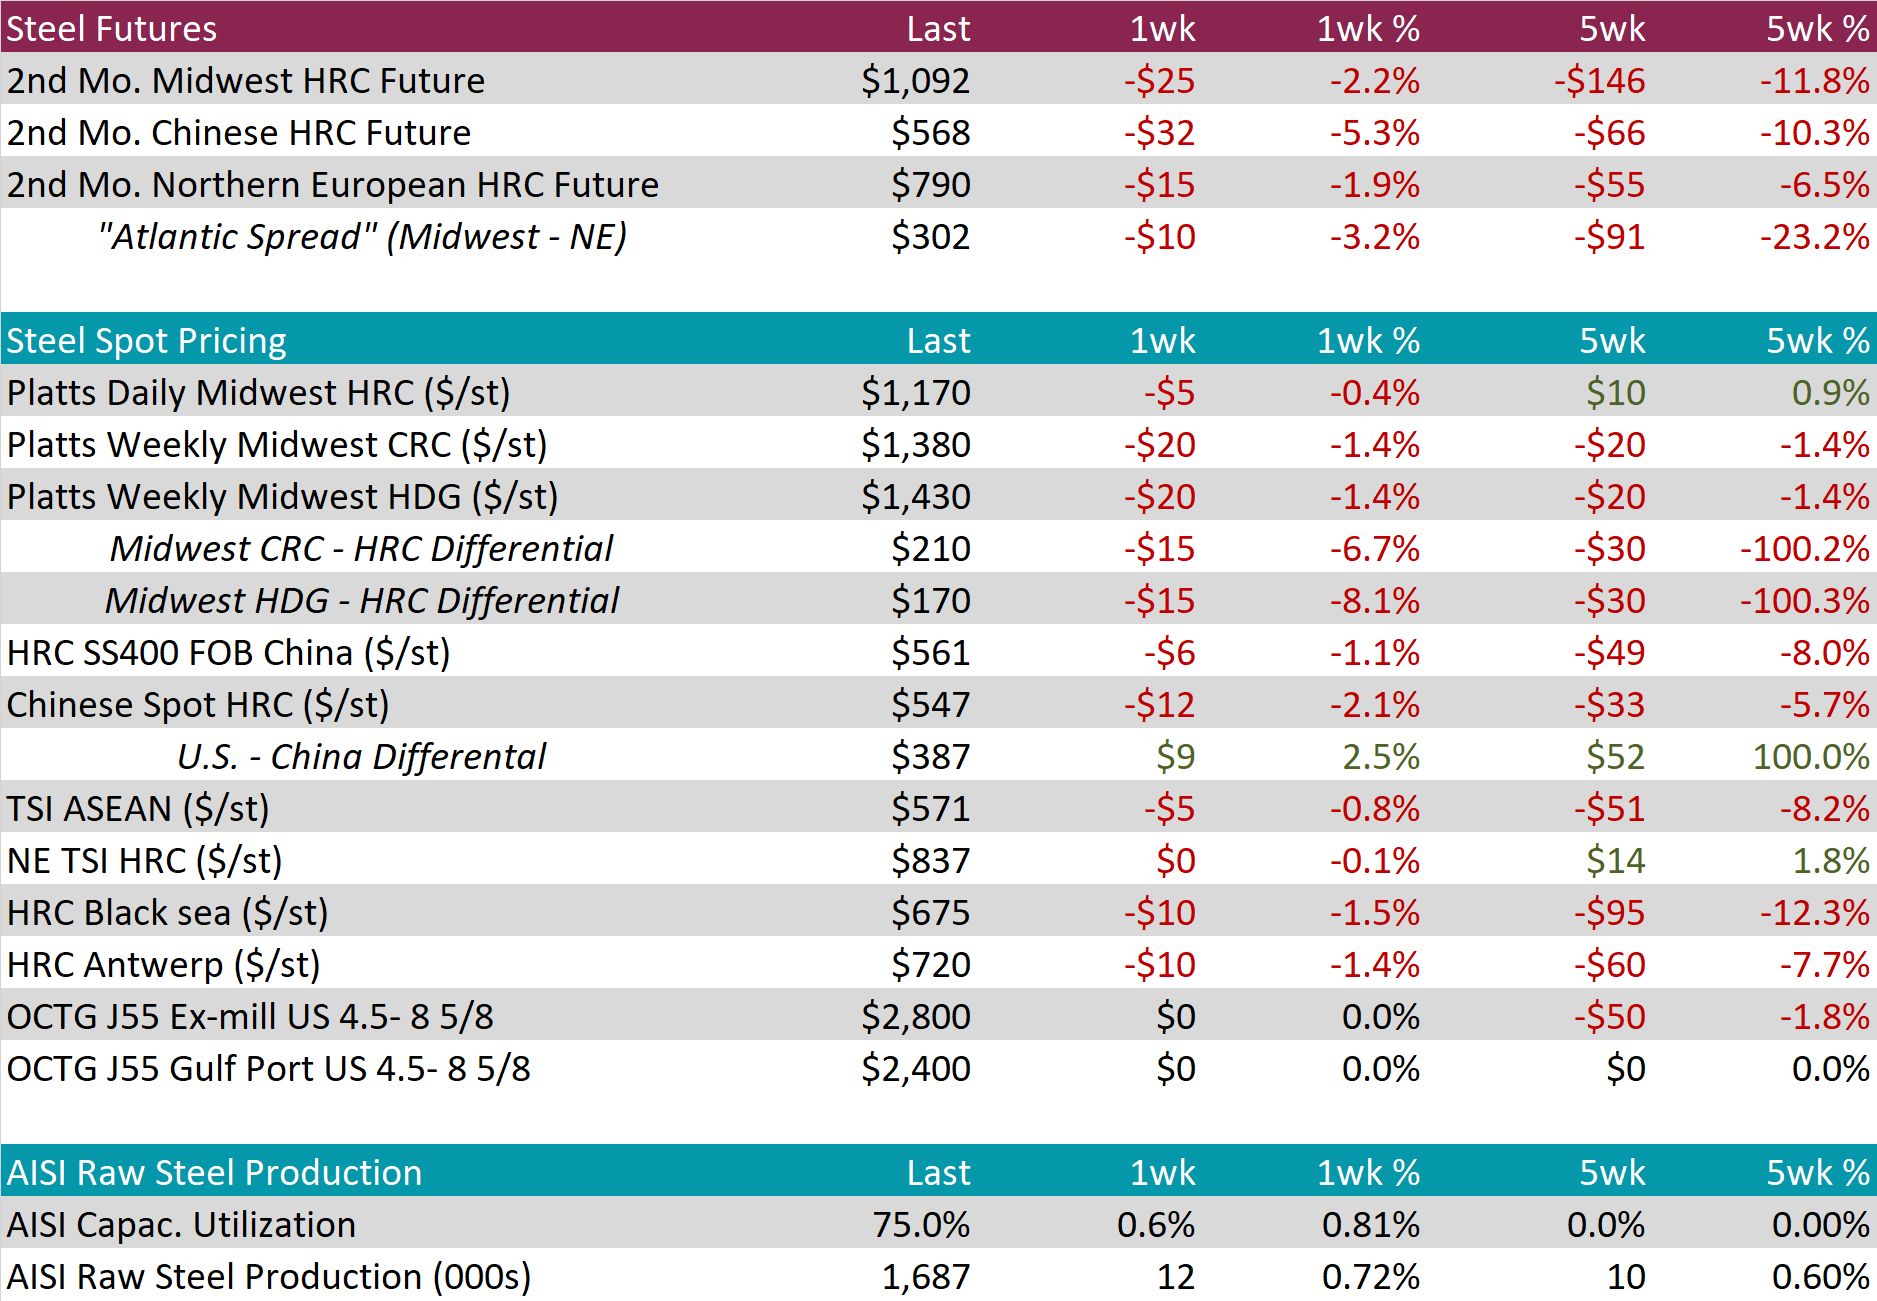
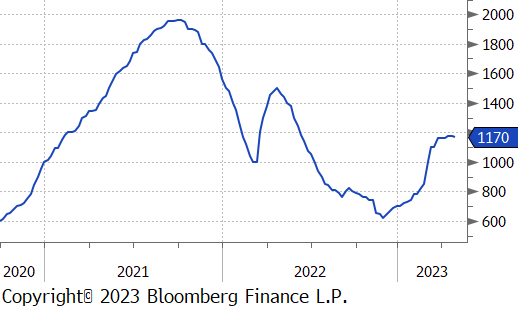
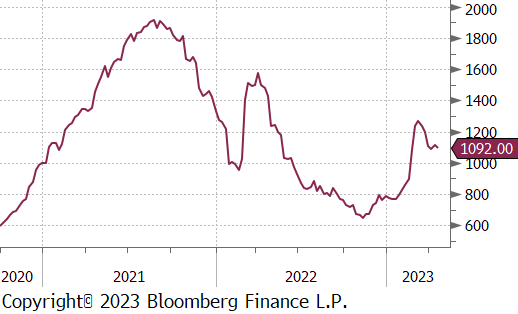
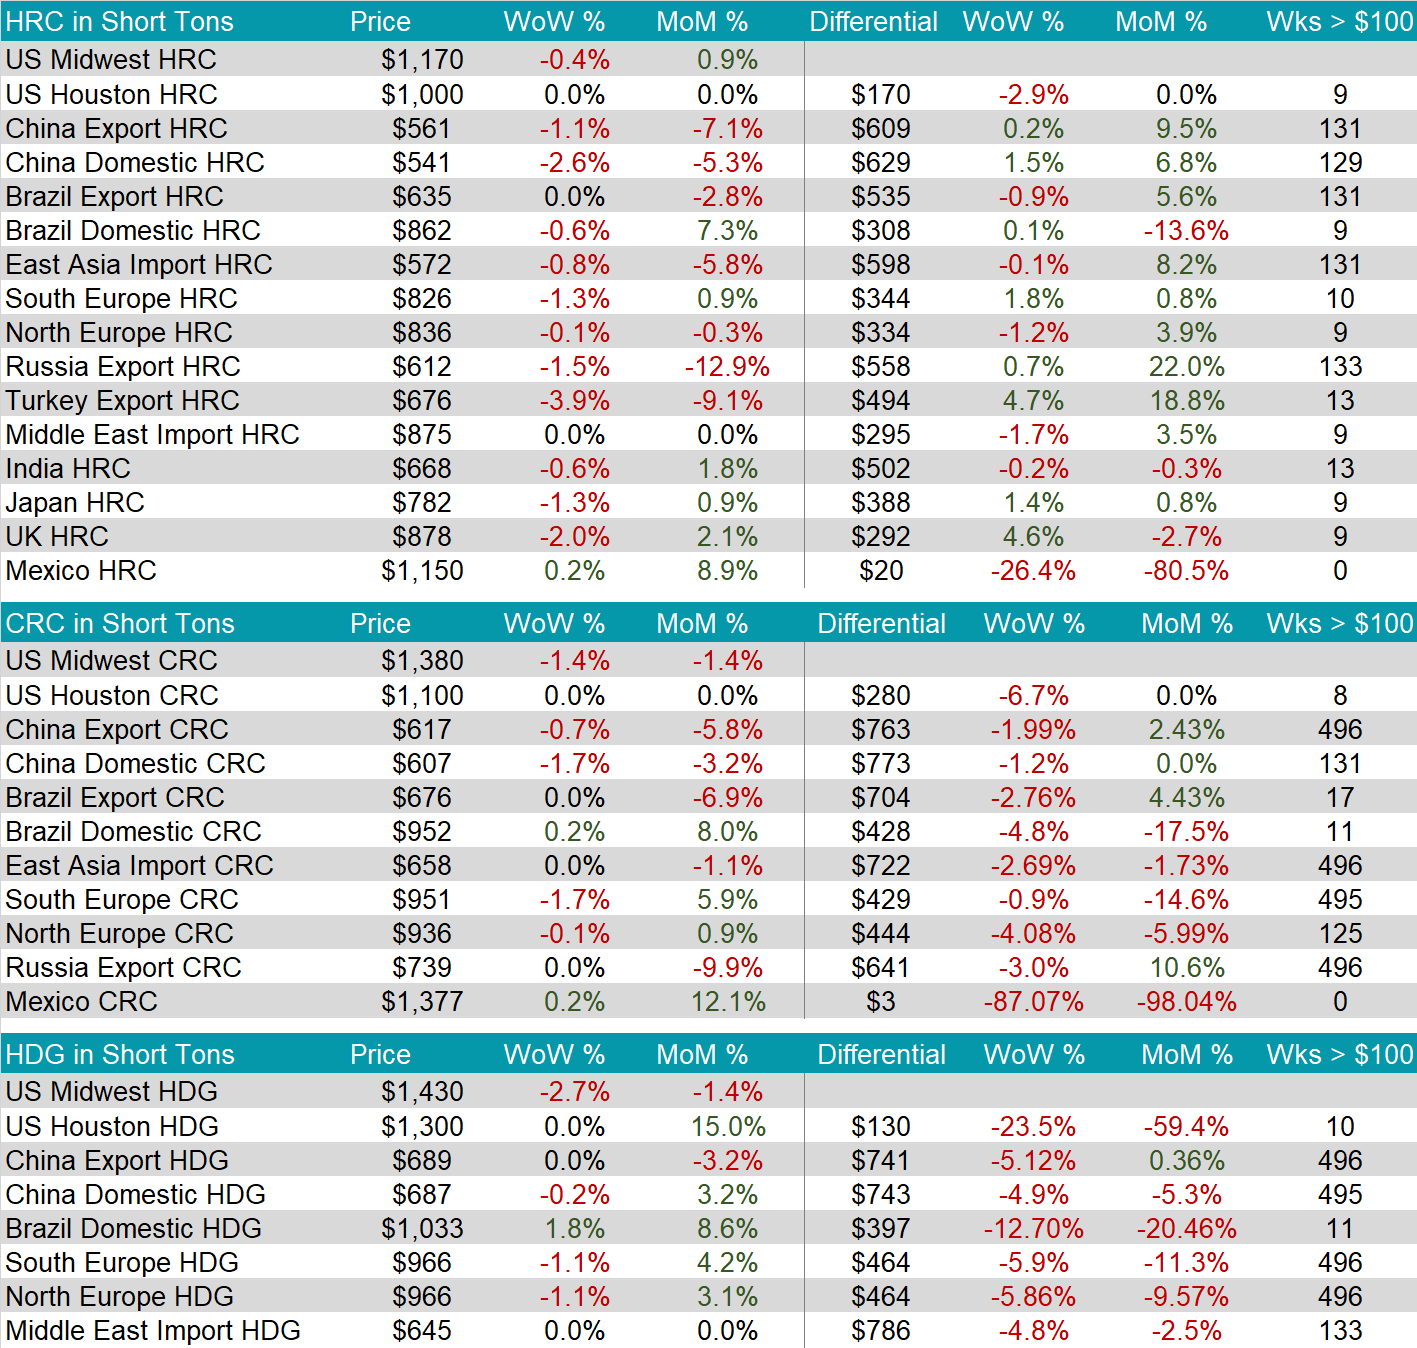
The HRC spot price was down $5 to $1,170 and the May future price was down $25 to $1,092.
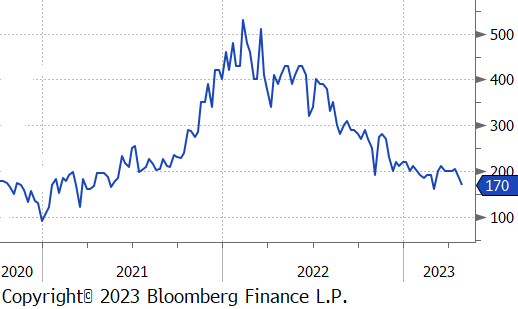
Throughout the current rally in prices, tandem products have consistently been weaker and that continued this week. Both CRC and HDG down $20, respectively, and the HDG-HRC differential reached its lowest level since the end of February.
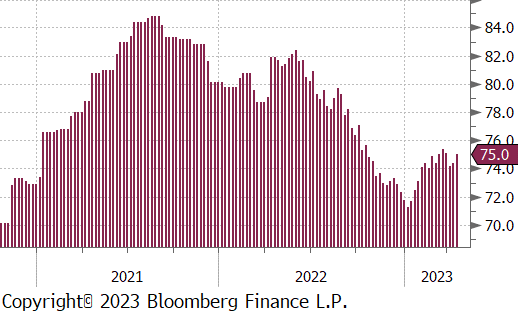
Domestic production continues to be rangebound at a depressed level, but capacity utilization increased 0.6%, up to 75% last week.
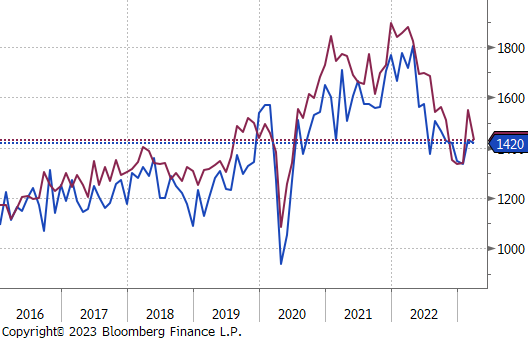
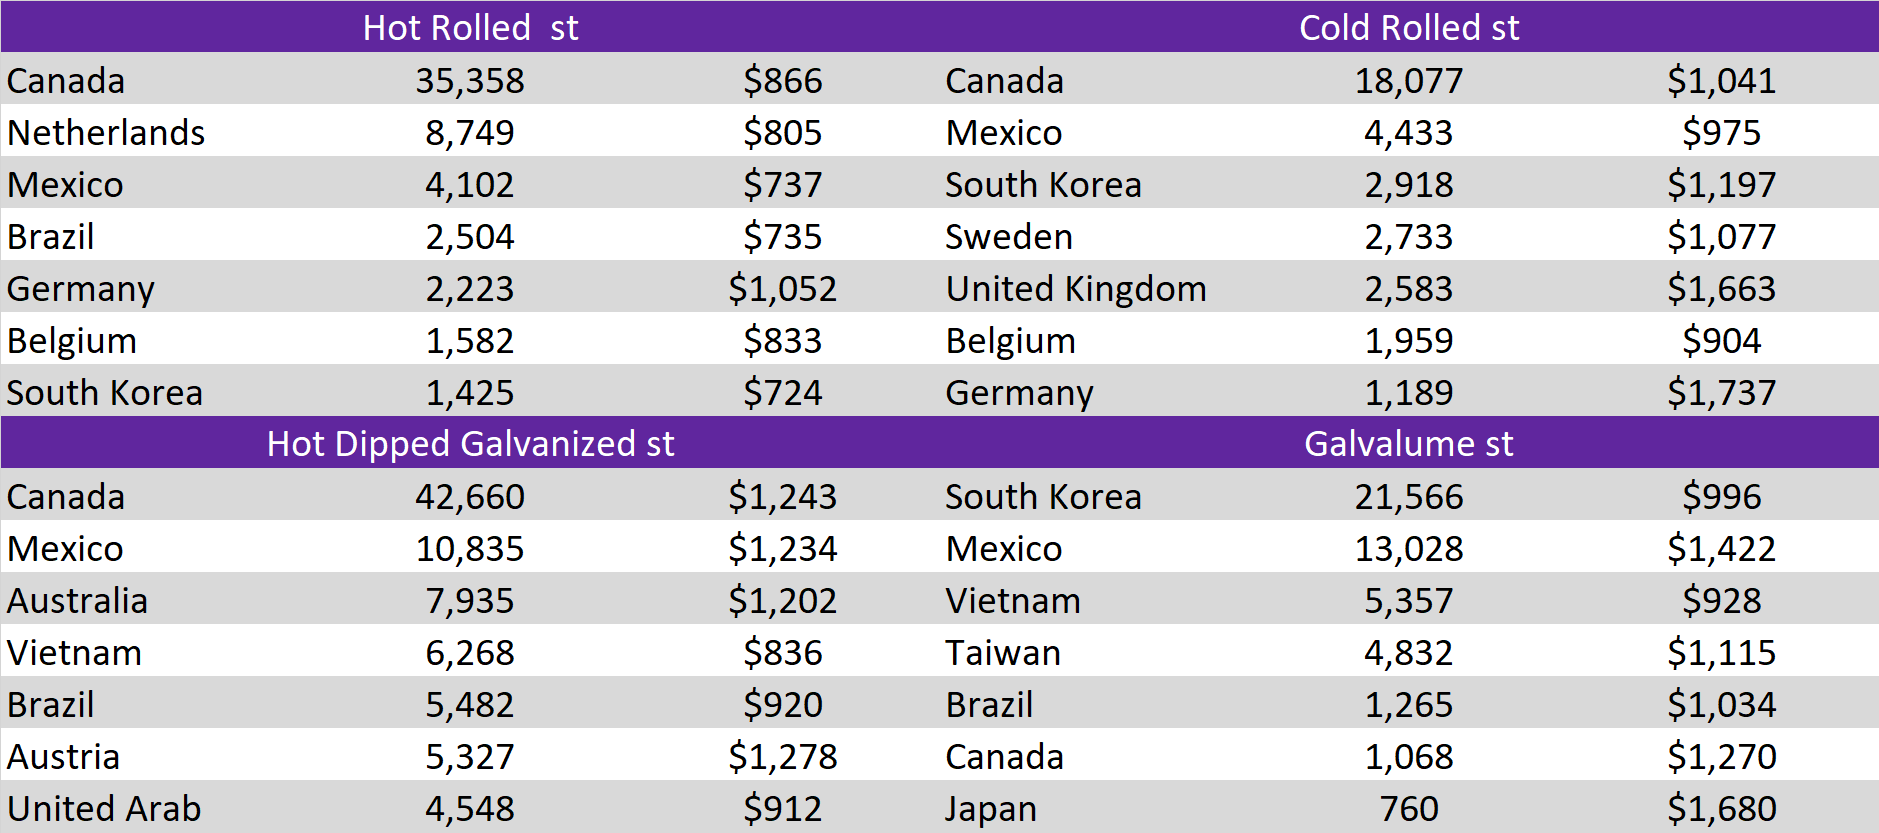
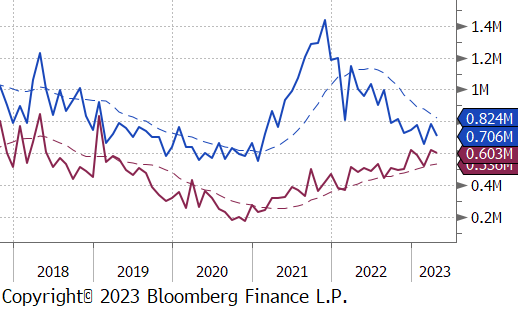
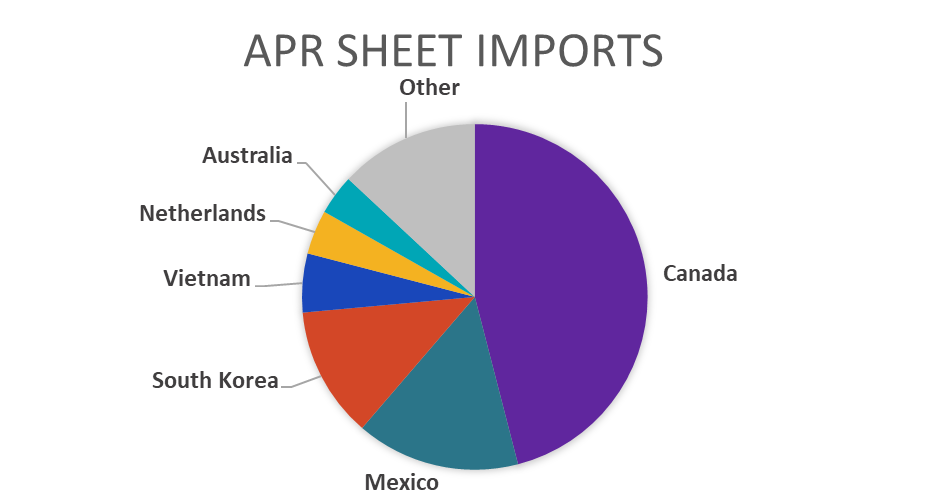
April Projection – Sheet 706k (down 80k MoM); Tube 603k (down 18k MoM)
March Projection – Sheet 786k (up 128k MoM); Tube 621k (up 103k MoM)
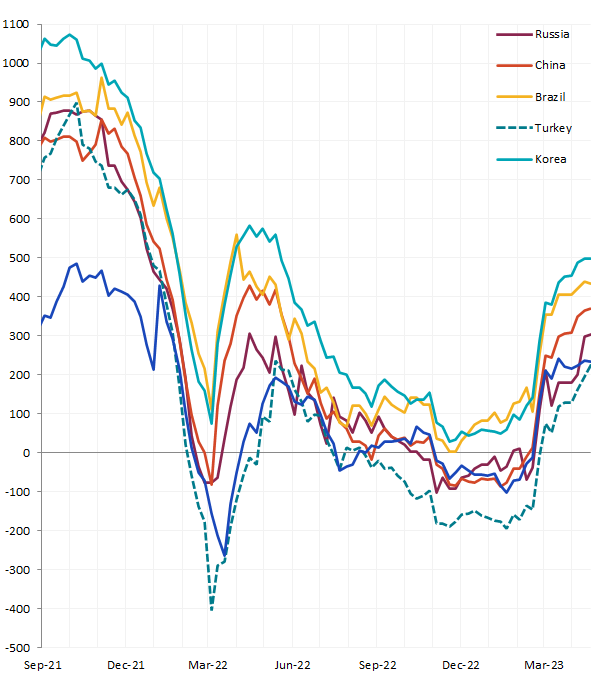
Global differentials were mostly higher again this week, even though the U.S. domestic price dipped, slightly. This was because all the watched countries prices fell more significantly, excluding Northern Europe, which was only down 0.1%.
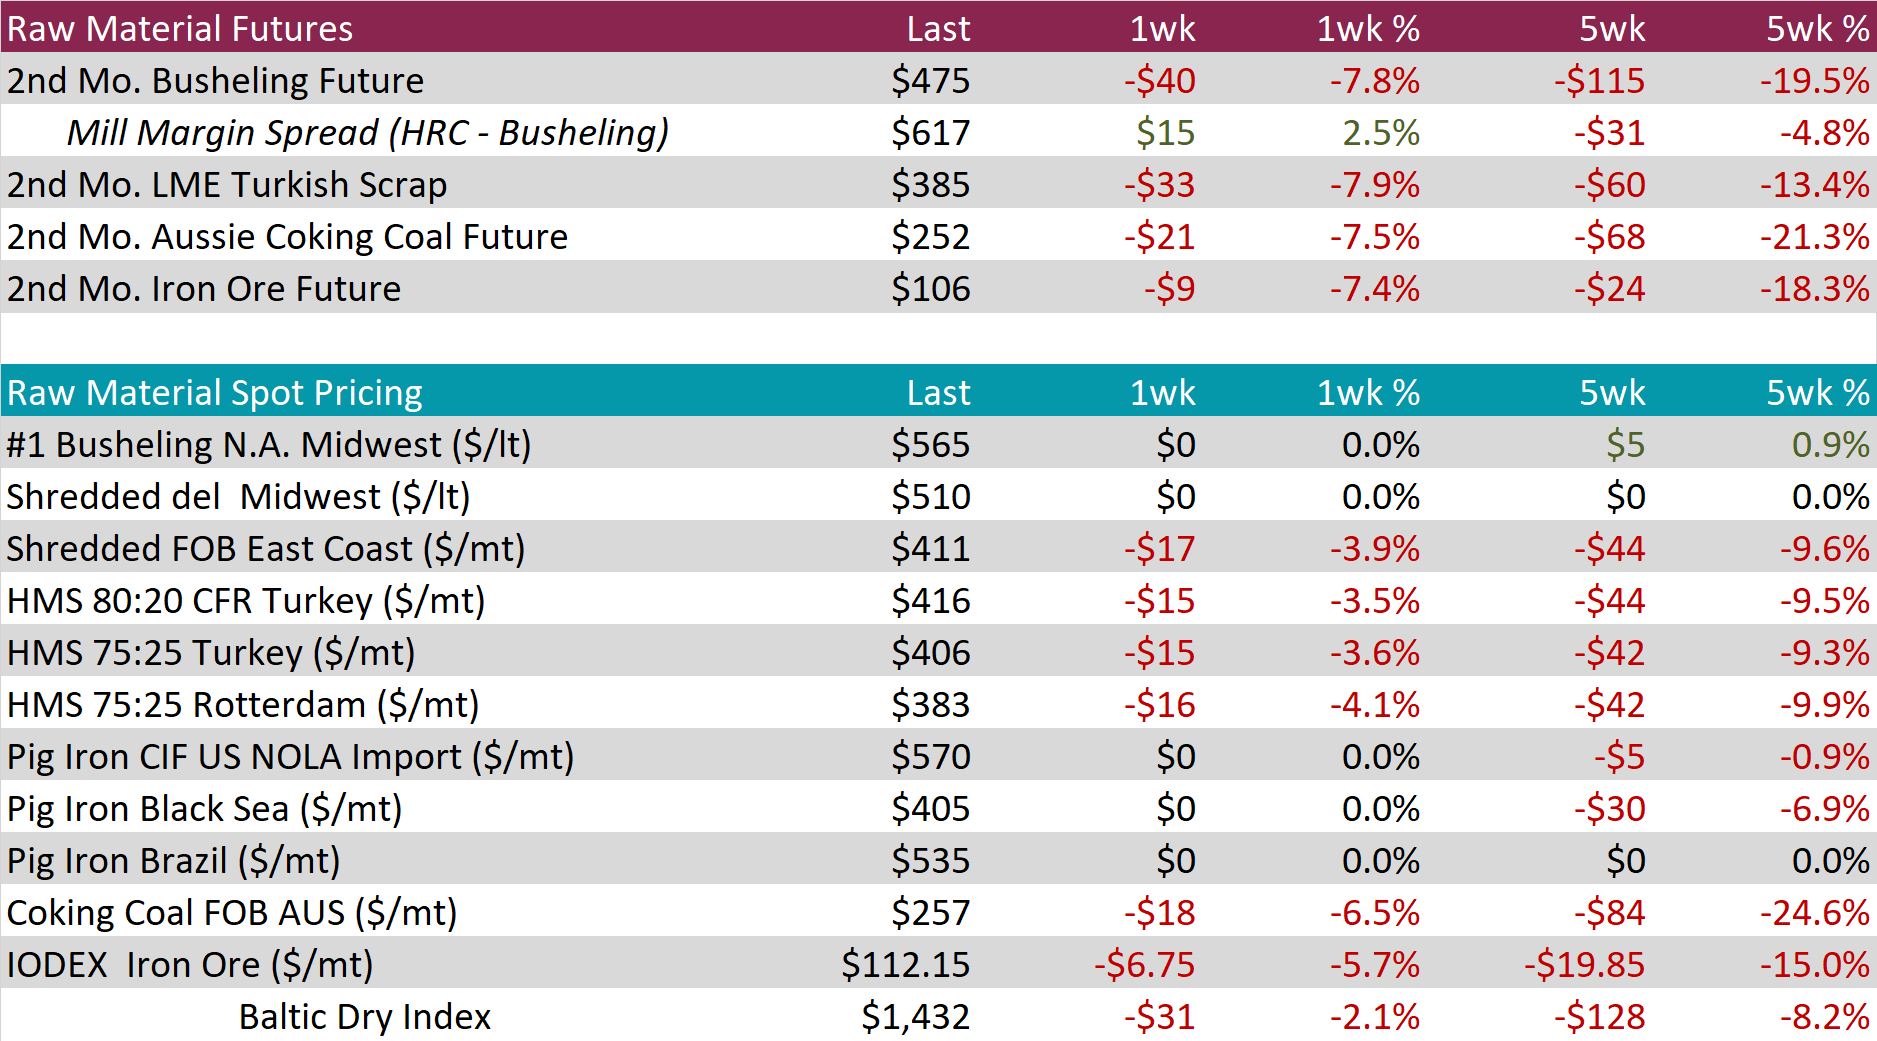
Last week was a bad week for raw materials with all the monitored future contracts down more than 7%. Spot raw material pricing was also lower, and current expectations are for a lower monthly domestic scrap settlement in May.
Dry Bulk / Freight
The Baltic dry index was lower last week, down 2.1%, but it continues to trade in a surprisingly tight range given the recent downtrend in iron ore prices.
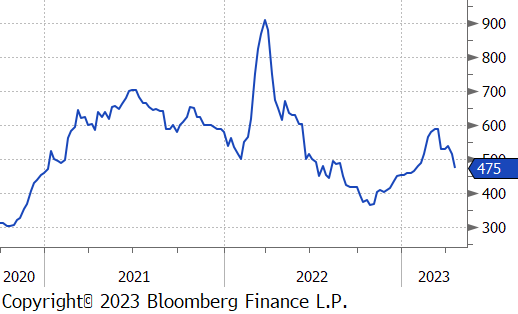
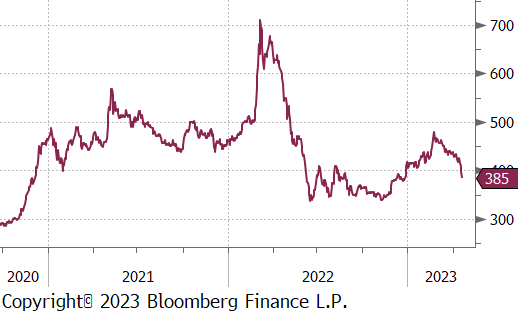
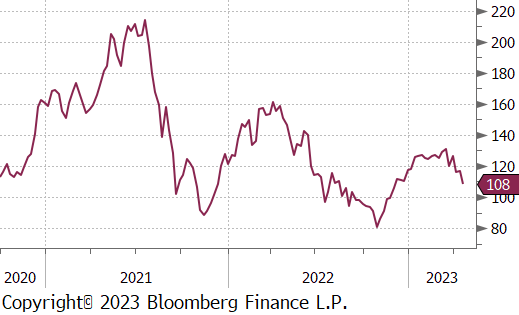
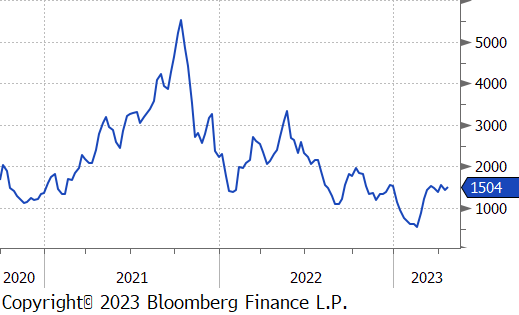
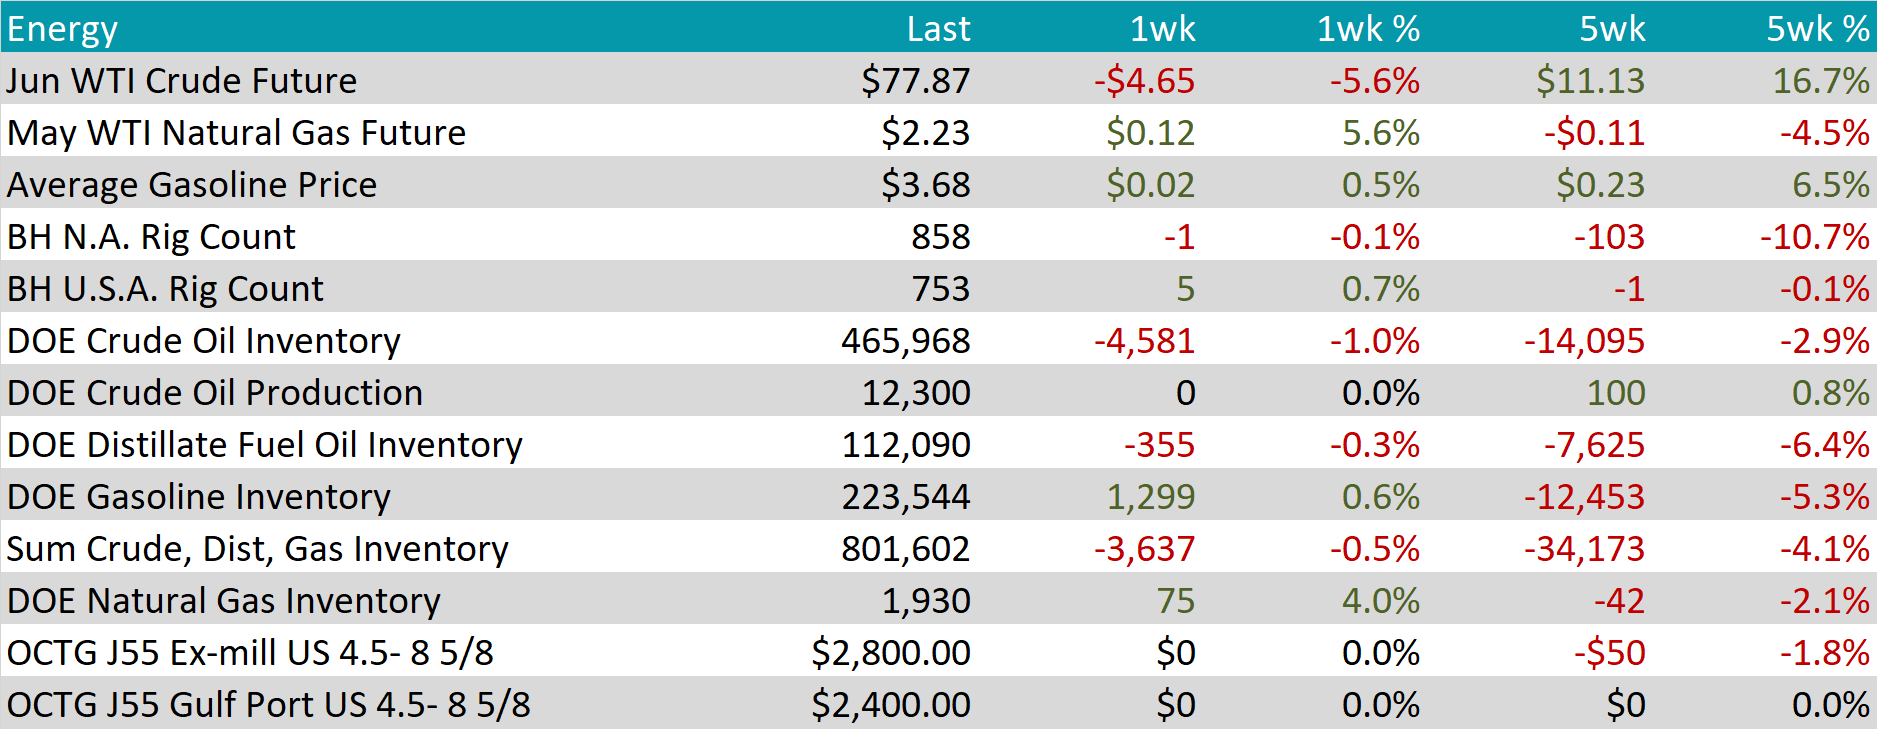
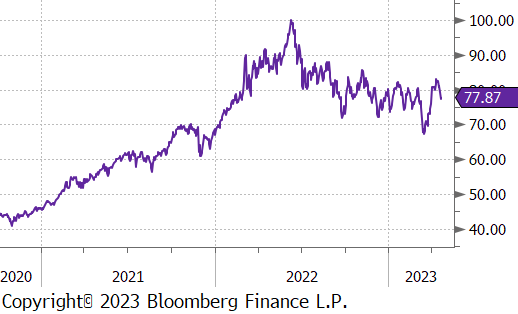
WTI crude oil future lost $4.65 or 5.6% to $77.87/bbl.
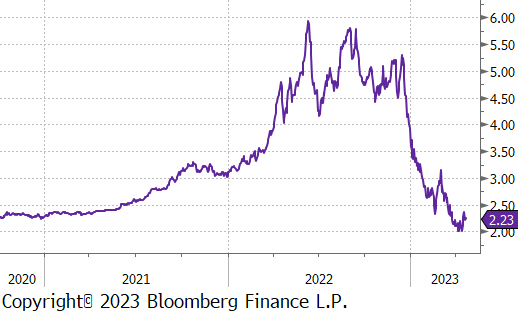
WTI natural gas future gained $0.12 or 5.6% to $2.23/bbl.
The aggregate inventory level was down 0.5%.
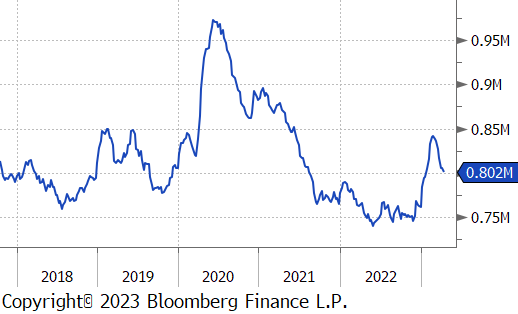
The Baker Hughes North American rig count was down 1 rigs, while the U.S. rig count rose by 5.
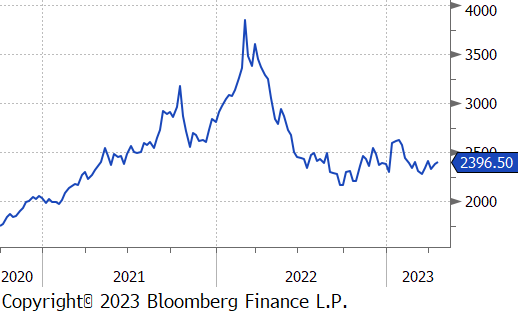
Aluminum futures capped off a two-week rally, finishing the week up 0.5%. News of power related capacity cuts in China’s Yunnan province outweighed fears that the market would see material inflows of Russian origin.
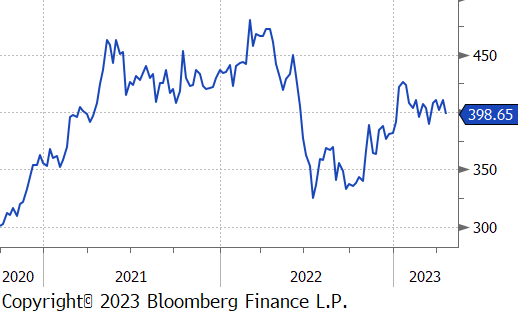
Copper futures finished lower by 2.5%, erasing all the prior week’s gains and closing at a five-week low. Copper has been hard-hit by an uncertain macro and demand environment, despite many analysts agreeing that the red metal could be facing a severe supply crunch. Demand from the world’s top buyer, China, has failed to materialize and has kept most metals in check this year.
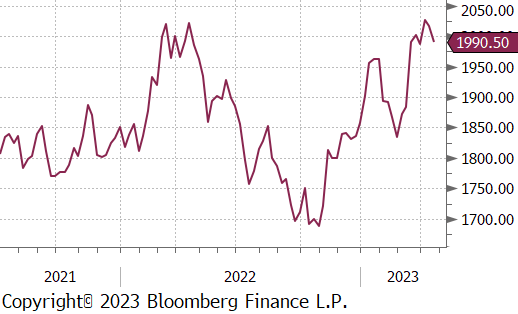
Gold fell 1.3%, brought down by a stronger dollar and higher US interest rates. The prospect of further rate hikes has been keeping a lid on non-interest-bearing assets like bullion, which posted its worst week since February. Despite its recent decline, Gold is still up approximately 9% YTD.

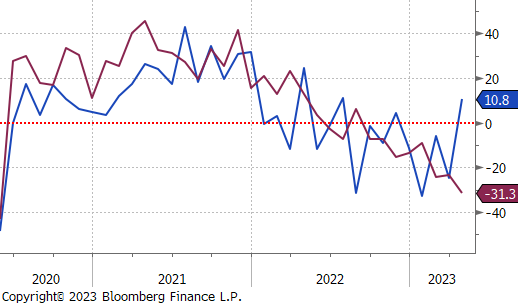
The first two April Regional Fed Manufacturing surveys were released this week, and each shows a different picture on demand.
The Empire (New York) survey unexpectedly printed 10.8, versus consensus expectations of -16.5. The main driver of this move higher was a significant increase in shipments and new orders.
On the other side, the Philadelphia survey printed -31.3, versus expectations of -19. This survey has now printed in contraction territory for 8 straight months was at the lowest print (ex. COVID) since August 2009.
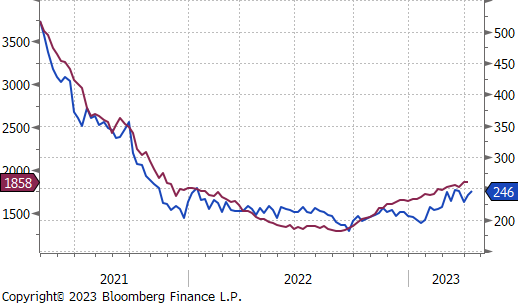
Additionally, we saw both initial and continuing jobless claims jump, with continuing claims back up to the recent peak from mid-December 2021.
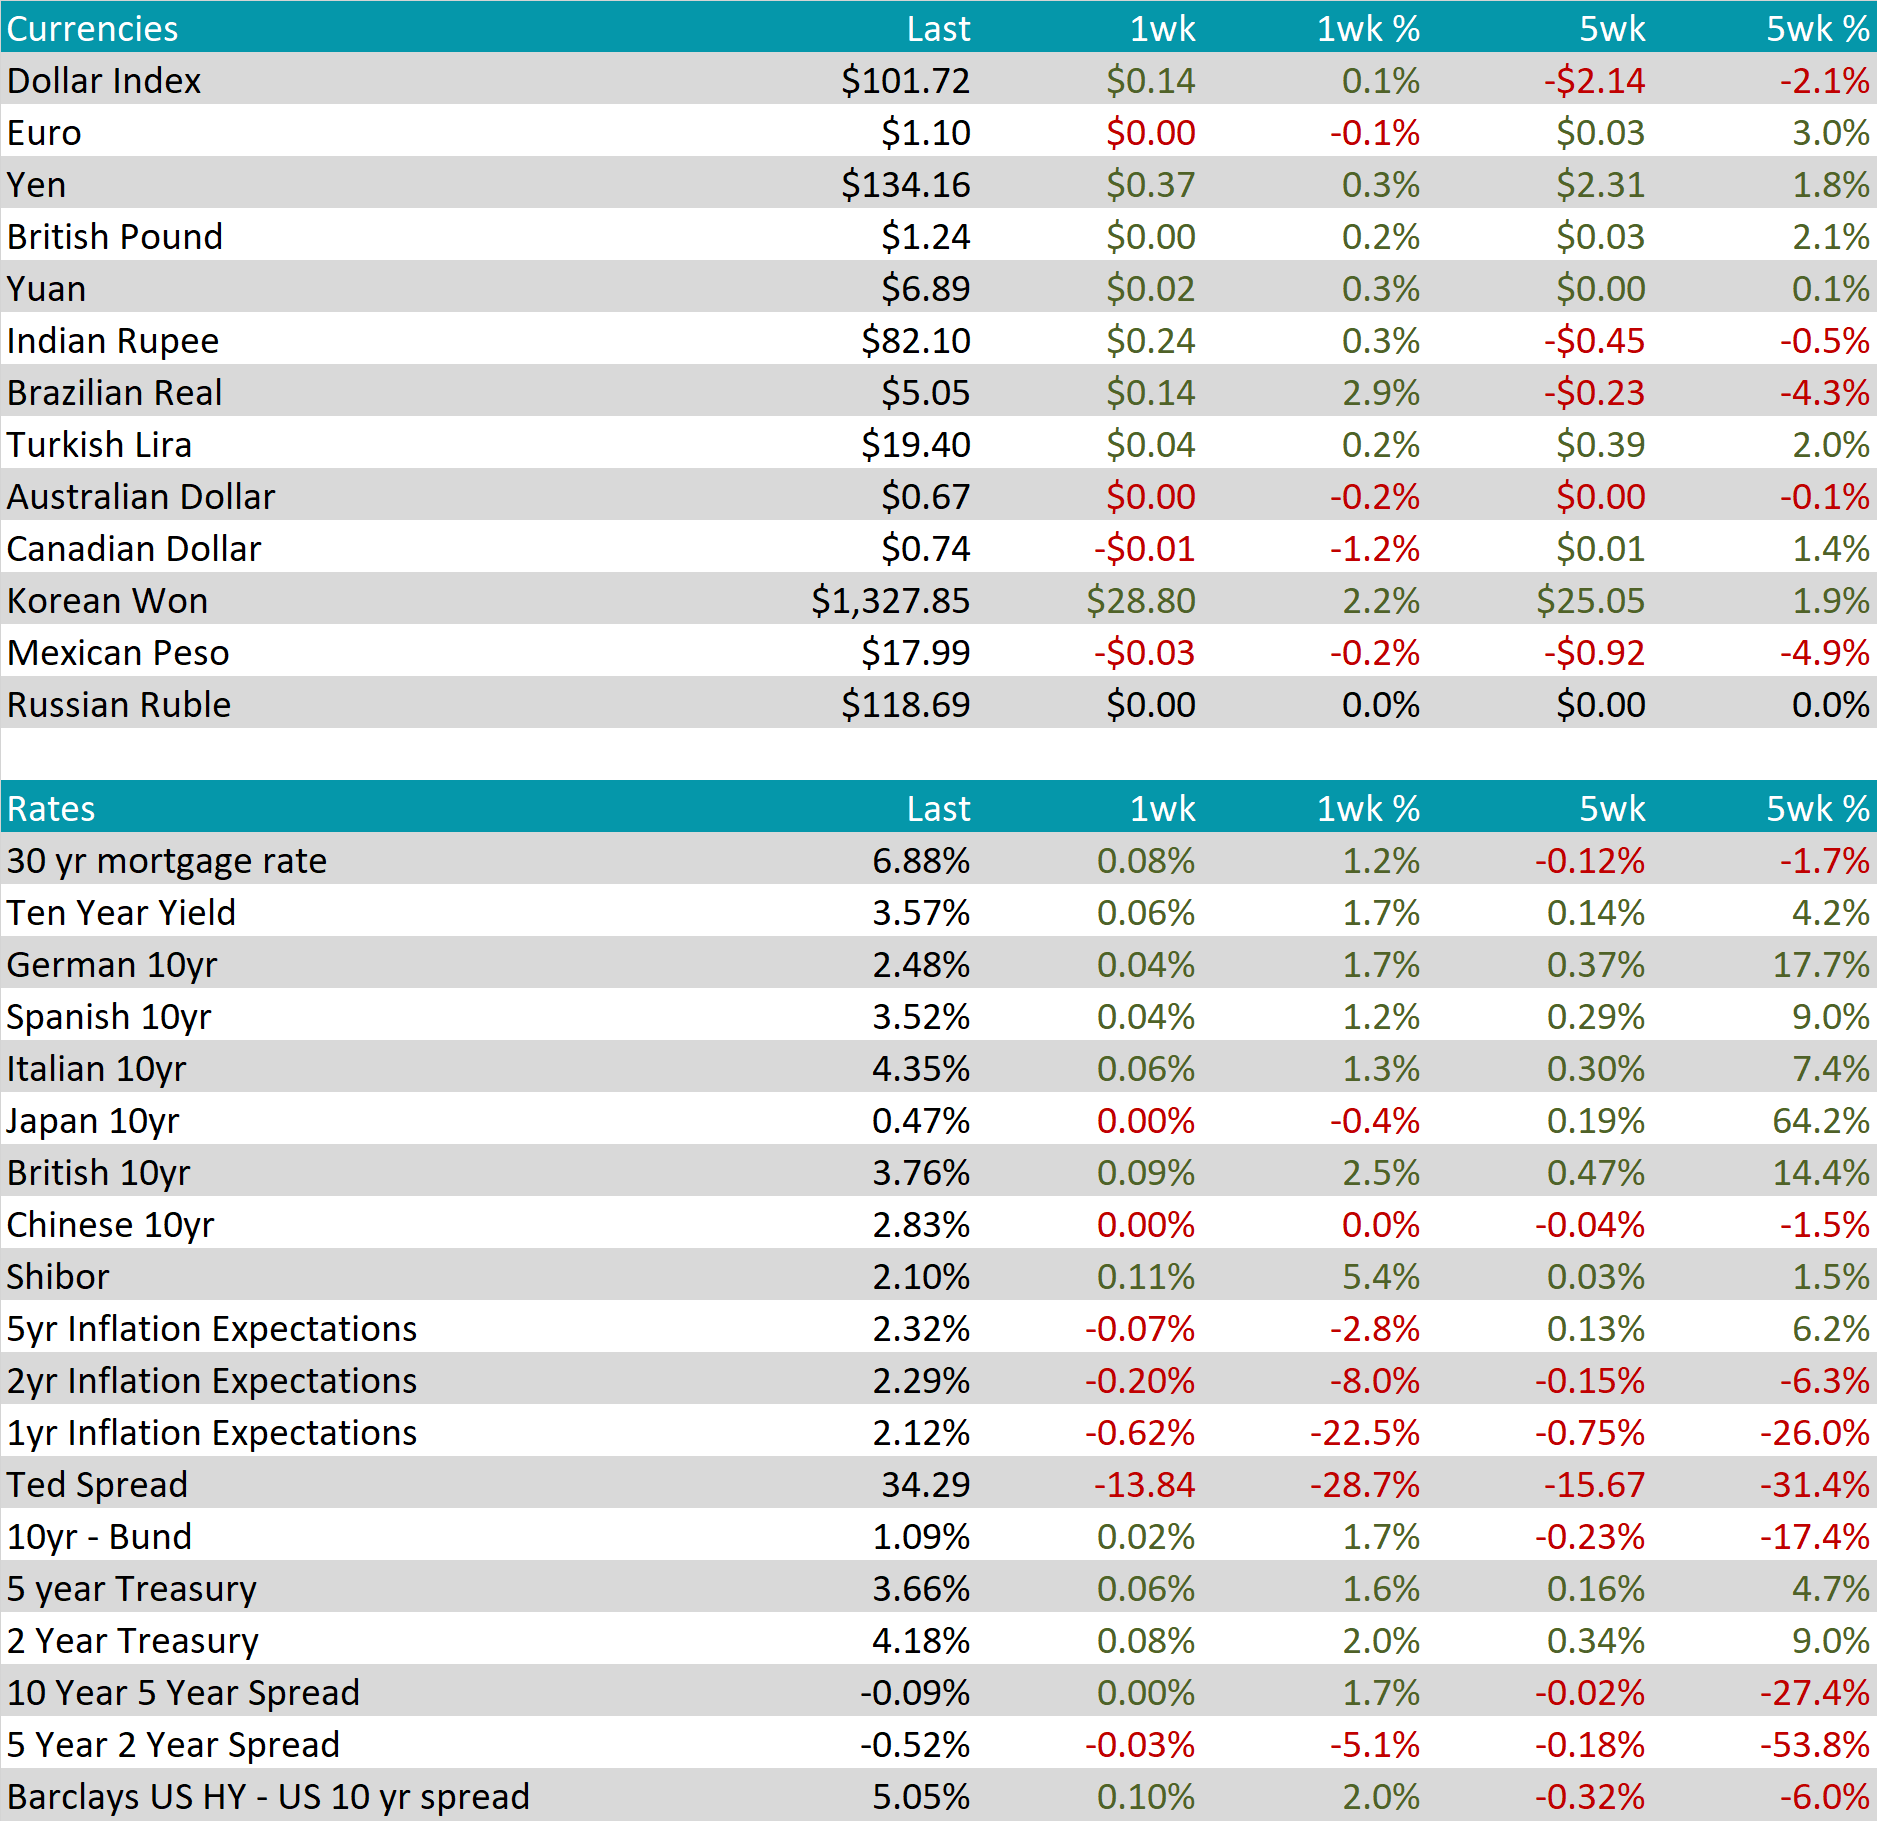
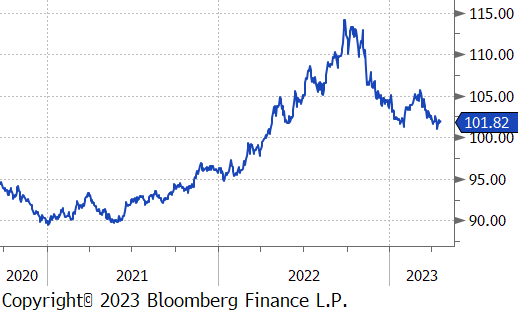
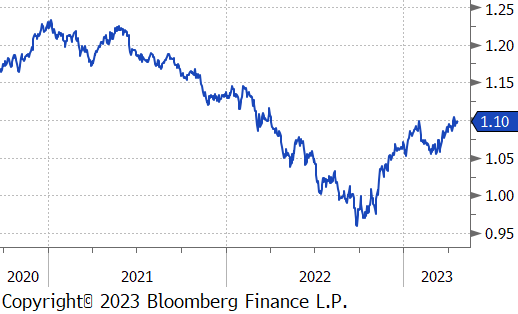
U.S. Dollar was up $0.14 to $101.72, but what was more interesting was the EURUSD exchange. After reaching a 12-month higher last week at 1.1075, it ended this week slightly lower, after the euro has failed to break through and holding just below this critical level. ECB bankers will likely hike rates at their May meeting, but investors remain uncertain by how much. Several members of the ECB spoke out in favor of a 50bps hike next month, a scenario the market weights with a 20% likelihood.
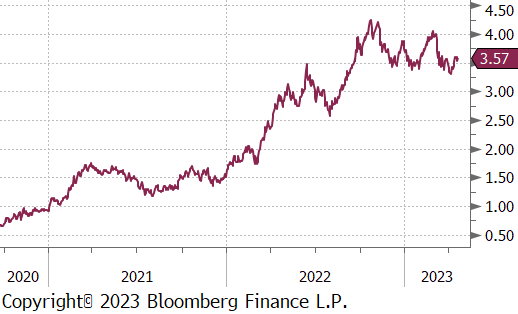
The US bond market saw an uncharacteristically calm week. The 10Yr Treasury yield consolidated around 3.6%. The US economy continues to present solid economic data, easing immediate concerns of rate cuts from the Federal Reserve. The market is currently pricing in a 25-bps rate hike next month, followed by a pause prior to cutting at the end of the year.
