Flack Capital Markets | Ferrous Financial Insider
October 20, 2023 – Issue #402
October 20, 2023 – Issue #402
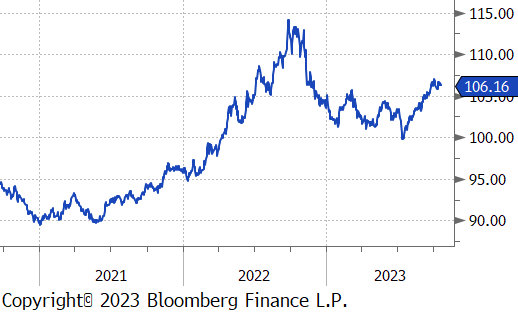
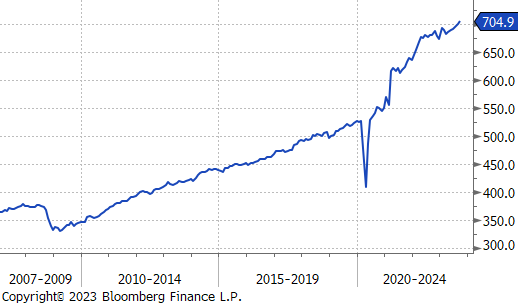
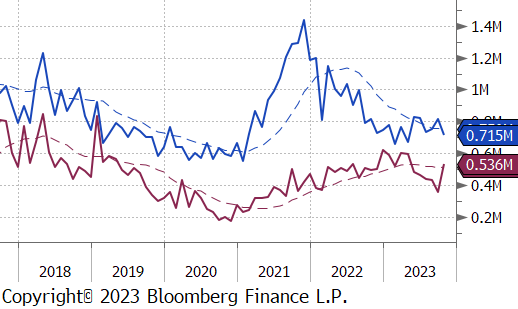
Since July, we have frequently commented on how economic data continues to beat consensus expectations to the upside. One of the more notable surprises came from retail sales, up 0.7% MoM, versus a 0.3% expected. The top chart on the right provides broader context of seasonally adjusted dollars spent (billions) since January 2007. The most important takeaway is the remarkable resilience of the consumer – after faltering around the end of last year and beginning of this year, we have now seen six straight months of increasing sales, five of which beat expectations.
While the direct impact on steel consumption is not entirely certain, the most notable implication from this strength is the direct relationship with GDP, which is now expected to come in around 4.5% for the 3rd Quarter. Further, the labor market continues to soften in an orderly manner, these factors combined suggests that interest rates will remain elevated for an extended period.
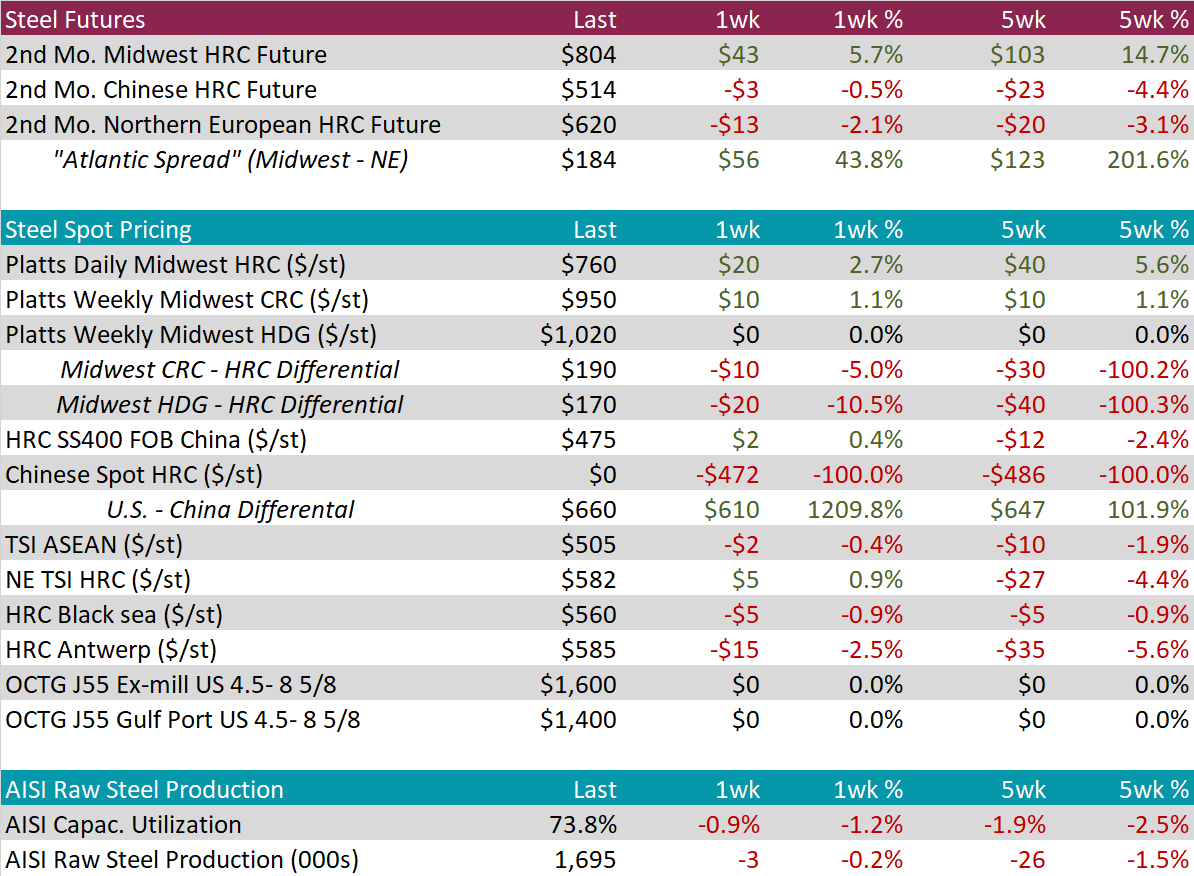
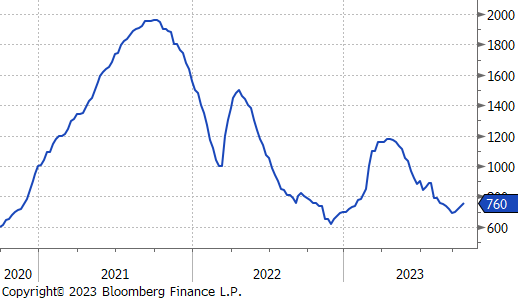
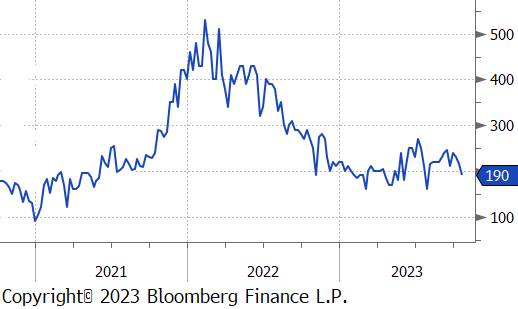
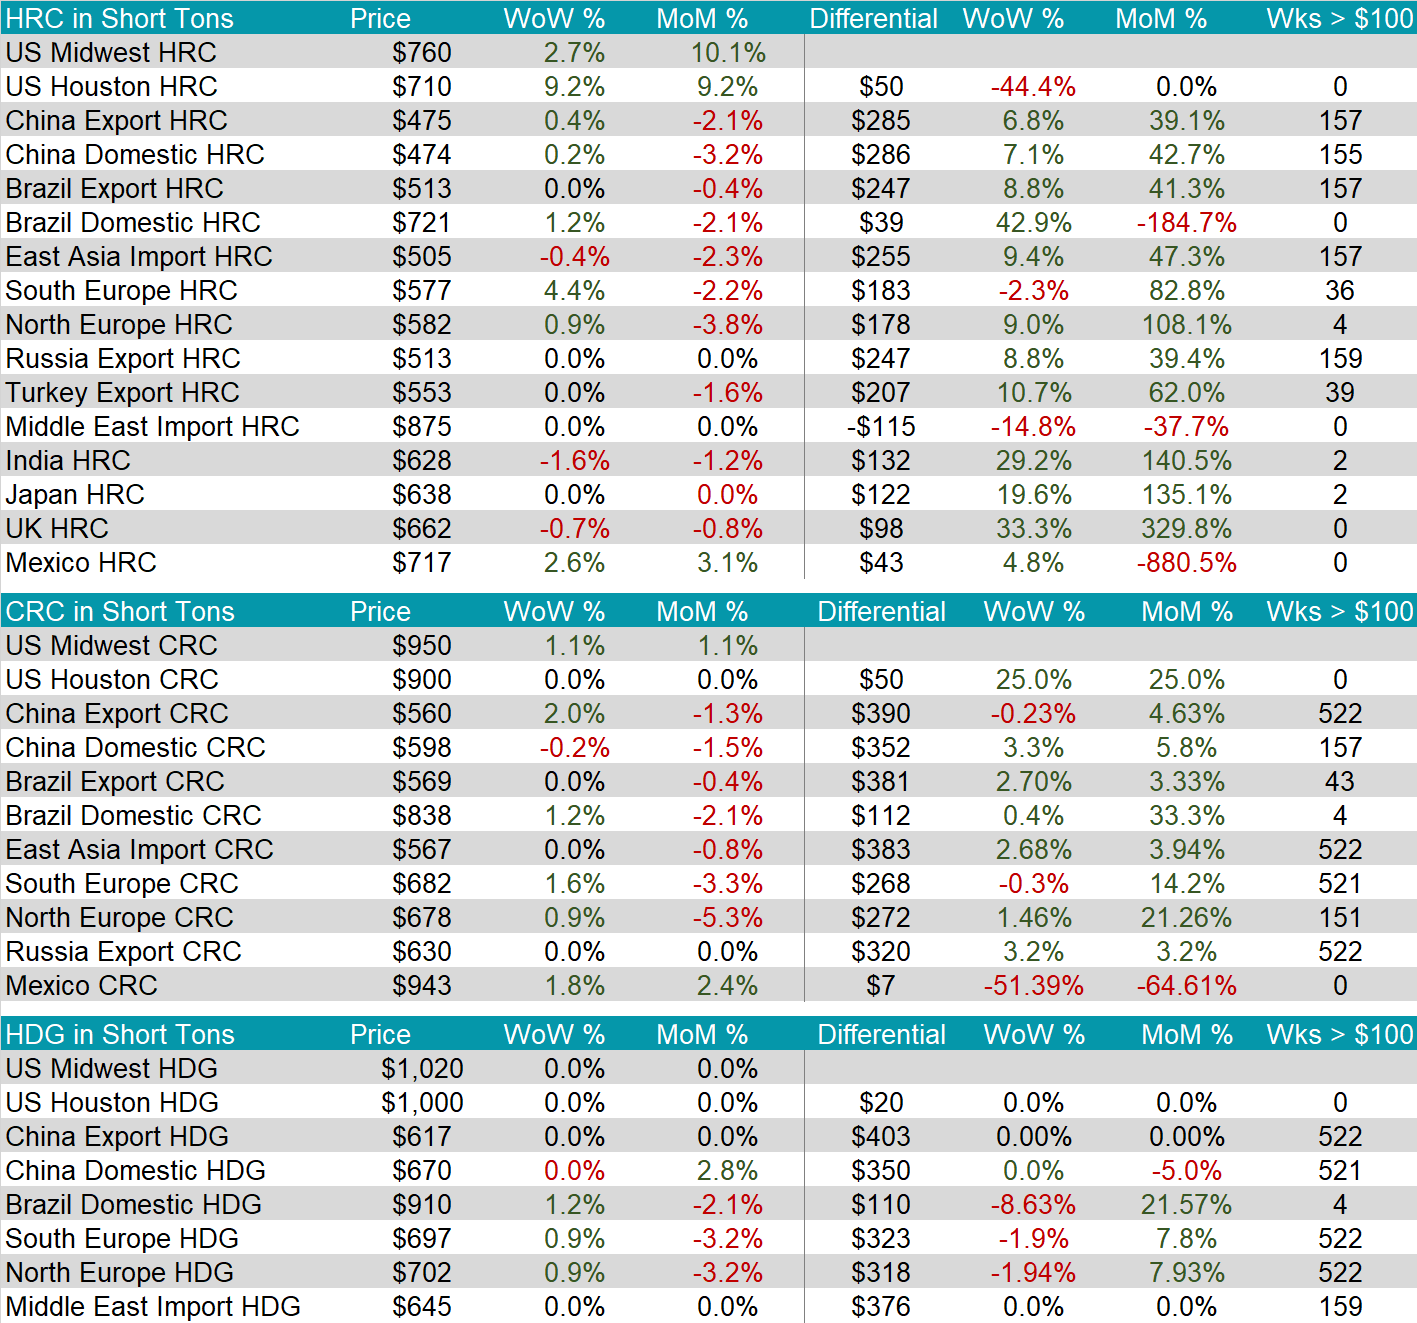
The HRC spot price increased by $20, or 2.7%, to $760. This marks the fourth week in a row of increases. Meanwhile, the 2nd month future rose to $804, up $43 or 5.7%.
Tandem products were both were mixed this week, with CRC increasing and HDG remaining unchanged, resulting in the HDG – HRC differential to decrease by $20, or -10.5%, to $170.
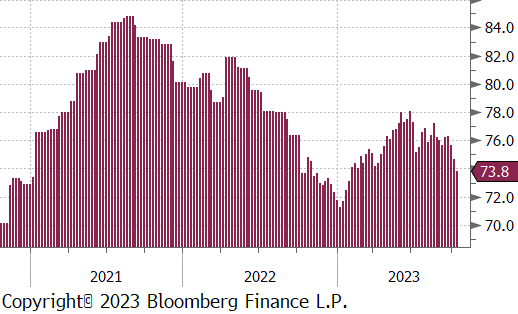
Mill production moved lower again this week, with capacity utilization decreasing by -0.9% to 73.8%. This movement more so solidifies that it is on a downward trend.
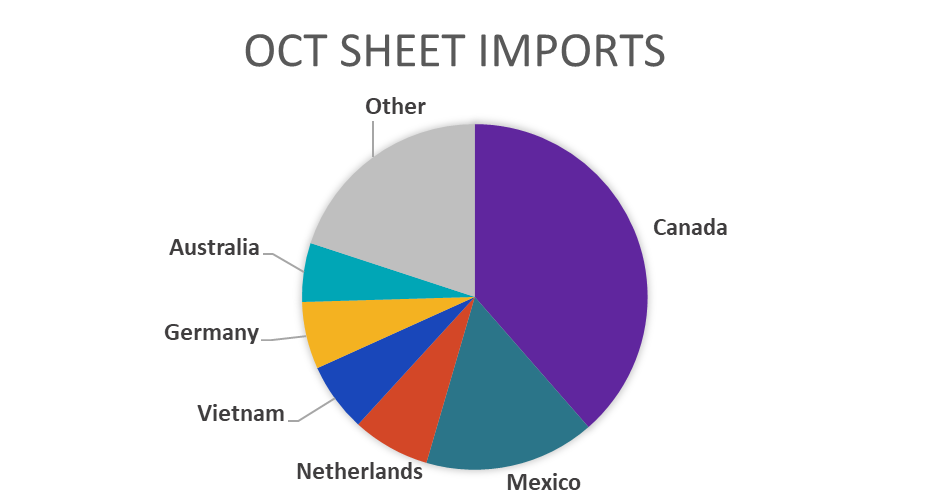
October Projection – Sheet 809k (down 79k MoM); Tube 425k (up 132k MoM)
September Projection – Sheet 765k (up 62k MoM); Tube 426k (down 68k MoM)
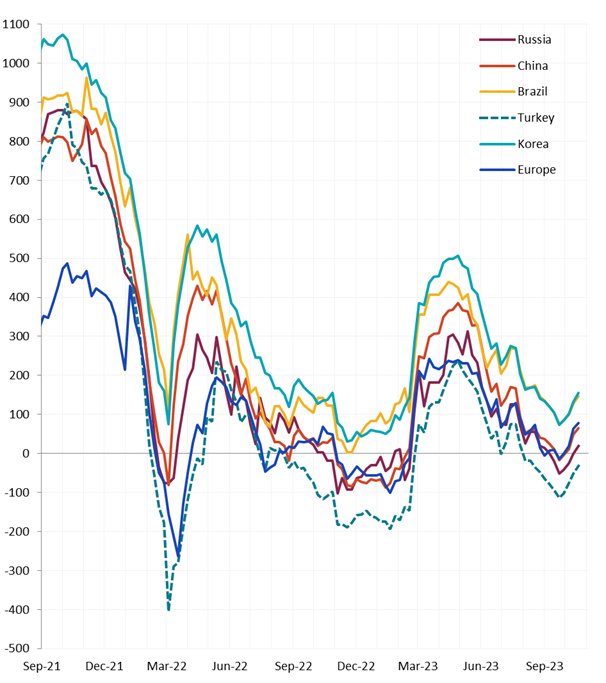
All the watched global differentials increased this week. The US Houston HRC also saw the highest percentage price increase, which was 9.2%, bringing to the price up to $710.
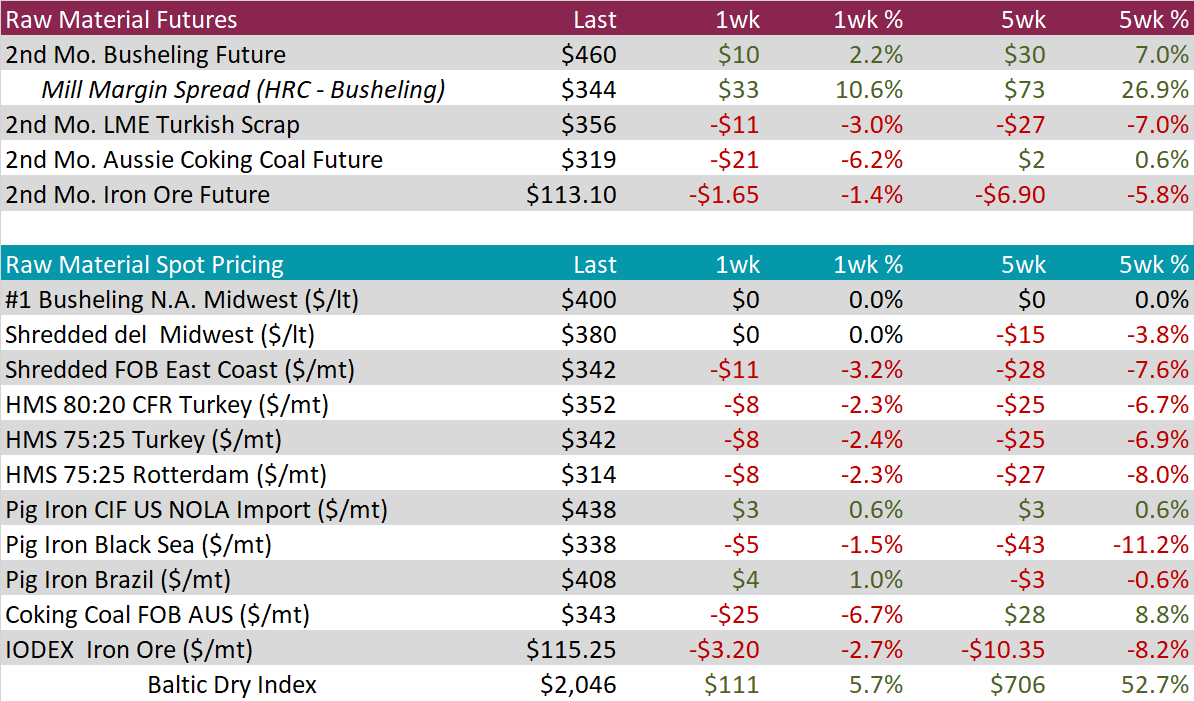
Scrap
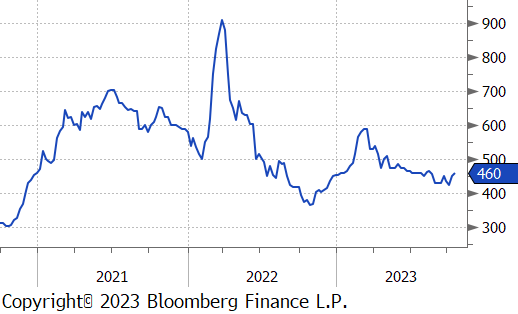
The 2nd month busheling future increased by $10, or 2.2%, to $460. This is the highest it has been since early August.
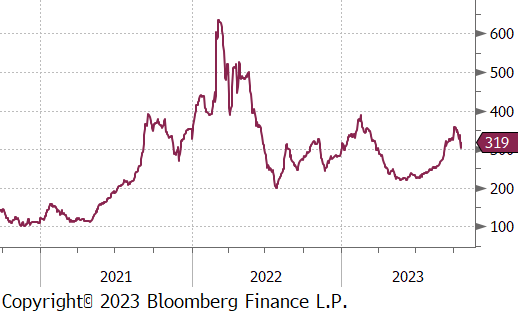
The 2nd month coking coal future declined again, this time by $21, or -6.2%%, to $319. This movement is congruent with last week, suggesting that it might be at the start of a downward trend.
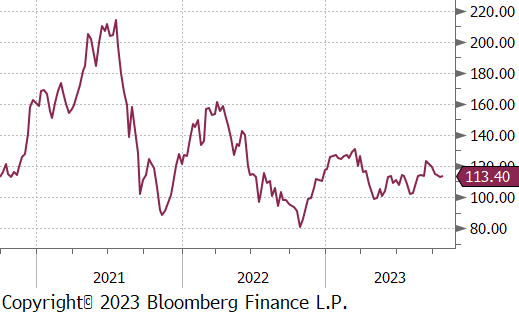
The 2nd month iron ore future decreased again, this week by $1.65, or -1.4%, to $113.10. This marks the BLANK week in a row of price decreases.
Dry Bulk / Freight
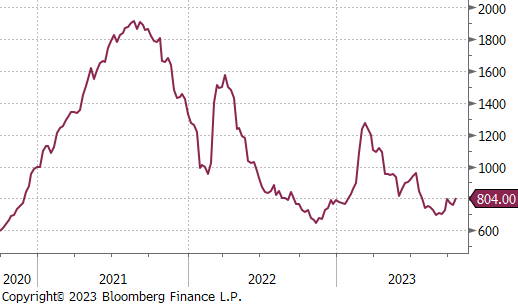
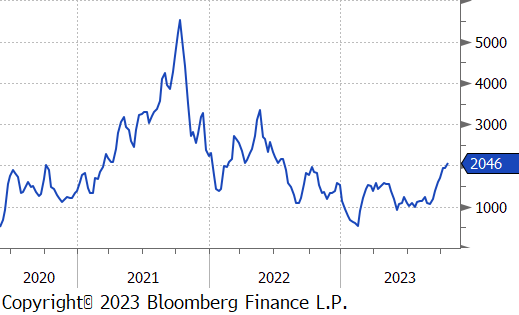
The Baltic Dry Index furthered its upward trend, this time increasing by $111, or 5.7%, to $2,046. This is the first time it has broken into the $2,000 levels since July 2022.
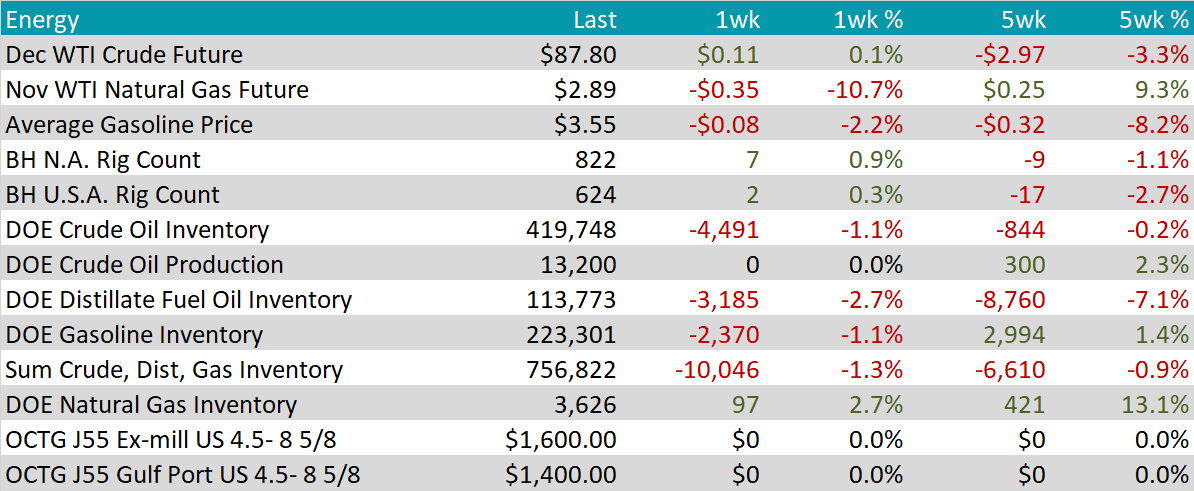
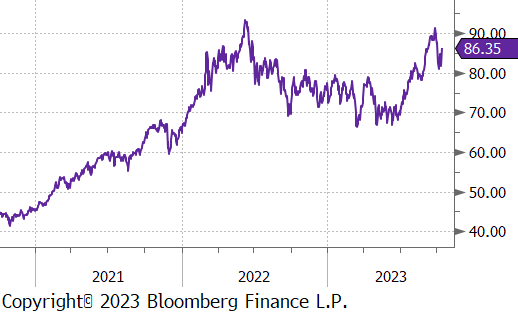
WTI crude oil future gained $0.11 or 0.1% to $87.80/bbl.
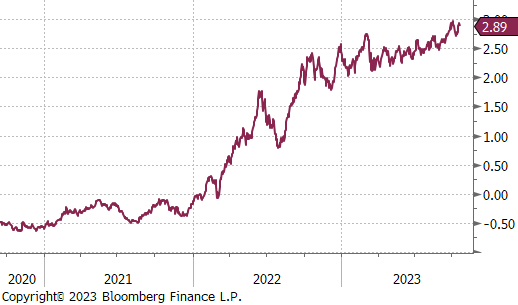
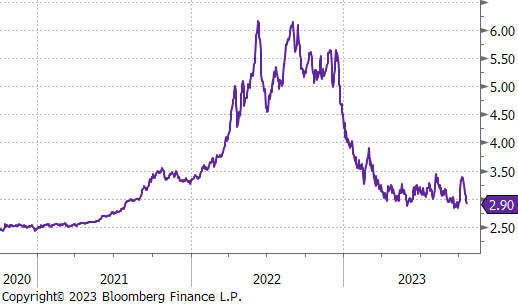
WTI natural gas future lost another $0.35 or -10.7% to $2.89/bbl.
The aggregate inventory level was down -1.3%.
The Baker Hughes North American rig count rose by 7, and the US count also increased but only by 2 rigs. This is the second week in a row of increases in rigs for both.

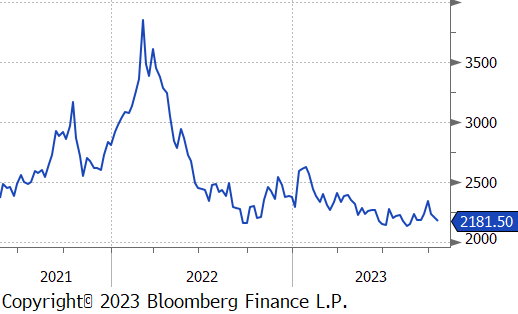
Aluminum futures dropped below $2,200 per ton, extending the decline from a five-month high of $2,347. This is due to concerns over a hawkish Fed and a slowing Chinese economy affecting industrial sentiment. Despite the fall, supply concerns have helped limit the extent of the downturn, with China limiting production expansion and Indonesia’s bauxite export ban posing a risk to output.
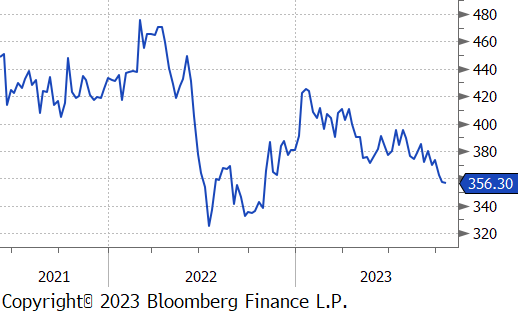
Copper futures fell to nearly one-year low due to concerns of lower demand and rising inventories. Factors include worries about higher US interest rates affecting industrial growth, financial issues with Chinese property companies, and a 50% increase in copper inventories in October. Despite short-term concerns, there are warnings of potential supply shortages in the long term, as projections show supply rising by only 26% by 2035, far below the expected 50% increase in demand.
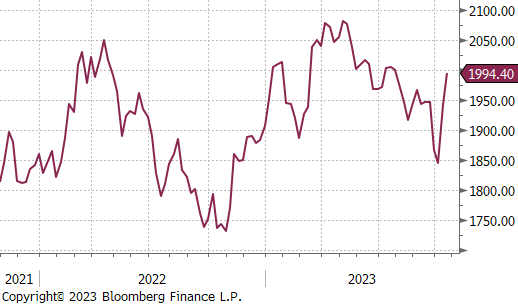
Following a waterfall decline into the first week of October, the price of gold has been rising relentlessly as war concerns have spread throughout the economy. The safe-haven metal is already approaching $2,000 levels, a new high since July 2023, up from $1,825 just two weeks ago. Gold is benefiting from macroeconomic factors as well as geopolitical ones, as the US Consumer Sentiment Index dropped lower than market expectations, increasing concerns about inflation expectations.
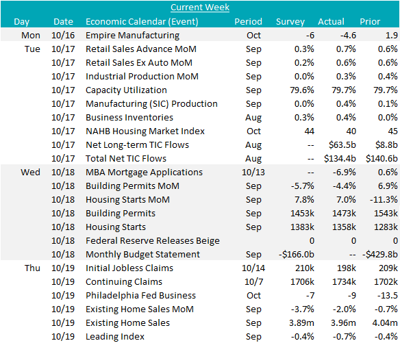
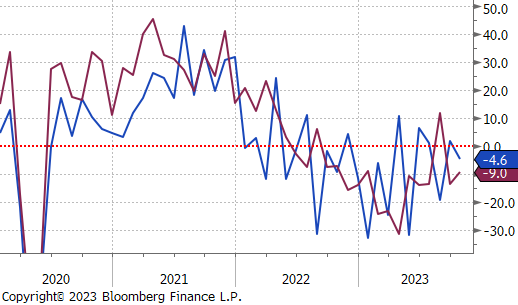
This week, two Fed Manufacturing surveys were published for the month of October. The Philadelphia Fed rose to -9 from the previous print of -13.5 in September but was below market expectations of -7. The Empire Manufacturing printed at -4.6, a decrease from the prior reading of 1.9 but was above market expectations of -6. Although these indicate that business activity edged lower this month, firms remain relatively optimistic about the six-month outlook.
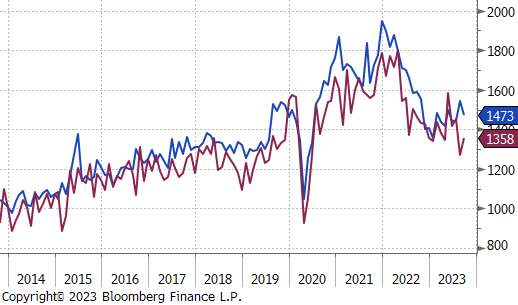
Building permits decreased by -4.4% to 1473k in September, down from August’s 10-month high of 1543k but exceeded market expectations of 1453k. The mix of this reading can be attributed to the rise in mortgage rates to multi-year highs impacting housing demand, buoyed by the ongoing shortage of available homes in the market. Conversely, housing starts rose by 7% to 1358k in September, rebounding from the three-year low of 1283k in August, but just missed the market expectation of 1383k. The biggest driver of this increase could be mostly attributed to the starts of units in buildings with 5 or more units jumping up by 17.1%, or 383k.
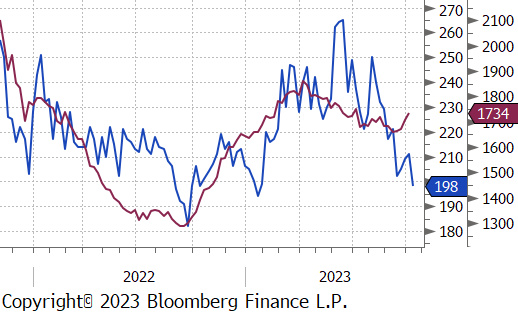
Initial jobless claims came in well below market expectations of an increase to 210k from the prior 209k reading. Instead, it dropped to 198k, hitting the lowest level since January, indicating that the labor market remains tight. On the other hand, continuing claims rose to 1734k from 1702k the previous week, hitting the highest level seen since July. This came in well above market expectations of an increase to 1706k. One can infer from this that those who have lost their jobs are potentially having a harder time finding new ones. Despite this, overall, the labor market continues to defy expectations and remain rather robust.
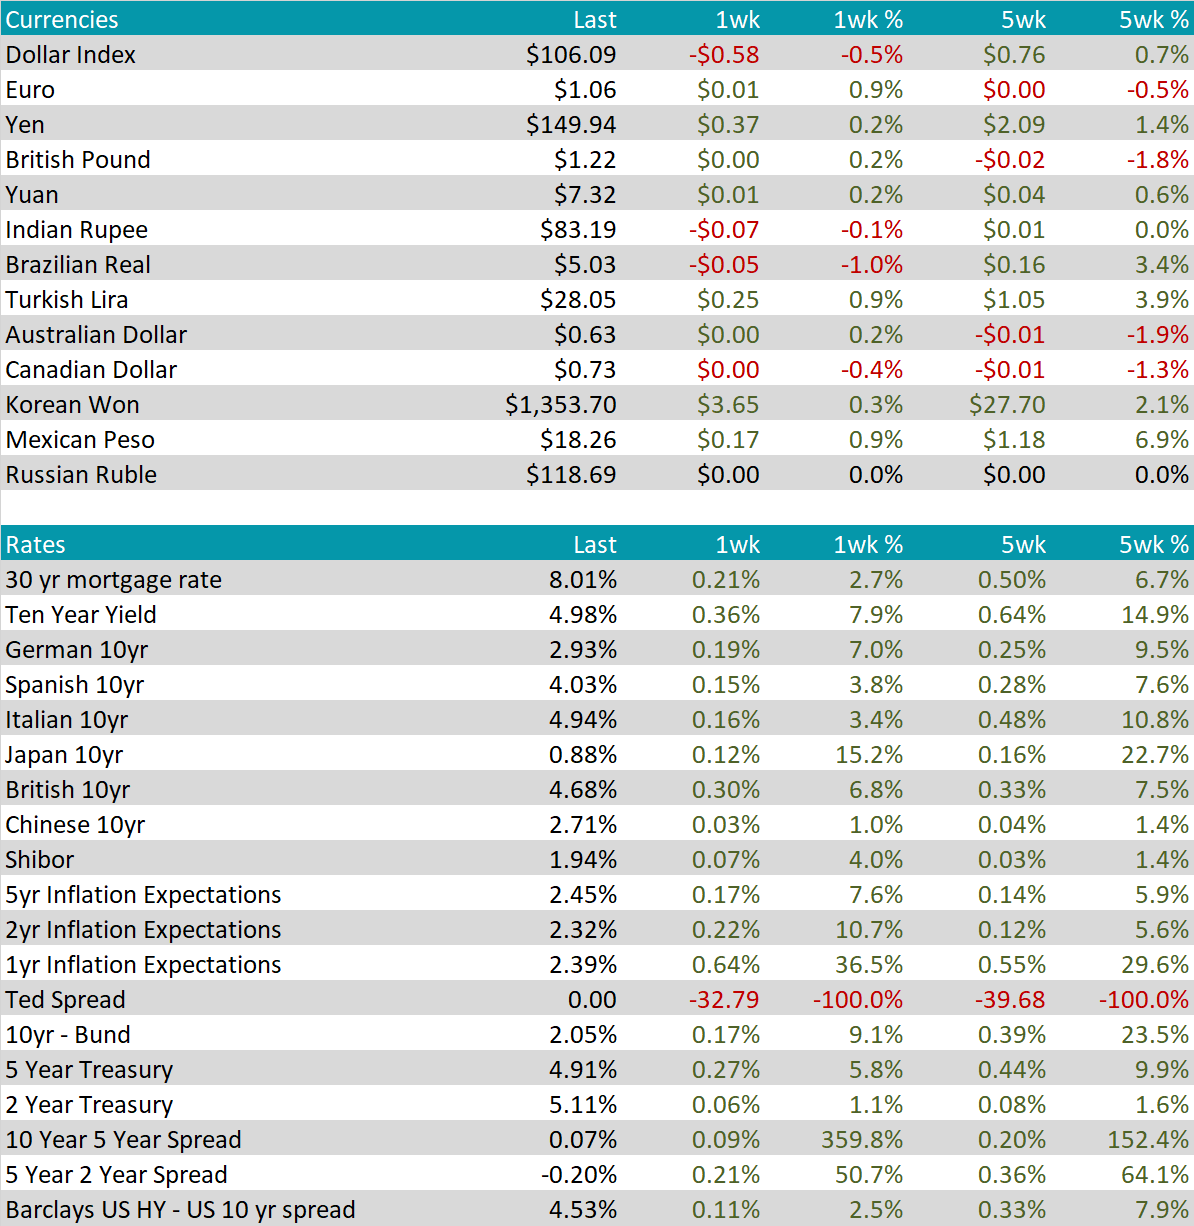
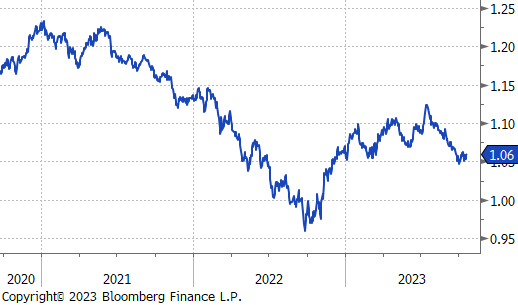
The Euro reached a four-week high of 1.05, with investors gearing up for the ECB rate decision. Notably, the ECB has raised rates in ten consecutive meetings. Recession risks and persistent inflation have raised concerns in the Eurozone, where grappling with core inflation has been more challenging than in the US.
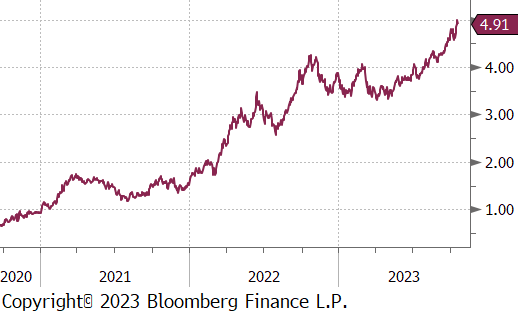
Following its first surge to 5% since 2007, the US 10-year yield pulled back to 4.91%. Investors are carefully assessing the likelihood of prolonged higher interest rates. Additionally, concerns about government budget deficits and the impact of the Israel-Hamas war have intensified, leading to extreme volatility in the US bond markets. Many Federal Reserve officials emphasized the Fed’s commitment to combating inflation while proceeding cautiously based on incoming data during last week’s discussions.
The German 10-year yield concluded the week at 4.91%, showing a pullback from a recent high of 2.968%. This trend mirrors the movement in US treasuries. The ongoing Israel-Hamas conflict continues to inject volatility into the rates market as we approach the ECB rate decision on Thursday, October 26th. Market expectations are leaning toward the ECB maintaining rates at their current levels.