Content
-
Weekly Highlights
- Market Commentary
- Risks


Over the last month, HRC prices, and the future curve, definitively moved lower with limited spot transactions occurring in the physical market, as this report has discussed. However, another dynamic occurring in the market that has led to price uncertainty is the wide dispersion of transaction prices. The willingness of certain mills to hold higher price while others negotiate and accept lower prices can be explained by their expected profits. The move lower in steel prices coincides with a decline in scrap prices. Below is a chart of the rolling second month HRC future price (orange) and the rolling second month Busheling future price (white) since the beginning of the year.
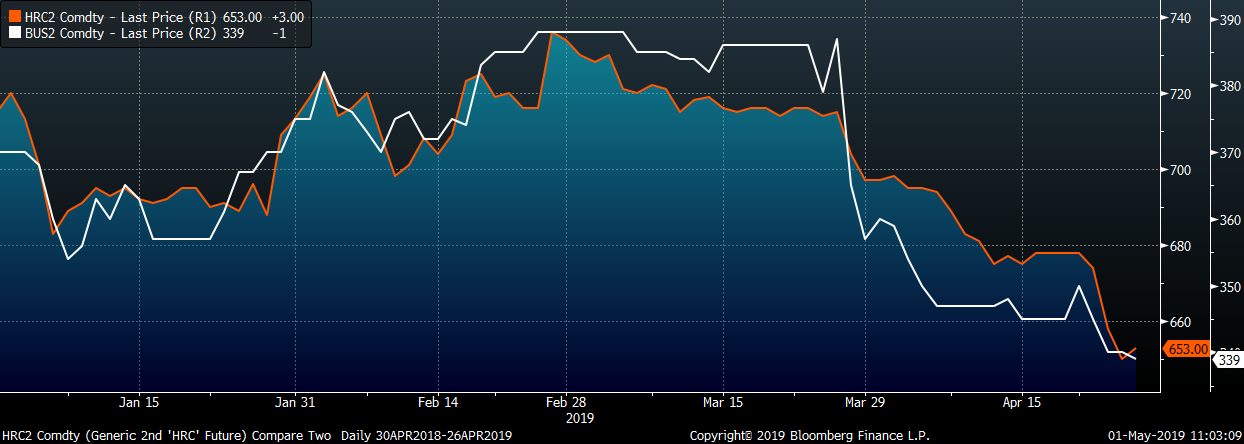
There is a noticeable correlation between their prices, and the scrap price has led the HRC price lower over the last month. Mini mill’s are more inclined to negotiate at lower prices because their profits are maintained if scrap prices also decline. Our modeling and analysis of producer profits shows an EAF’s profit per ton remaining firmly at or above $180/ton so far in 2019. However, BOF’s profits have steadily declined year to date, falling below $115/ton, and explaining their reluctance to lower spot prices. As more tons are shifted and purchased at lower prices, the incentive to continue production of lower margin tons decreases. However, until production is completely removed by integrated mills through outages or idling furnaces, this supply will weigh on prices, adding to the 2018 inventory overhang that is still working through the market. Additionally, integrated mills will continue to follow mini mills and physical spot price transactions lower.
While the above market dynamics are currently controlling the market, the strength in iron ore and global HRC prices must be monitored. Import levels continue to be low, although quotas, instead of tariffs, have allowed Korea to offer lower delivered pricing, and Brazil to send high amounts of semi-finished material at the beginning of the year. As quotas are reached, these offers will disappear and create the risk of significantly higher prices.

Below are the most pertinent upside and downside price risks:
Upside Risks:
Downside Risks:

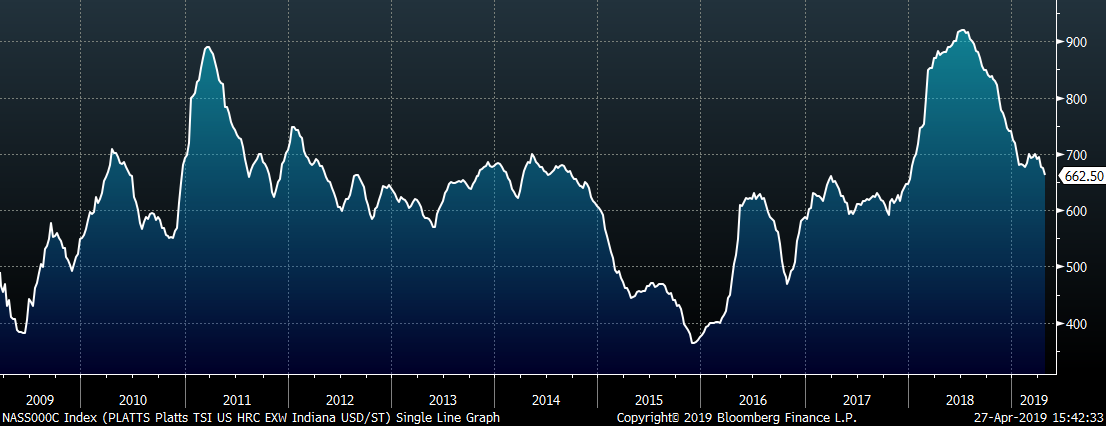
The Platts TSI Daily Midwest HRC Index was down $13 to $662.50.
The CME Midwest HRC futures curve shown below with last Friday’s settlements in white. The curve moved lower and flattened dramatically WoW.

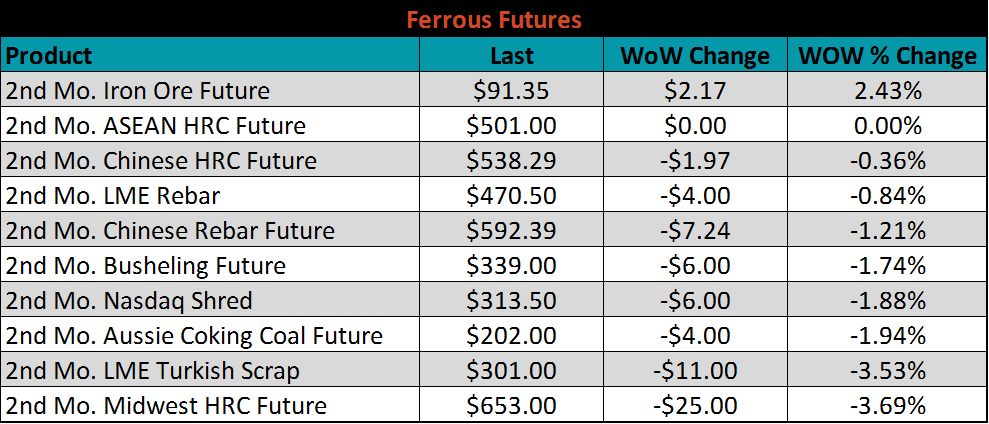
June ferrous futures were mostly lower. Iron ore futures gained 2.4%, while Midwest HRC futures lost 3.7%.
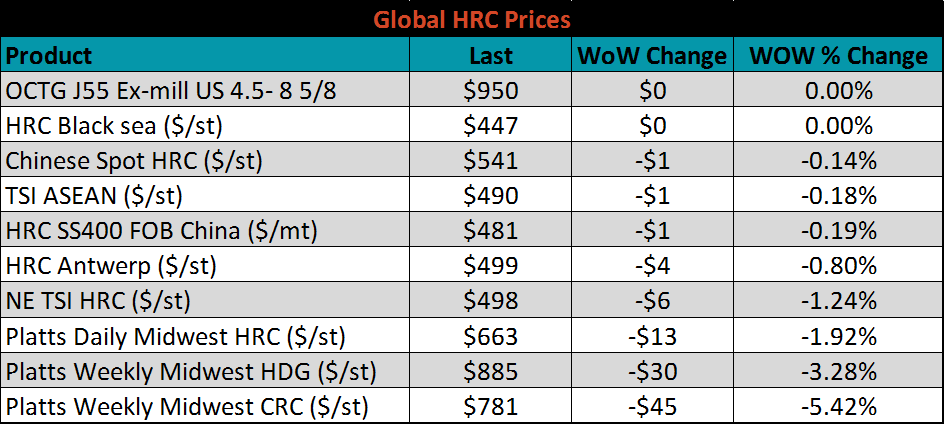
The global flat rolled indexes were mostly lower led by Platts Midwest CRC, HDG and HRC prices, down 5.4%, 3.3% and 1.9%, respectively.
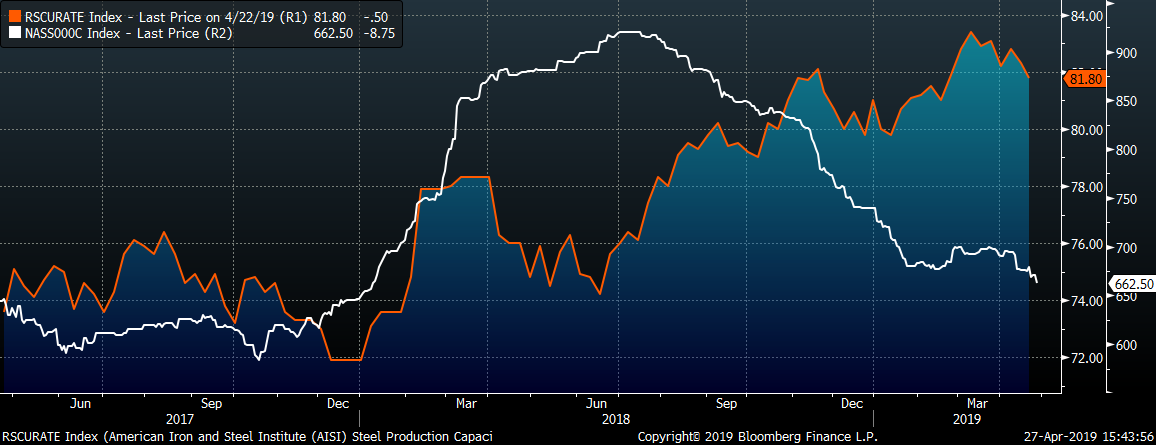
The AISI Capacity Utilization Rate is down 0.5 points to 81.8%. The Trump administration’s goal of 80% Capacity Utilization Rate has held since October 2018.


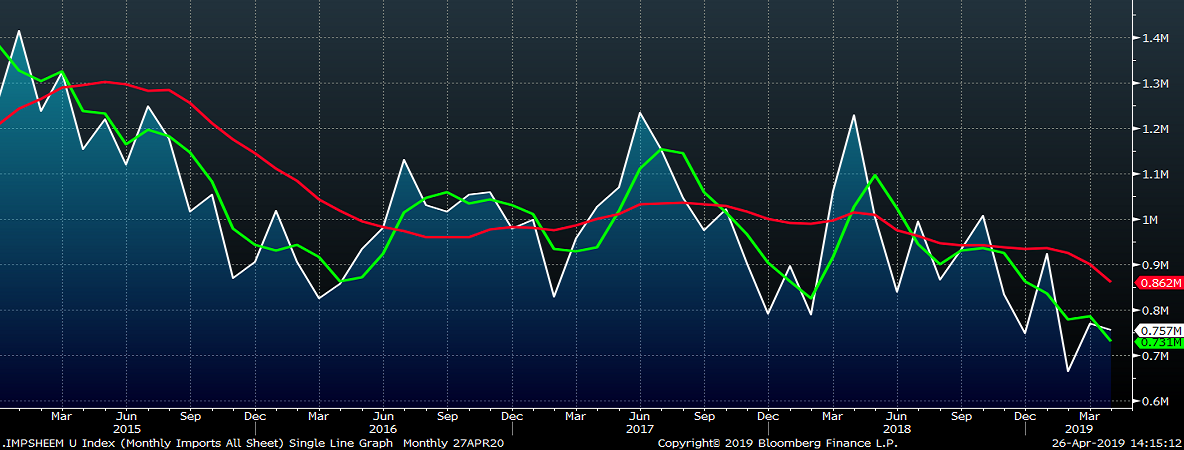
April flat rolled import license data is forecasting a decrease to 757k, down 13k MoM.
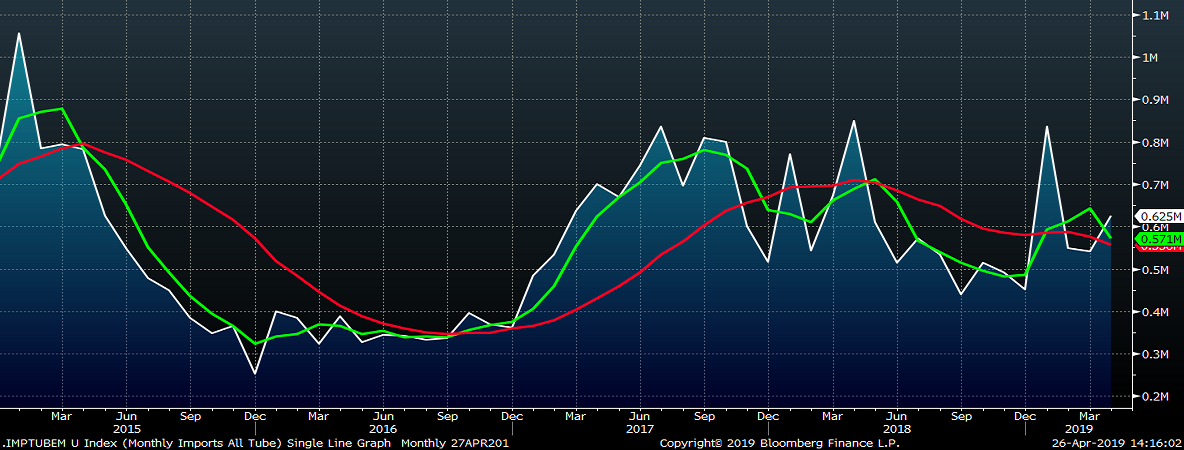
April tube import license data is forecasted to increase 83k to 624k tons after March fell slightly.
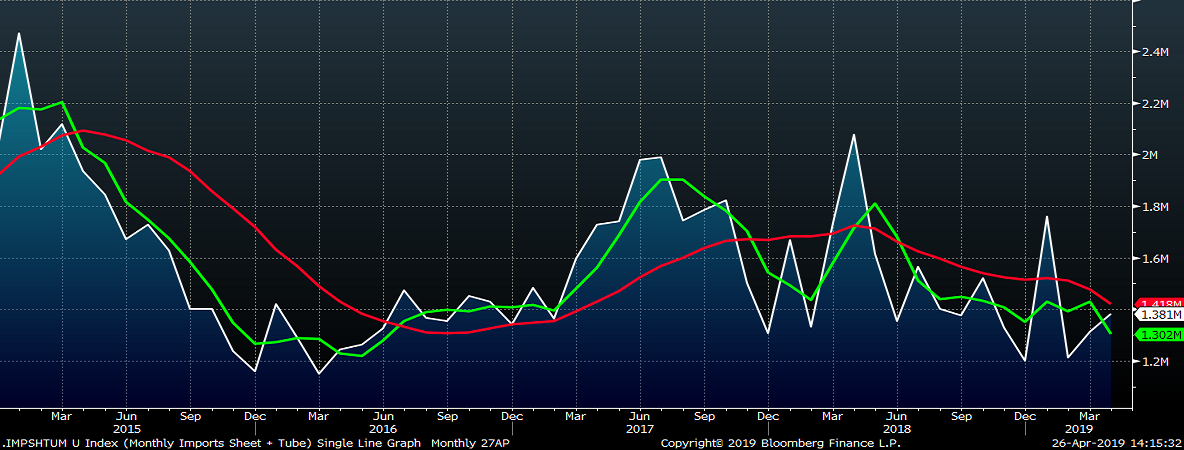
AZ/AL import licenses forecast a decrease of 20k to 47k in April.
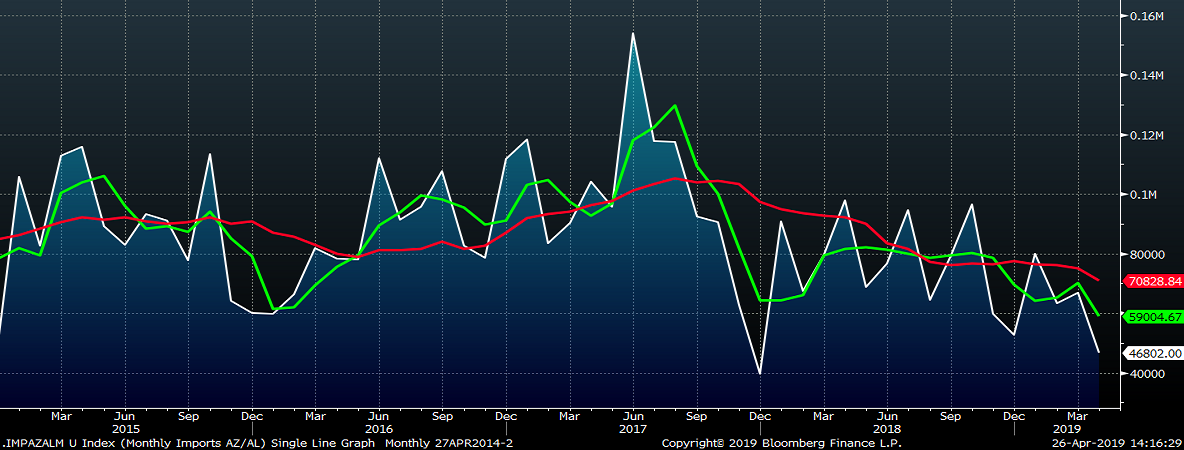
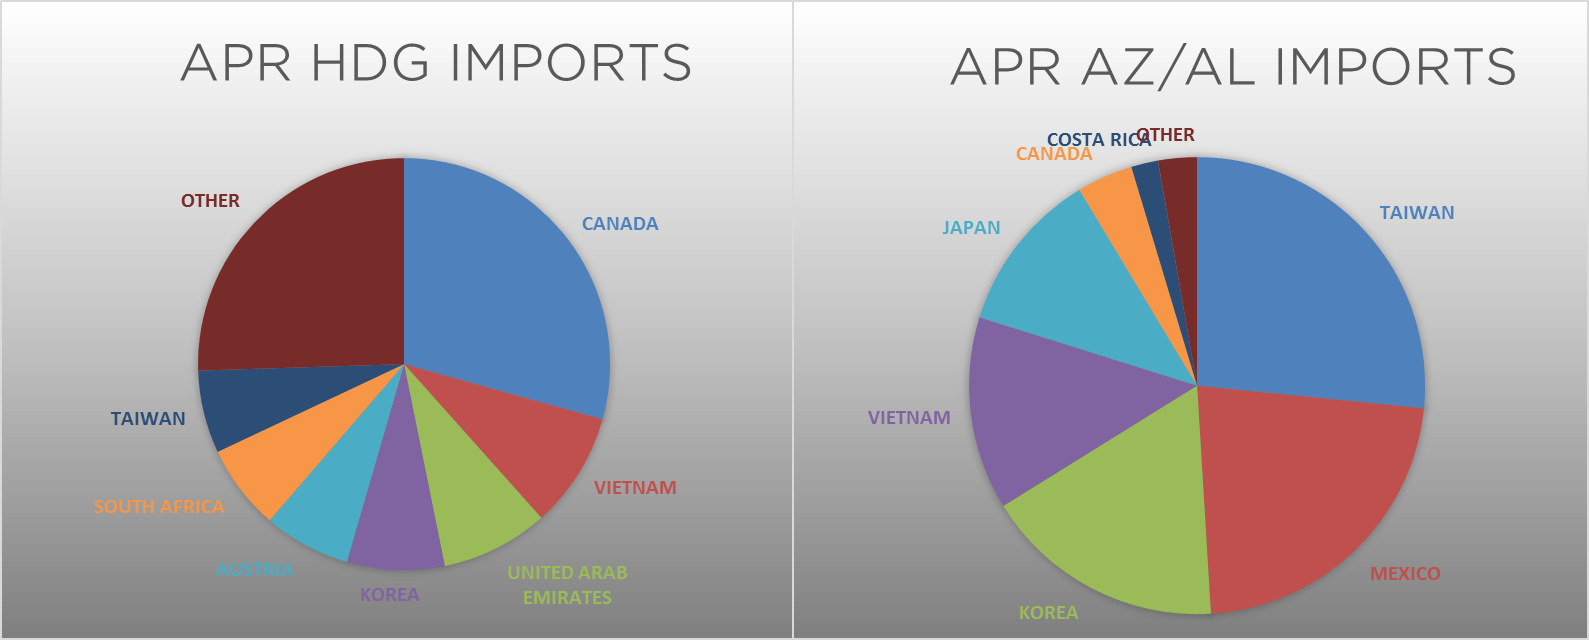
Below is April import license data through April 23, 2019.

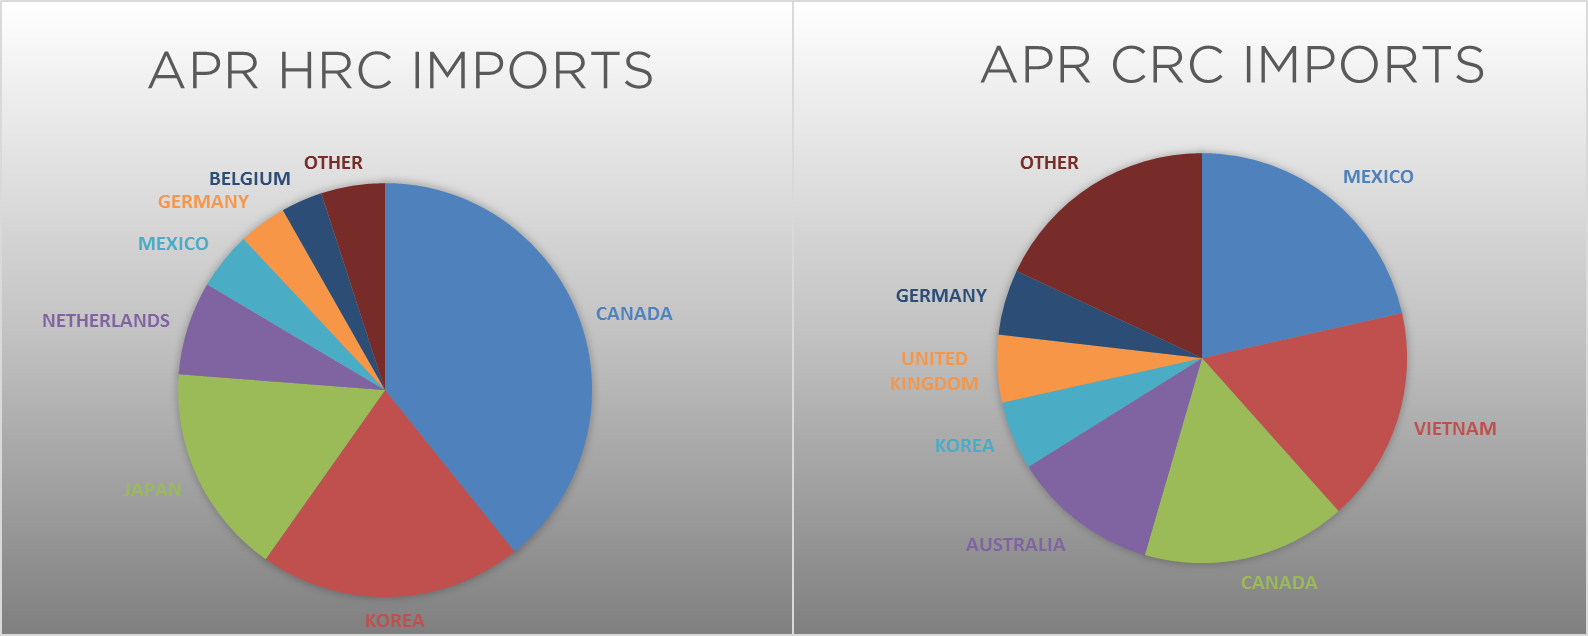

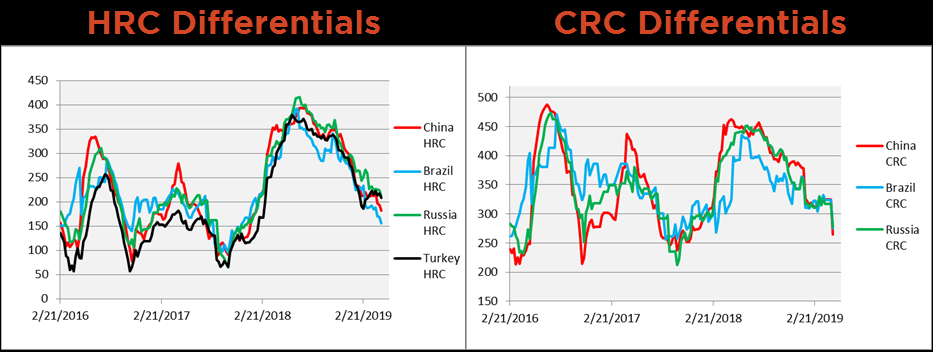
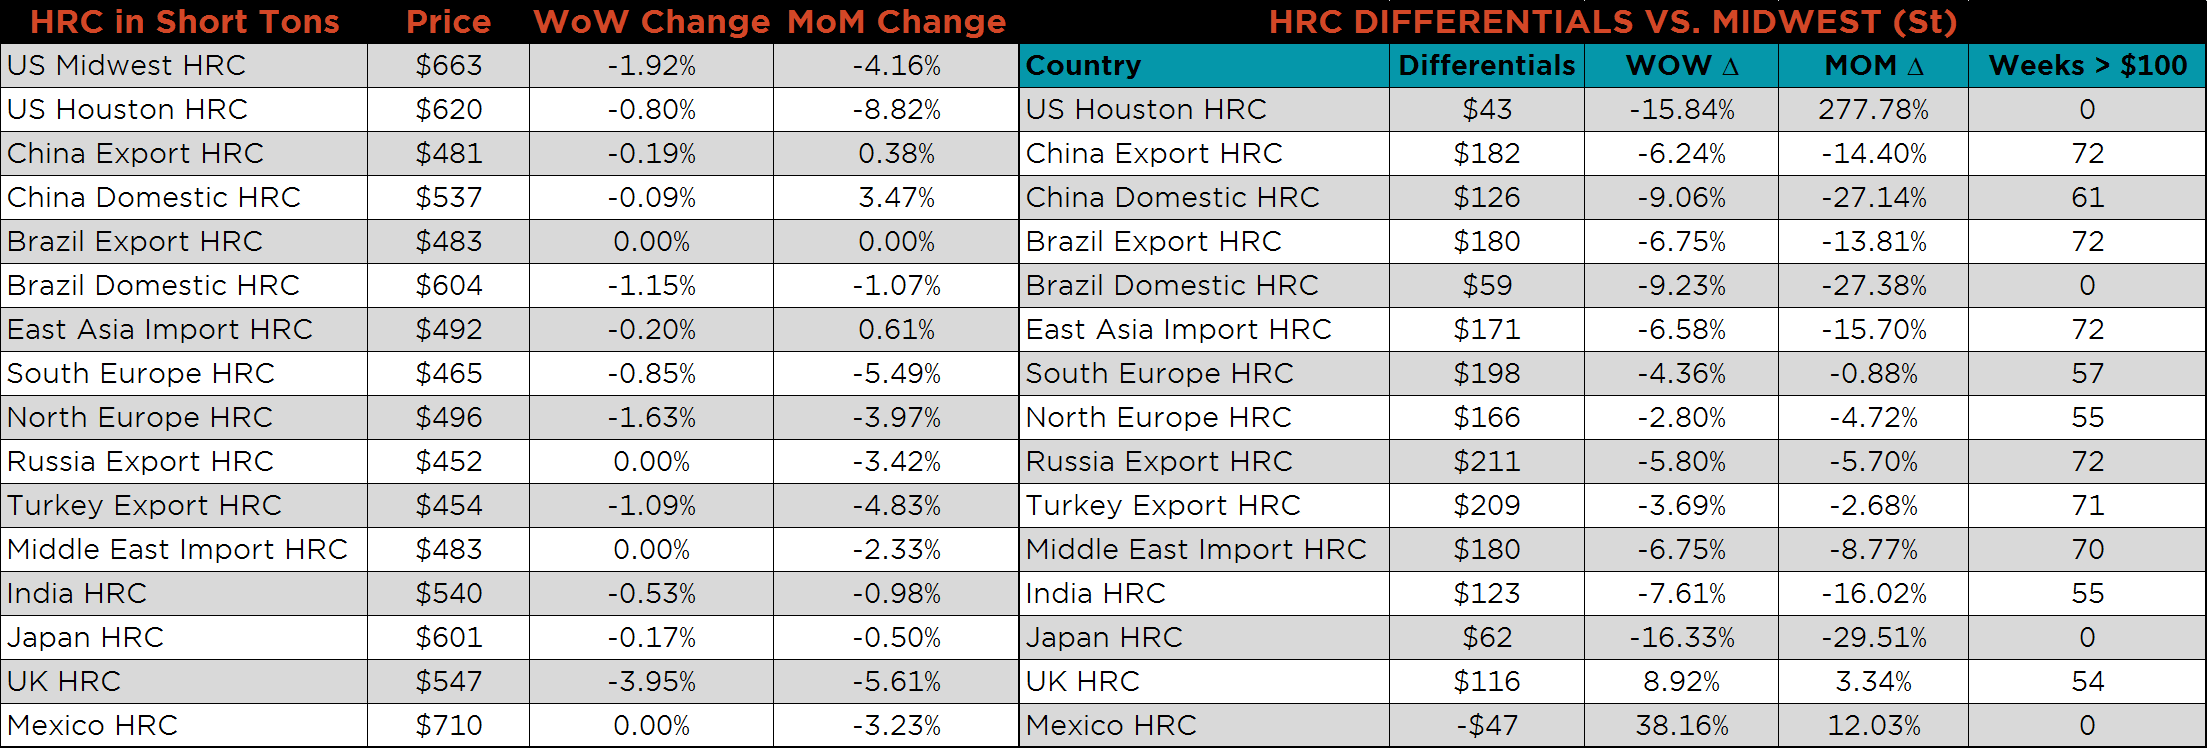
Below are HRC and CRC Midwest vs. each country’s export price differentials using pricing from SBB Platts. All of the differentials moved lower WoW, but the CRC differentials experienced a steep drop after the Platts Midwest CRC price fell by $45!
SBB Platt’s HRC, CRC and HDG pricing is below. As mentioned above, Midwest CRC, HDG, and HRC prices saw the most significant changes of the week. Houston CRC was also down 5.1% while UK HRC was down 4%.


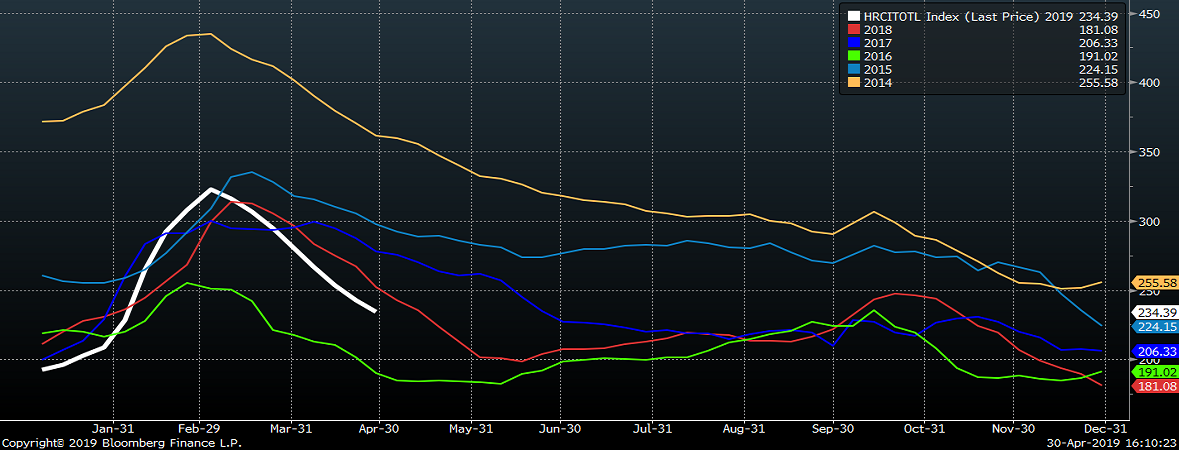
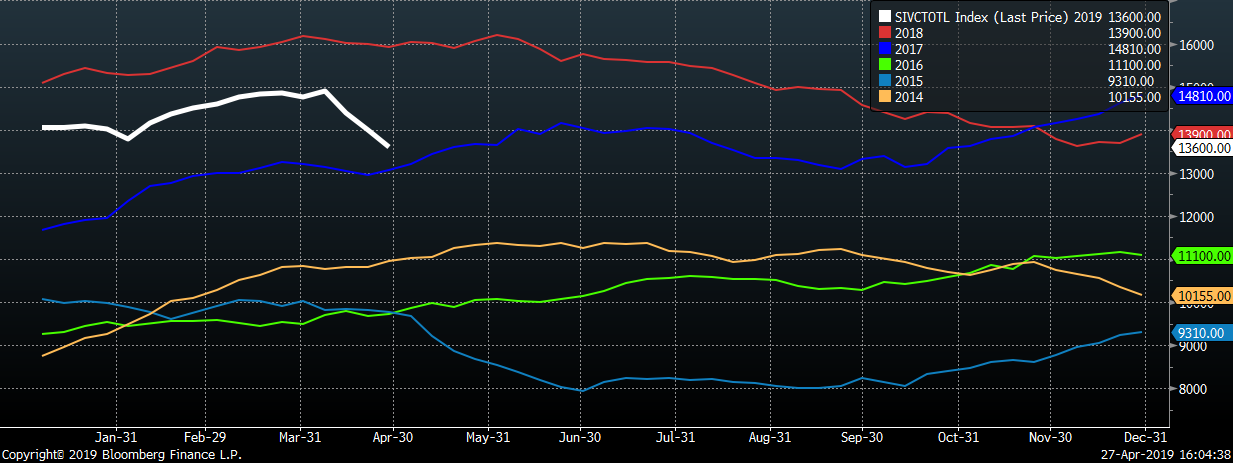
Below are inventory levels for Chinese finished steel products and iron ore. Inventory levels continue to move lower across the board. Iron ore ports inventory continue to decline and the HRC inventory level is still at the lowest level in the last 5 years, with the exception of 2016.


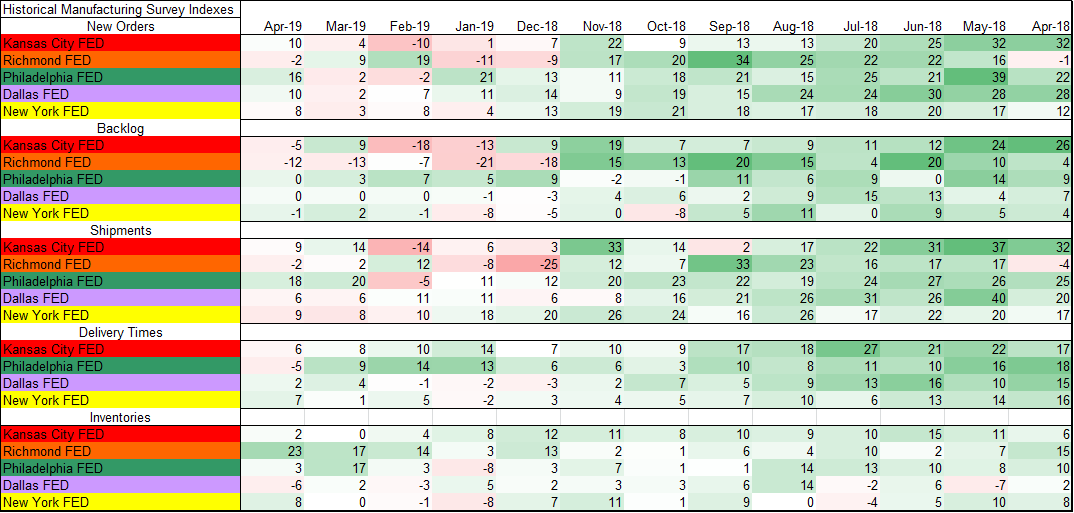
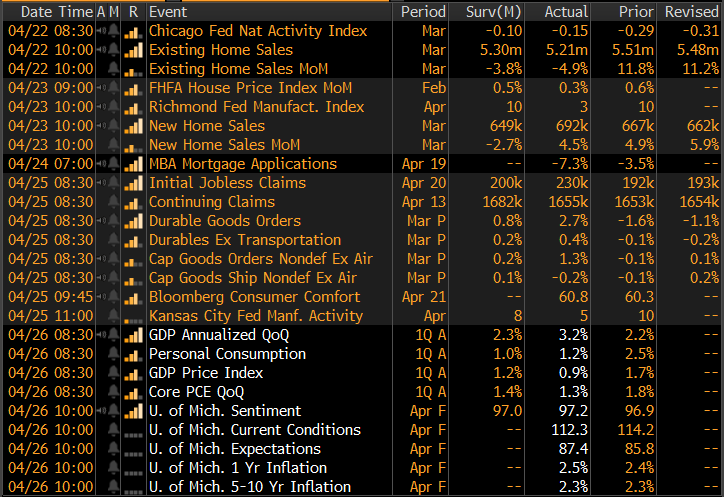
The chart below pulls sub-index data (new orders, backlog, shipments, delivery time and inventories) from regional FED manufacturing reports and compares each monthly reading to historical data of the previous 15 years. The darker green implies better than average, red implies worse than average, while white depicts average readings for each sub-index category. After an especially good 2018, December readings signaled weakness in the manufacturing industry. The first quarter of 2019 felt the reverberation of the December printings and left the industry in a “wait and see” position. Last week’s advanced estimate for first quarter GDP was strong at 3.2% and consensus above expectations. This should be encouraging for those who were worried about a prolonged economic or manufacturing slowdown.
To the right is the remainder of the economic data.


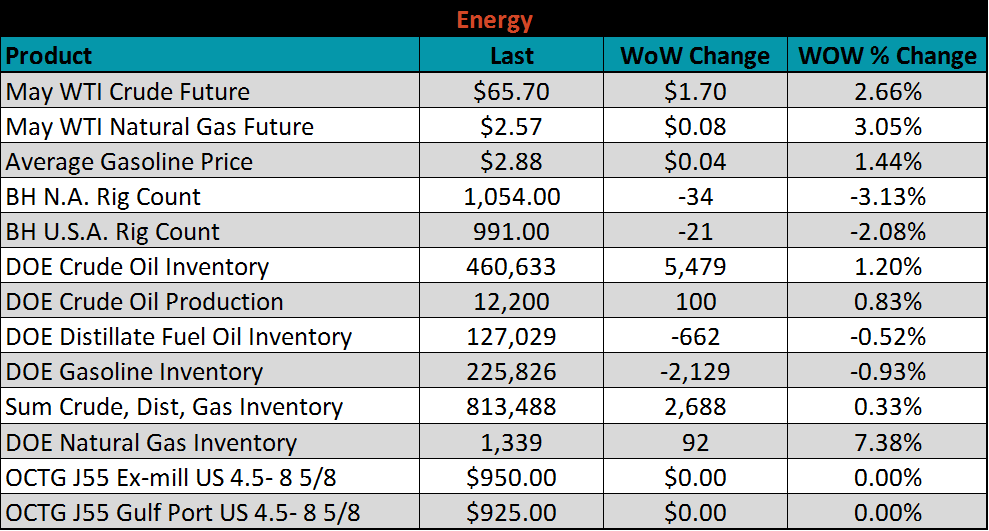
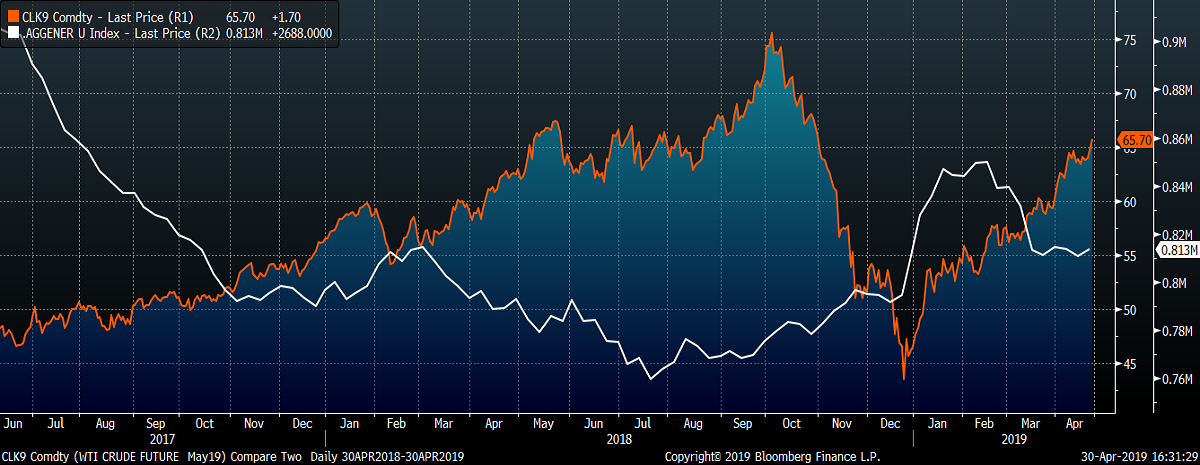
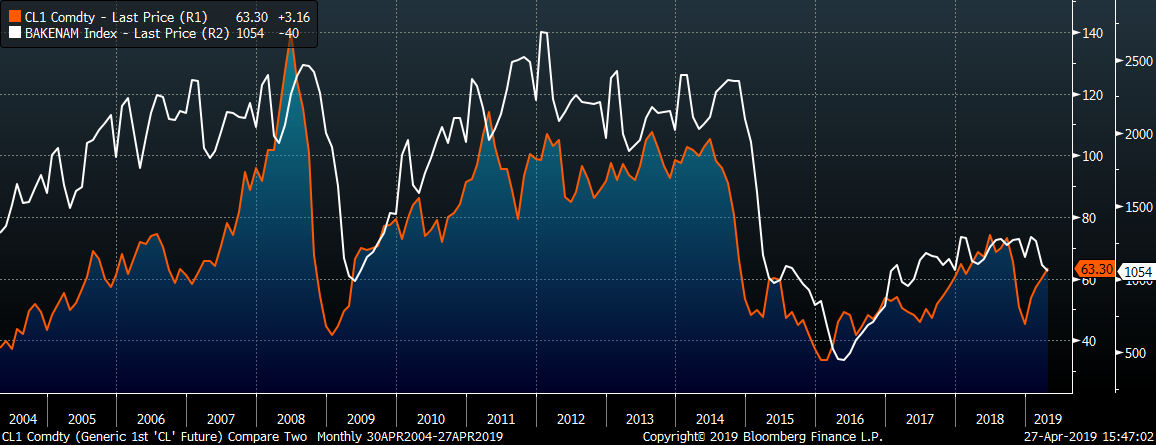
Last week, the May WTI crude oil future gained $1.70 or 2.66% to $65.70/bbl. The aggregate inventory level was slightly higher 0.3%. Crude oil production rose back up to 12.2m bbl/day. The U.S. rig count lost twenty-one rigs while the North American rig count lost thirty-four rigs.


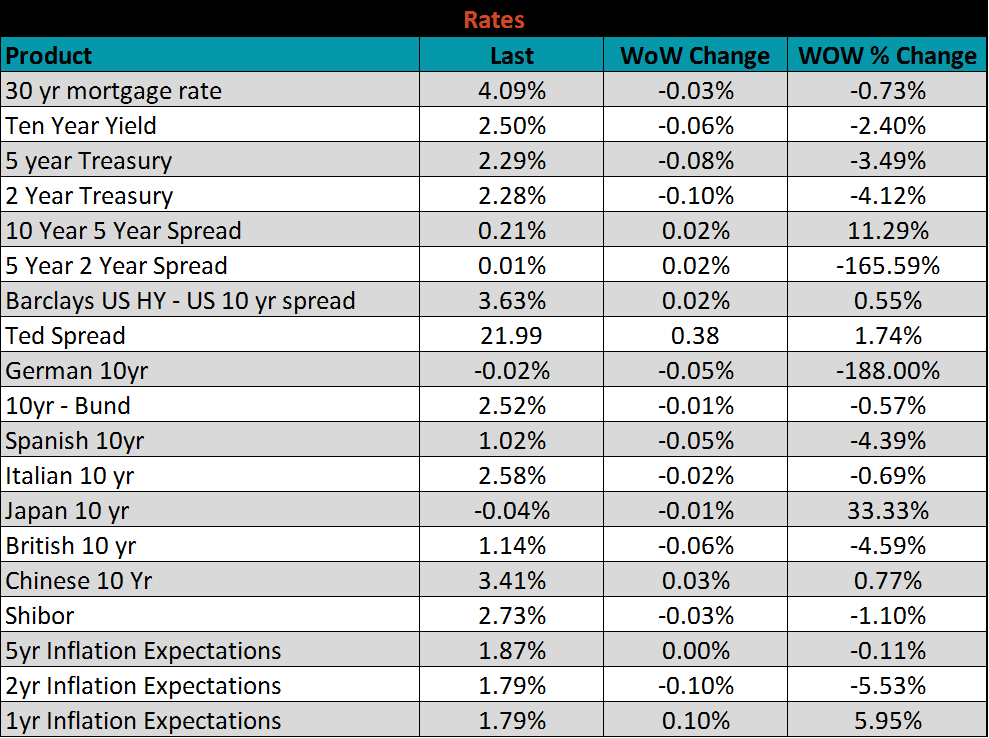
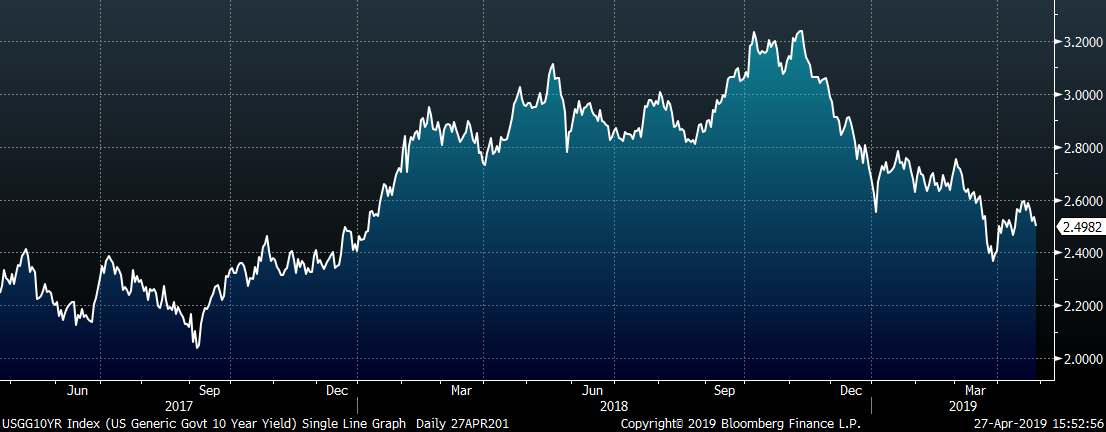
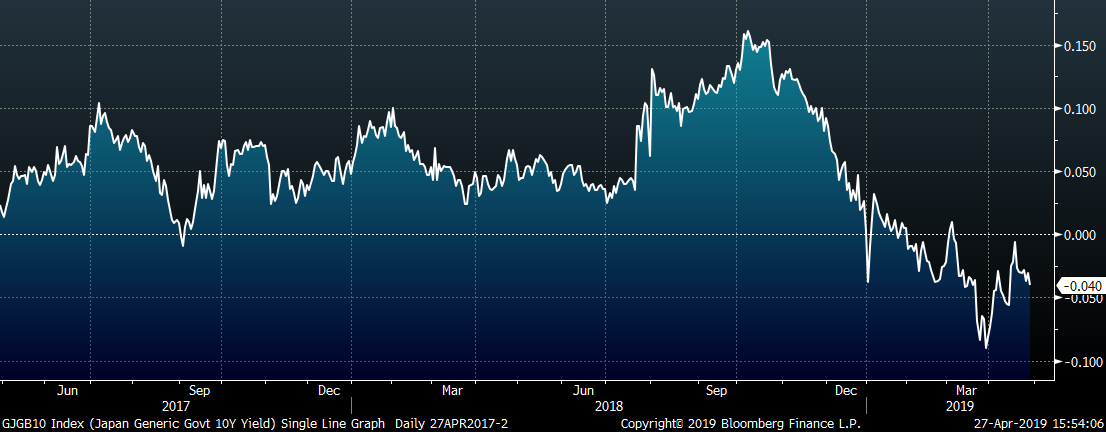
The U.S. 10-year treasury yield was down six basis points, closing the week at 2.50%. The Japanese 10-year yield fell one basis point while the German 10-year yield fell five. Both the Japanese and German yields show a consistent downtrend since October 2018 and have been hovering around 0% recently.


The list below details some upside and downside risks relevant to the steel industry. The orange ones are occurring or look to be highly likely. The upside risks look to be in control.
Upside Risks:
Downside Risks: