Flack Capital Markets | Ferrous Financial Insider
April 12, 2024 – Issue #427
April 12, 2024 – Issue #427
Overview:
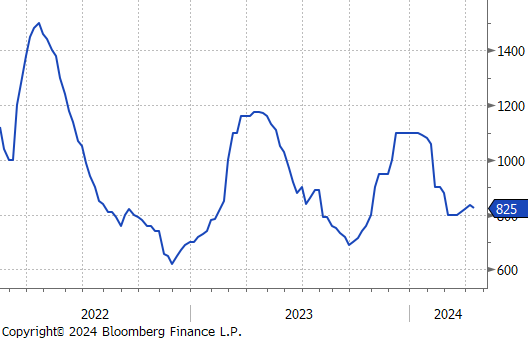

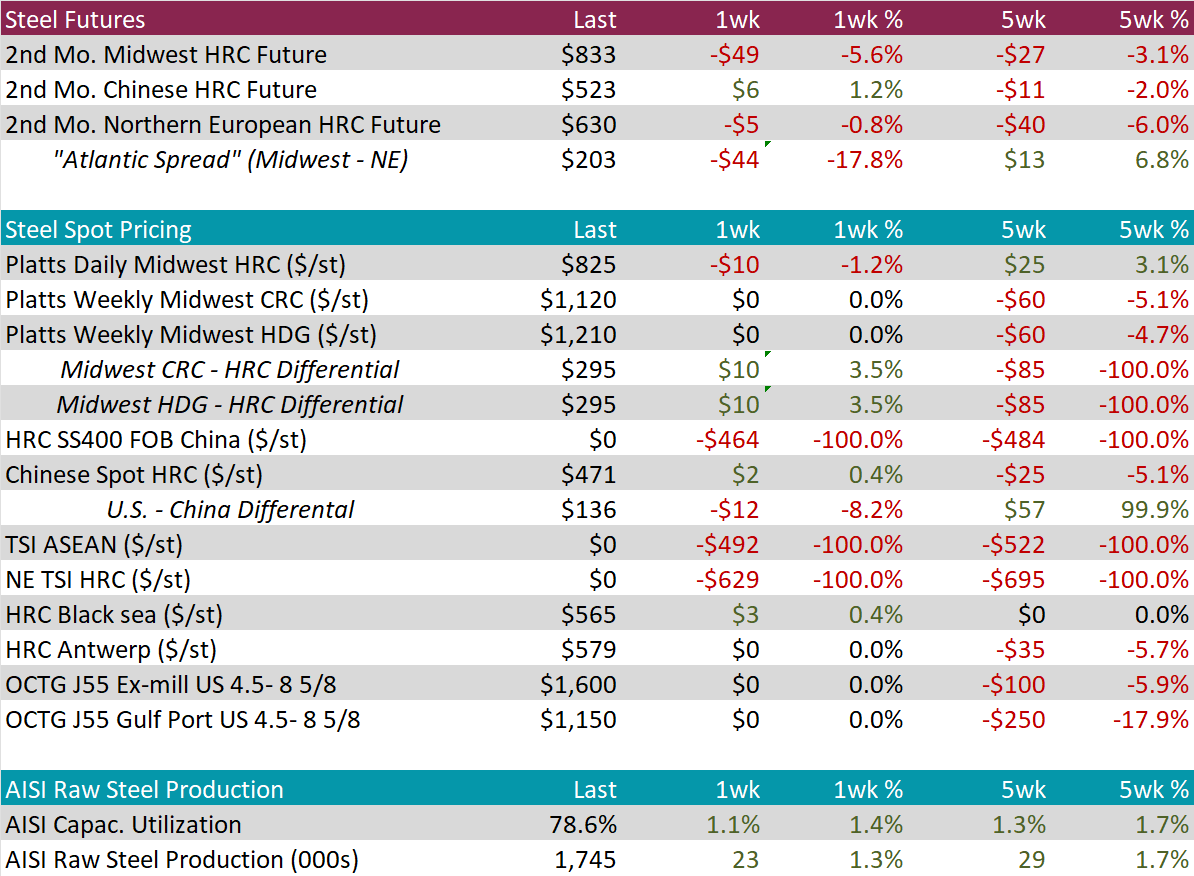
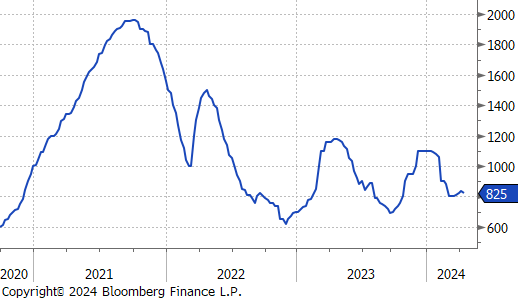
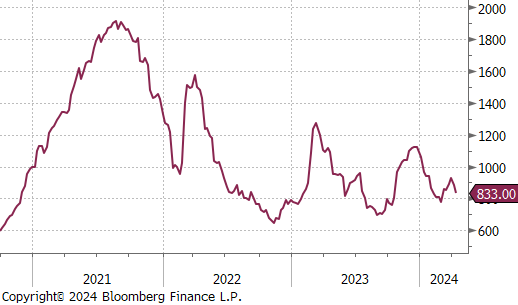
The HRC spot price dropped by $10 or -1.2% to $825, marking the first price decrease in six-weeks. Meanwhile, the 2nd month future added onto last weeks fall, declining by $49 or -5.6% to $833, hitting the lowest price in six-weeks.
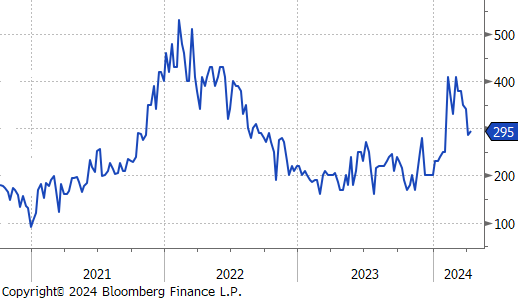
Tandem products both remained unchanged, resulting in the HDG – HRC differential to increase by $10 or 3.5% to $295.
Mill production rose to its historical average level for the first time since August 2023, with capacity utilization ticking up by 1.1% to 78.6% and raw steel production jumping up to 1.745m net tons.

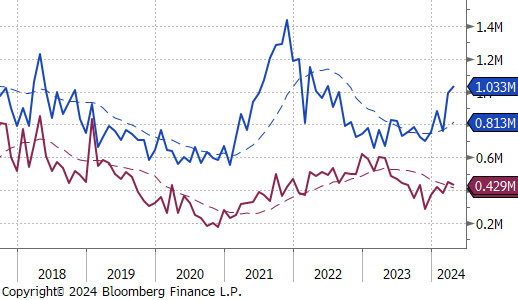
April Projection – Sheet 1033k (up 44k MoM); Tube 429k (down 18k MoM)
March Projection – Sheet 990k (up 231k MoM); Tube 447k (up 64k MoM)

Global differentials were mixed but largely contracted, with China Export and Domestic HRC rising by 1.0% and 1.8%, respectively, and Korea HRC increasing by 0.4%, while all other global prices faced declines or held steady.


Scrap
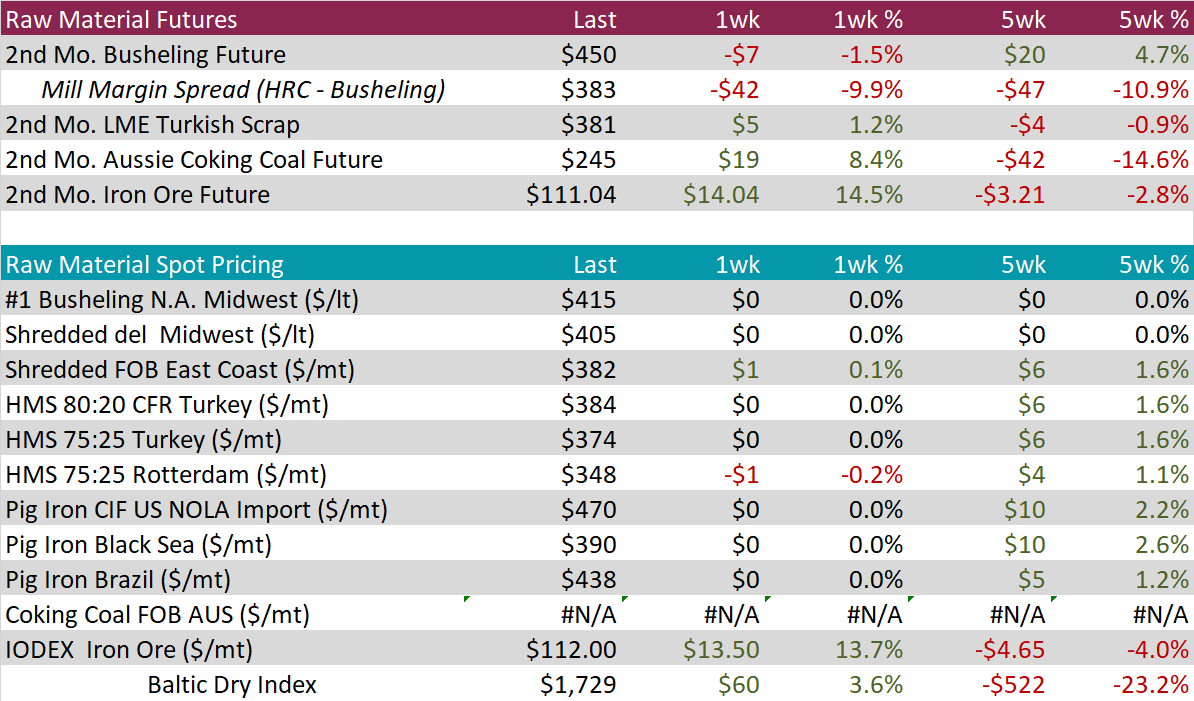
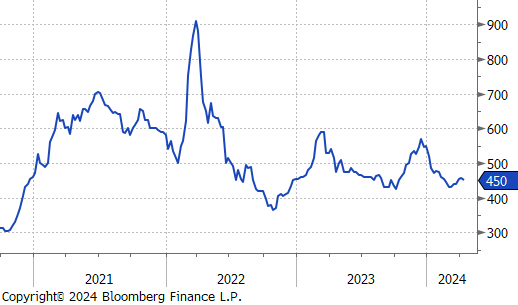
The 2nd month busheling future experienced a slight decline, falling by $7 or -1.5% to $450, however, the five-week price change continues to show an increase, being up $20 or 4.7%.
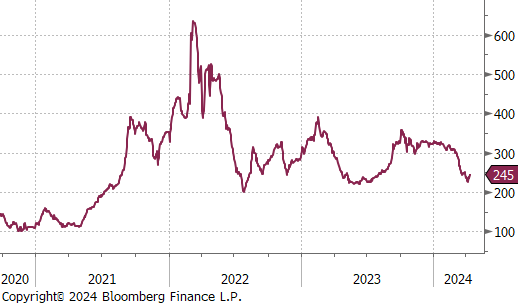
The Aussie coking coal 2nd month future rebounded by $19 or 8.4% to $245, marking a recovery after last weeks price drop from this price.
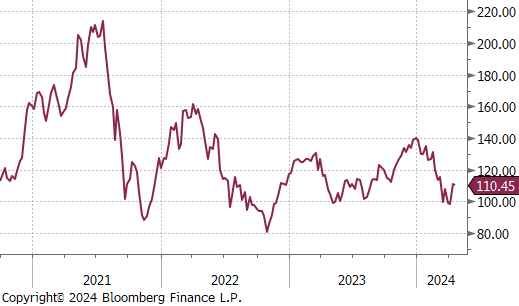
The iron ore 2nd month future rose by $14.04 or 14.5% to $111.04 to round out the week, marking a notable turn around since its most recent downward trend.
Dry Bulk / Freight
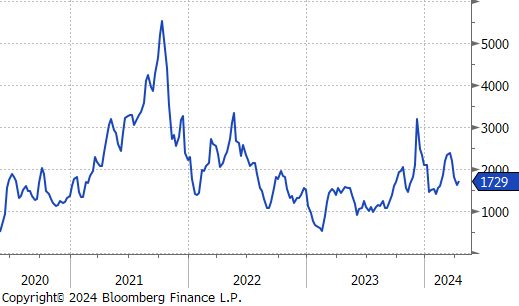
The Baltic Dry Index experienced a slight recovery, bouncing up by $60 or 3.6% to $1,729, however, the five-week price change continues to be negative, being down by $522 or -23.2%.
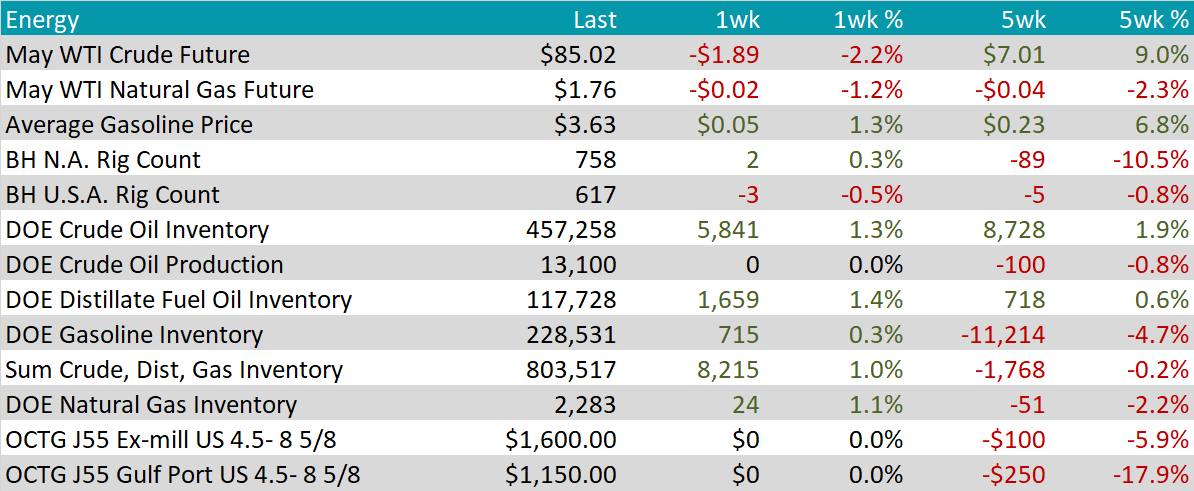
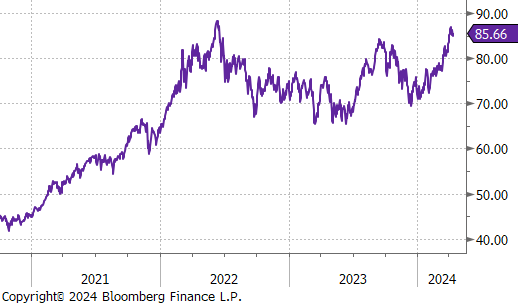
WTI crude oil future lost $1.89 or -2.2% to $85.02/bbl, retreating from a its most recent price high.
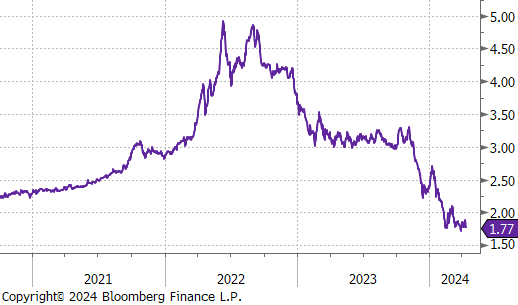
WTI natural gas future lost $0.02 or -1.2% to $1.76/bbl.
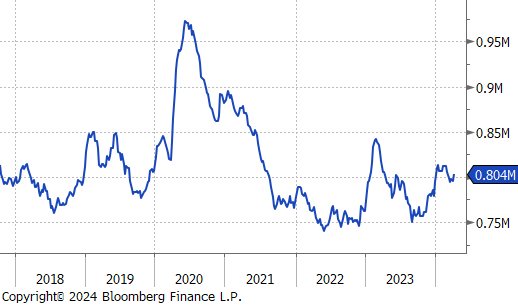
The aggregate inventory level experienced a notable up-tick, increasing by 1.0%.
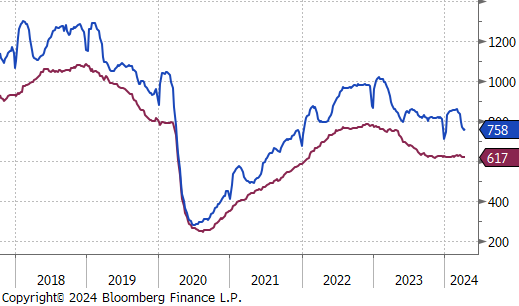
The Baker Hughes North American rig count gained 2 rigs, bringing the total count to 758 rigs, whereas the US count had a reduction, declining by 3 rigs, bringing the total count to 617 rigs.
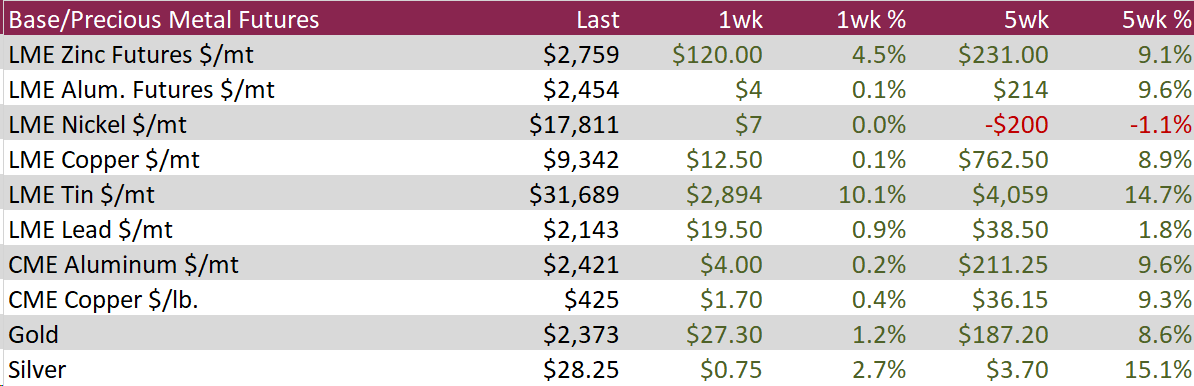
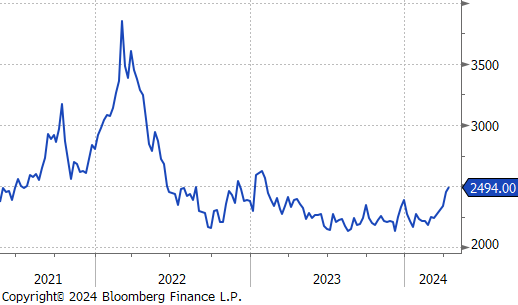
Aluminum prices soared to $2,494, reaching a 14-month high, driven by a broader rally in base metals, a weakening dollar, supply concerns, and rising demand from China. Surprising gains in China’s manufacturing PMI data for March indicated a positive response to Beijing’s economic stimuli and support measures, helping boost factory activity. The price rise was further supported by ongoing supply issues, highlighted by the Aluminum Corp of China’s warnings about bauxite security, which remains vulnerable due to reliance on Guinea—a country experiencing disruptions following an explosion at a major fuel depot. Additionally, production in Yunnan, China’s fourth-largest aluminum-producing region, was constrained by seasonal production cuts during the dry season.
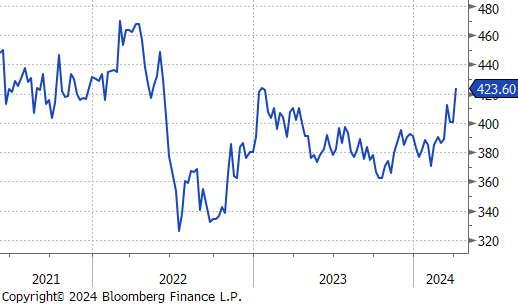
Copper climbed by $1.70 or 0.4% to $425, reaching levels not seen since June 2022, as robust demand and tight supply in China countered the effects of a strong US dollar. New trade data revealed a 16% increase in unwrought copper imports by China, the world’s largest consumer, totaling 474,000 tonnes in March. This rise corresponds with strong manufacturing PMI numbers, indicating a potential rebound in China’s industrial sector after a period of decline. Additionally, regulatory changes are enabling Chinese copper smelters to reduce their output by up to 10% this year. Satellite observations have also recorded an uptick in offline smelters in March. This reduction in output coincides with a significant drop in copper ore supply due to disruptions at major mining sites, including the Cobre mine in Panama and several in Chile, leading to intense pressure on the treatment and refining markets where fees have nearly vanished.
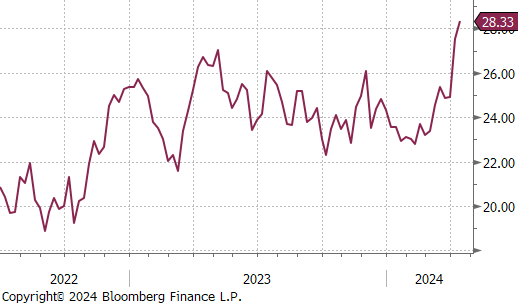
Silver jumped above $28, reaching the highest point since February 2013, propelled by increased investment in safe-haven assets due to rising inflation and geopolitical tensions in the Middle East. The ongoing conflict escalation, highlighted by the collapse of ceasefire talks between Israel and Hamas and Iran’s threats of retaliation following an airstrike, fueled investor concerns. Beyond its role as a traditional safe-haven, silver’s demand has also been boosted by its industrial uses. Economic recovery signs in China, a major consumer, alongside anticipations of further stimulus, have particularly increased its use in chip and solar panel manufacturing. Additionally, positive manufacturing data from other major economies like the US and Germany contributed to the optimistic outlook for silver.
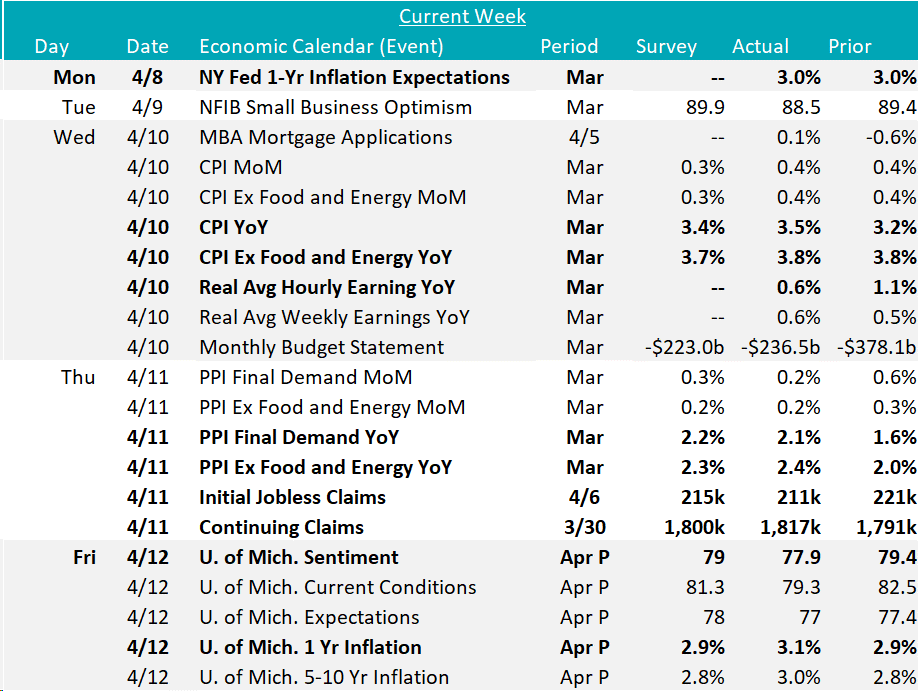
CPI YoY rose to 3.5% from February’s 3.2% and surpassed the forecast estimates of a 3.4% increase. At the same time, March’s CPI (Ex Food & Energy) YoY held steady at 3.8%, which was also above market expectations of 3.7%. Another concerning signal comes from Supercore CPI YoY which rose to 4.8%, it’s highest level since April 2024. In the run up of interest rates, Chair Powell specifically pointed to CPI Services (ex. Shelter) as a key indicator for where price pressure was trending.
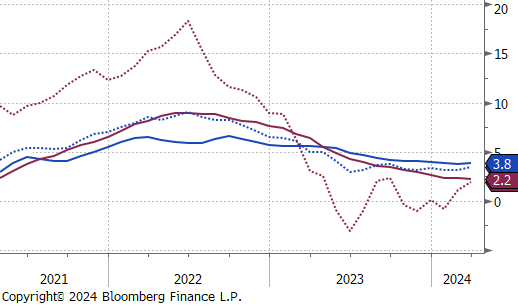
The producer prices release, on the other hand, provided more of a mixed view on how upstream prices were coming in. Topline PPI YoY rose 2.1%, below expectations of a 2.2% level, while PPI ex. food and energy YoY came in slightly hotter, up 2.4% versus estimates of a 2.3% increase.
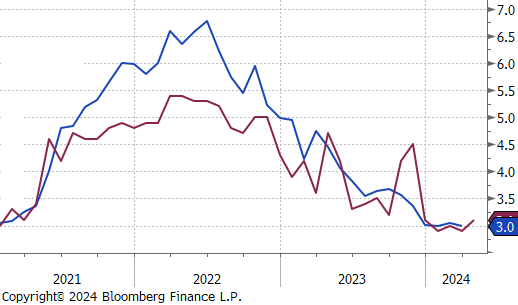
Moving on to the consumer, there are early indications that the bias towards disinflationary expectations is no longer as clear and pronounced. The March NY Fed 1-Yr Inflation Expectations, held steady at 3.0% (4th straight month) and the April preliminary University of Michigan 1-Yr Inflation Expectations rose back up to 3.1% from 2.9%, last month. The key risk here is that the longer inflation is sticky, the more likely we will see a surge in wages demanded as expectations for higher prices in the future are entrenched.
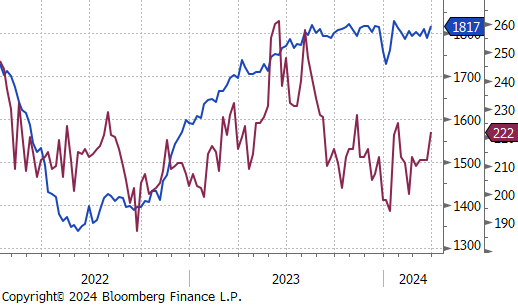
From the labor market side, real average weekly earnings YoY remained positive for the 10th straight month. Initial jobless claims came in below expectations again this week and those, coupled with the level for continuing claims point to a strong labor market.