Flack Capital Markets | Ferrous Financial Insider
April 19, 2024 – Issue #428
April 19, 2024 – Issue #428
Overview:
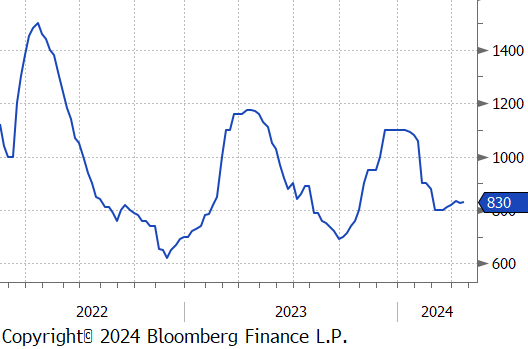
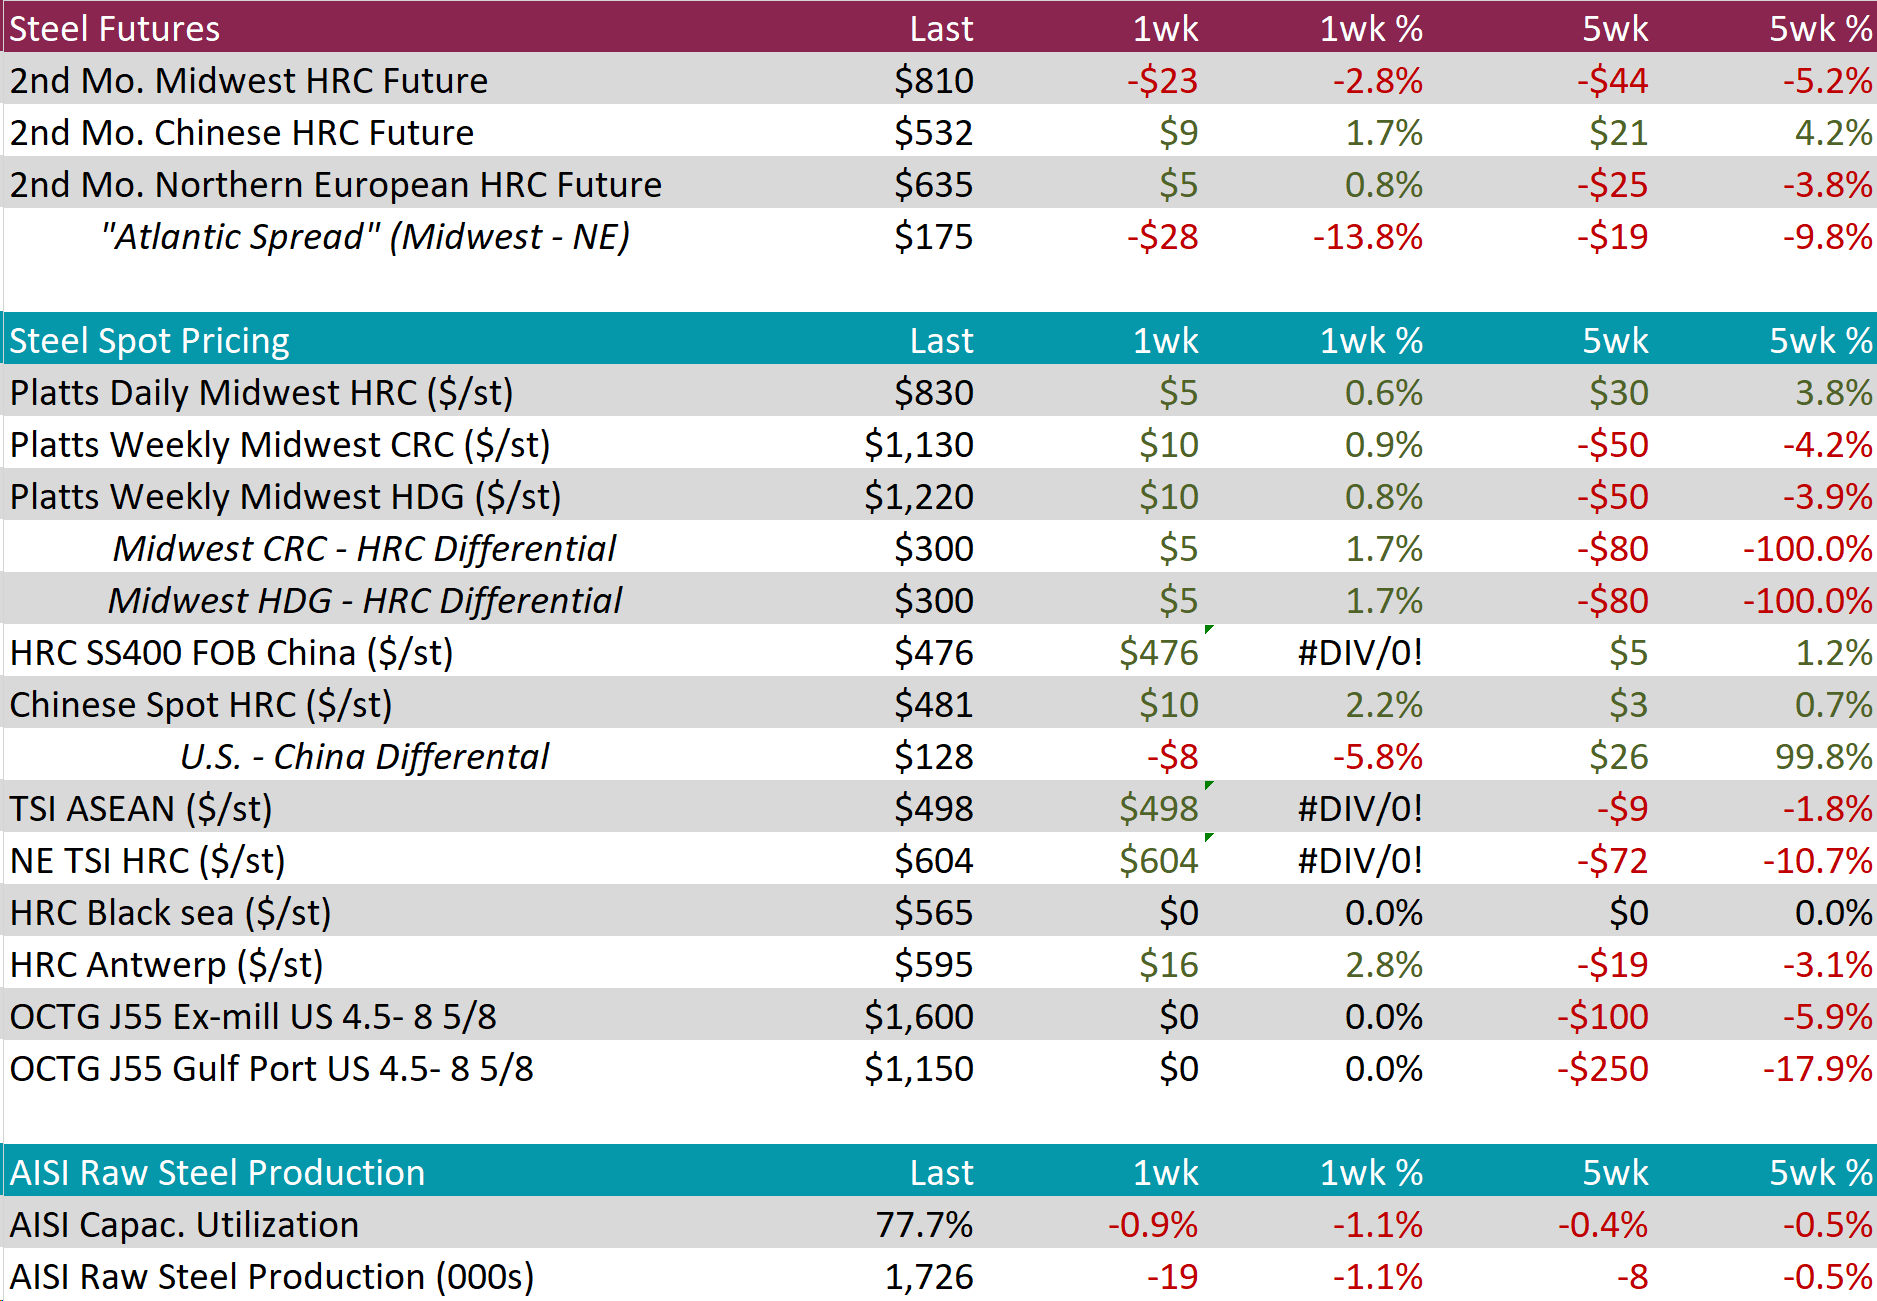
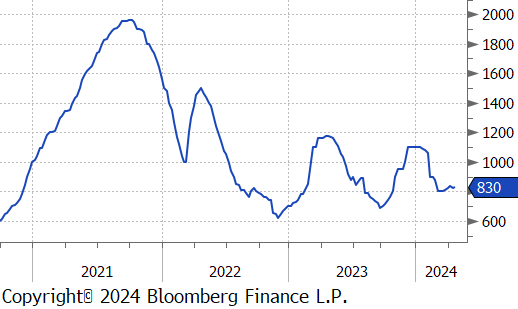
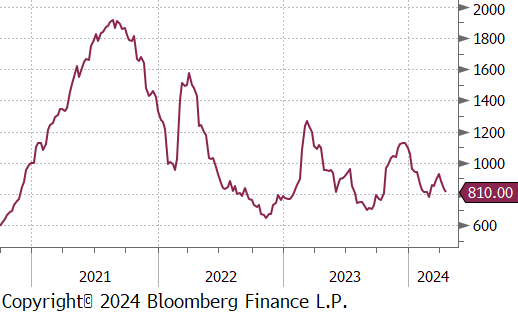
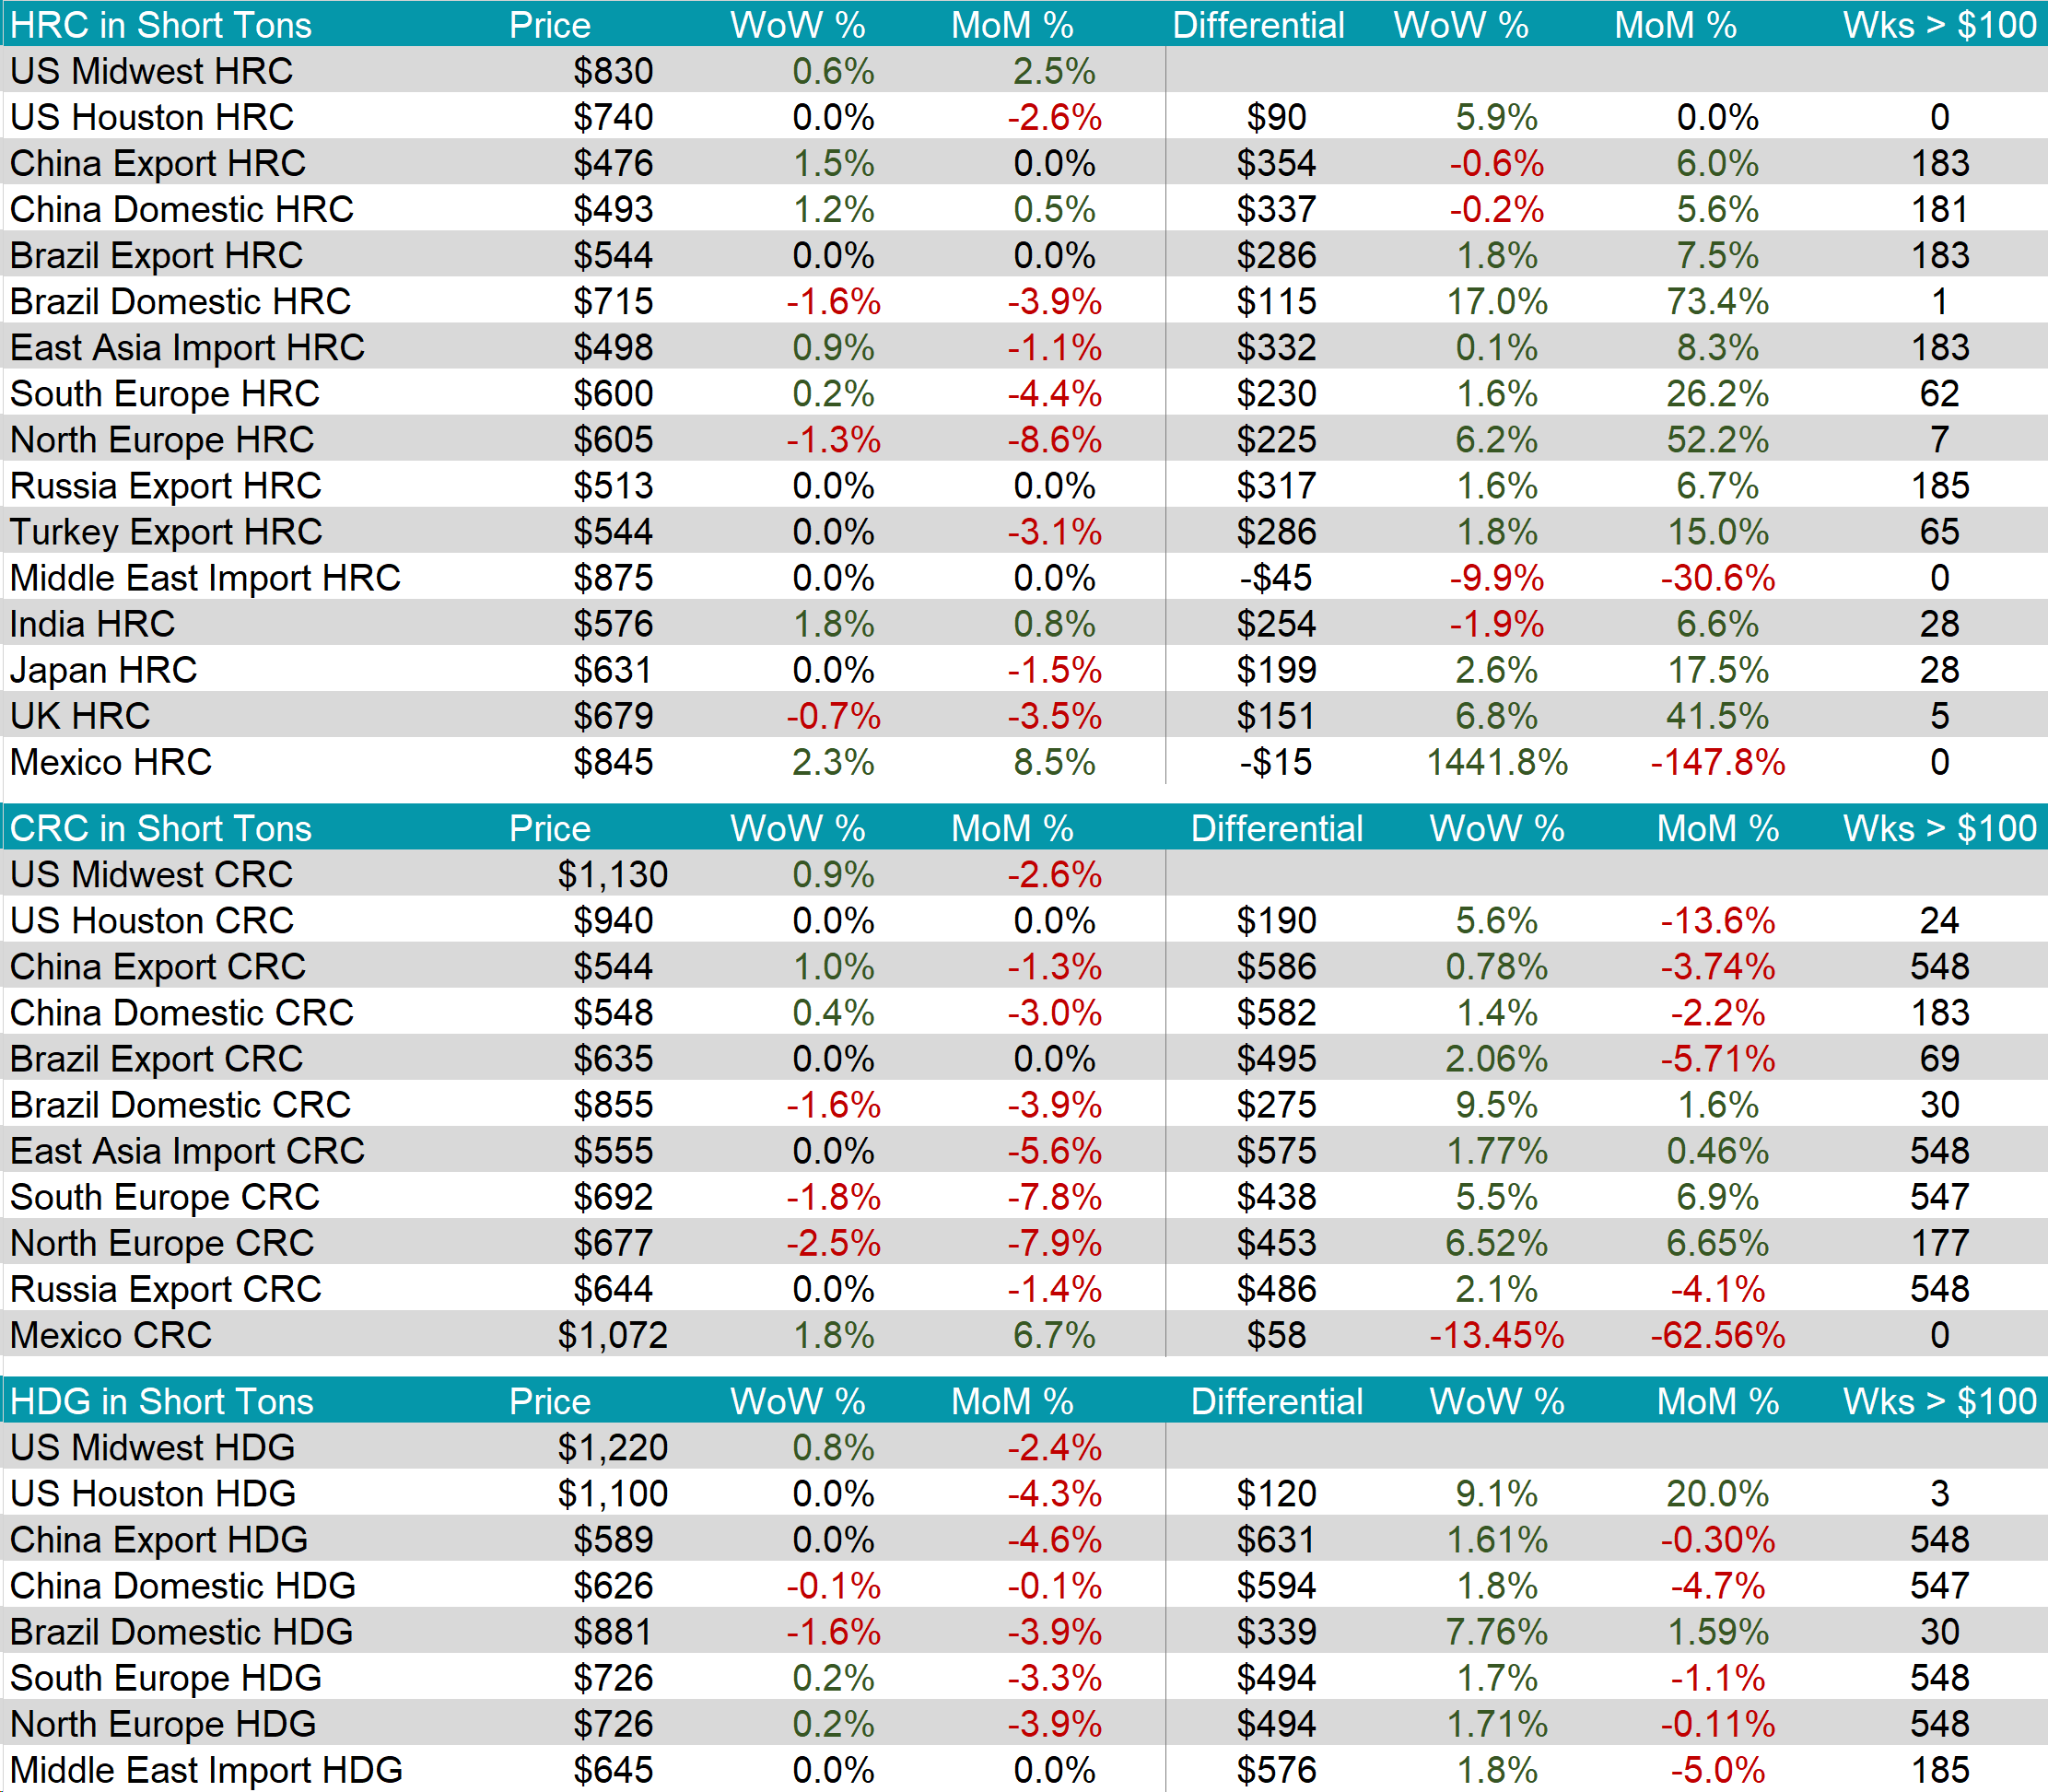
The HRC spot price increased slightly by $5 or 0.6% to $830, as it continues to float right above the $800 price level. At the same time, the 2nd month future further declined this week, falling by $23 or -2.8% to $810, marking the third consecutive week of decreases.
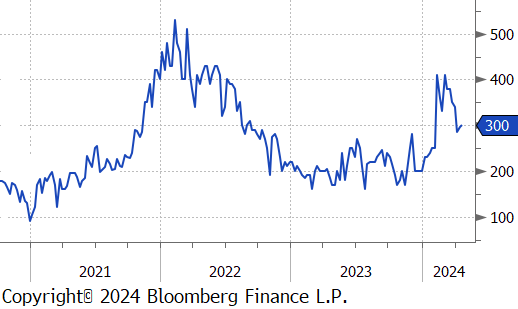
Tandem products both rose by $10, resulting in the HDG – HRC differential to jump up by $5 or 1.7% to $300.
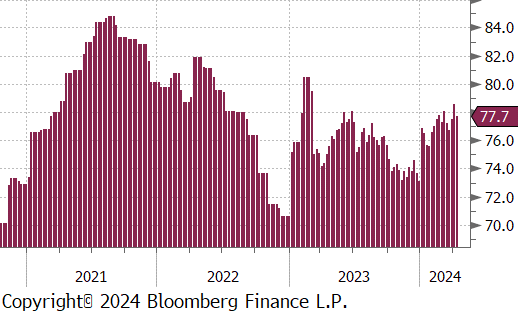
Mill production pulled back, with capacity utilization ticking down by 0.9% to 77.7%, bringing raw steel production down to 1.726m net tons.
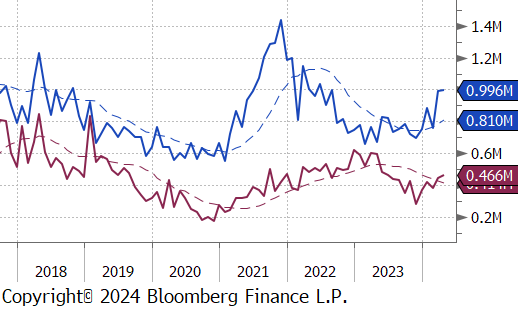
April Projection – Sheet 996k (up 4k MoM); Tube 466k (up 19k MoM)
March Projection – Sheet 992k (up 233k MoM); Tube 447k (up 64k MoM)
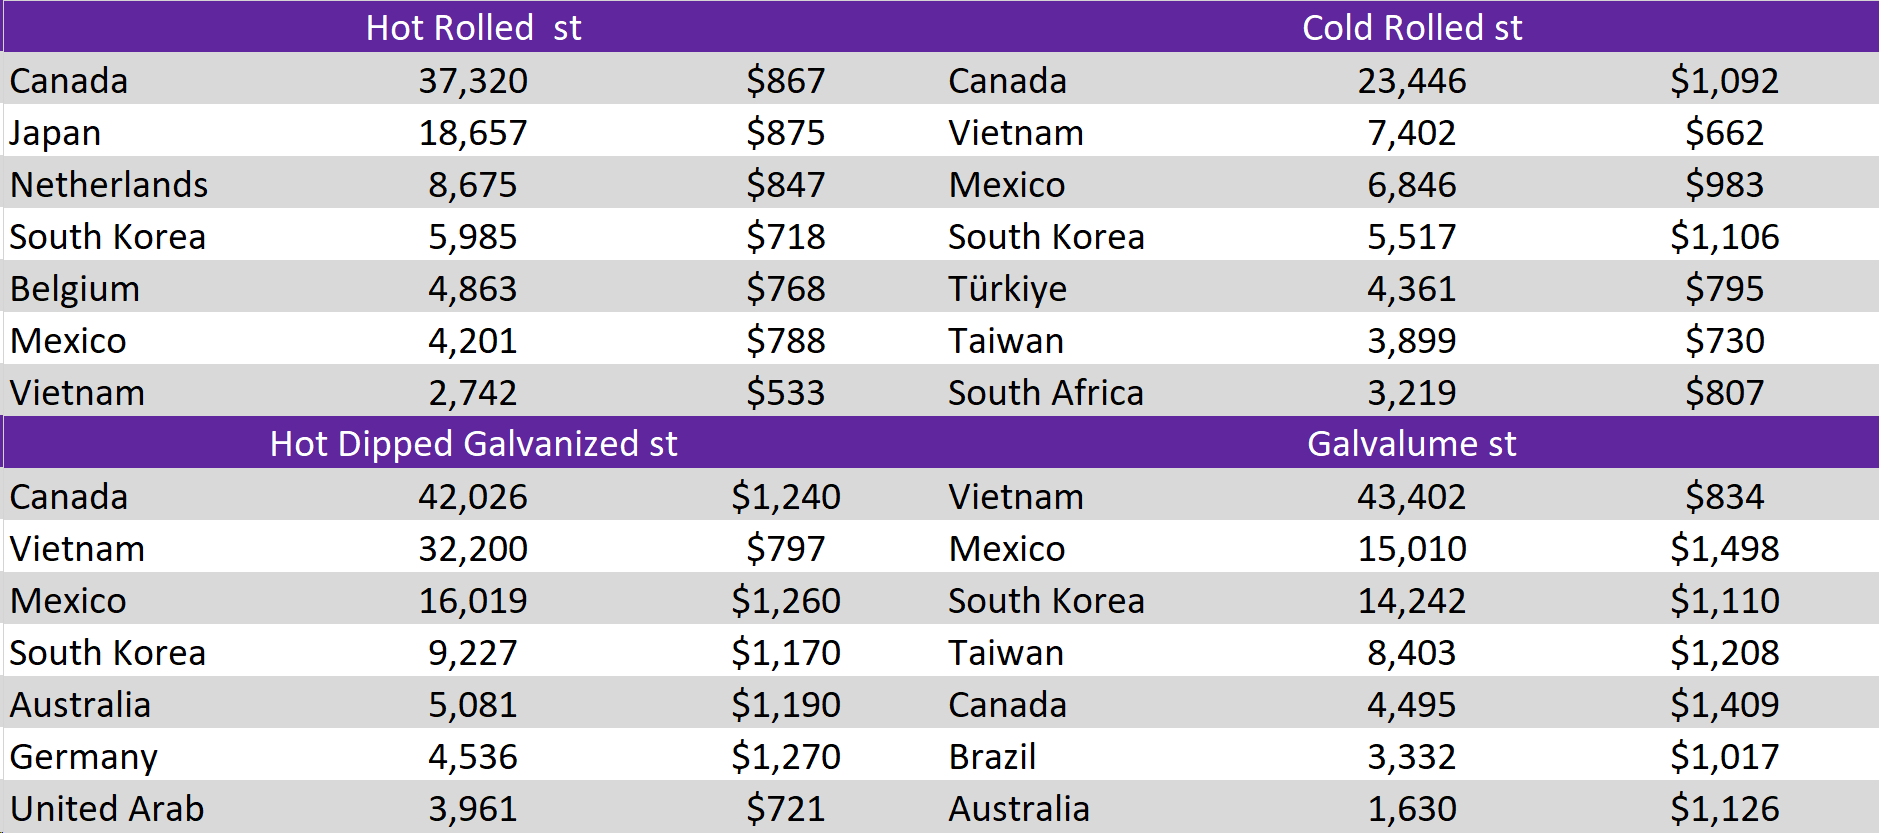
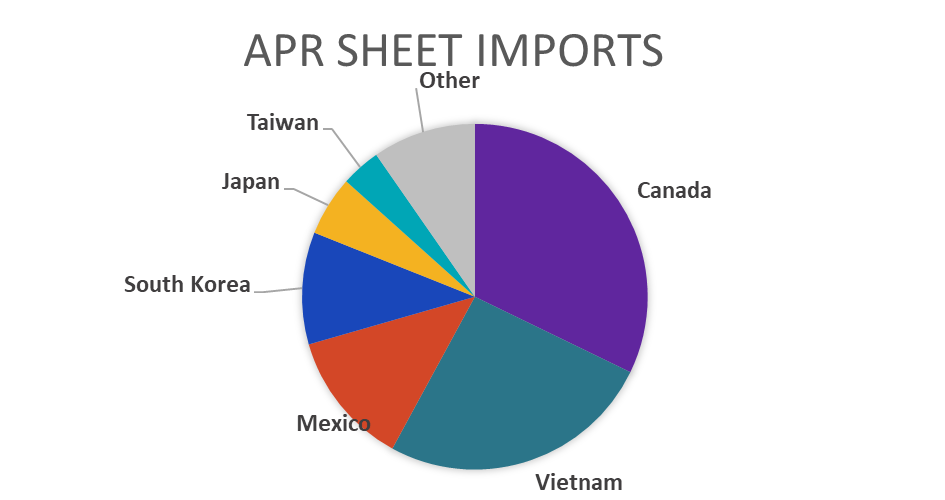
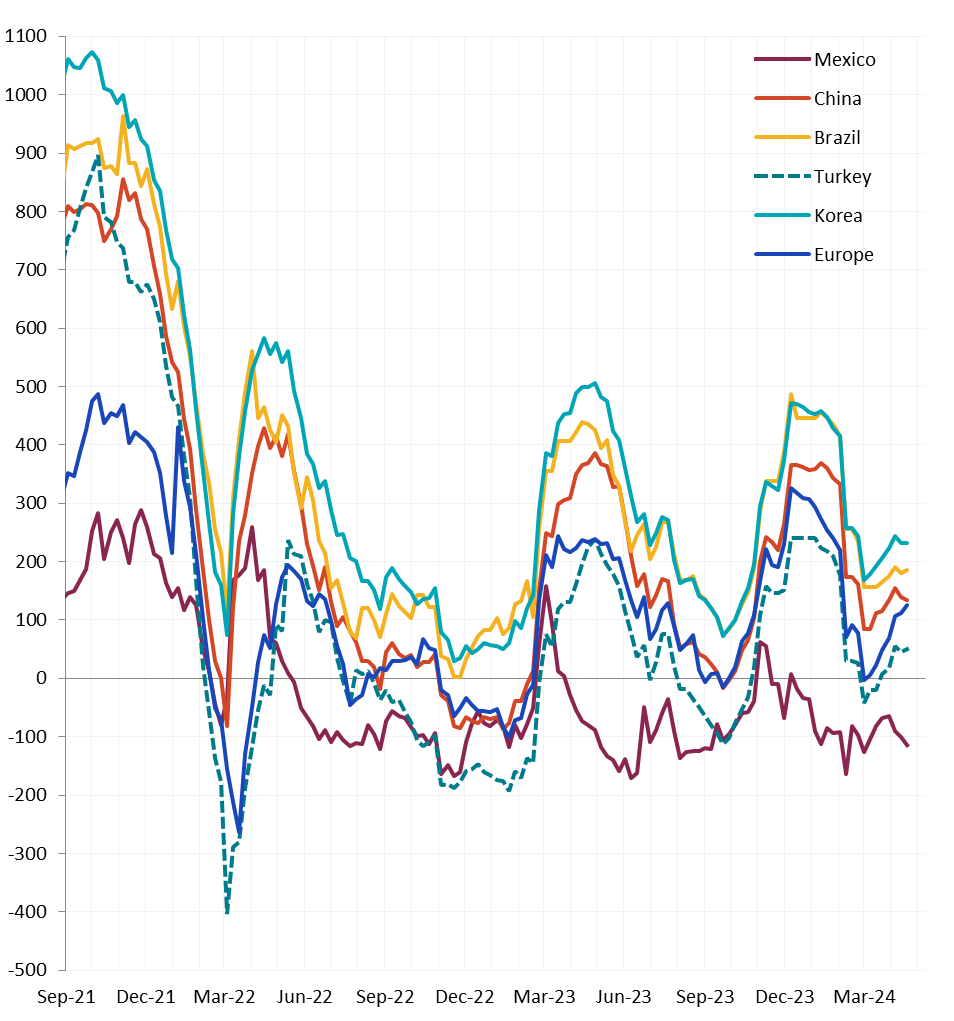
All watched global differentials mainly expanded, except for China, where China Export HRC increased by 1.5% and Mexico HRC rose by 2.3%, whereas Europe HRC fell by -1.3%.
Scrap
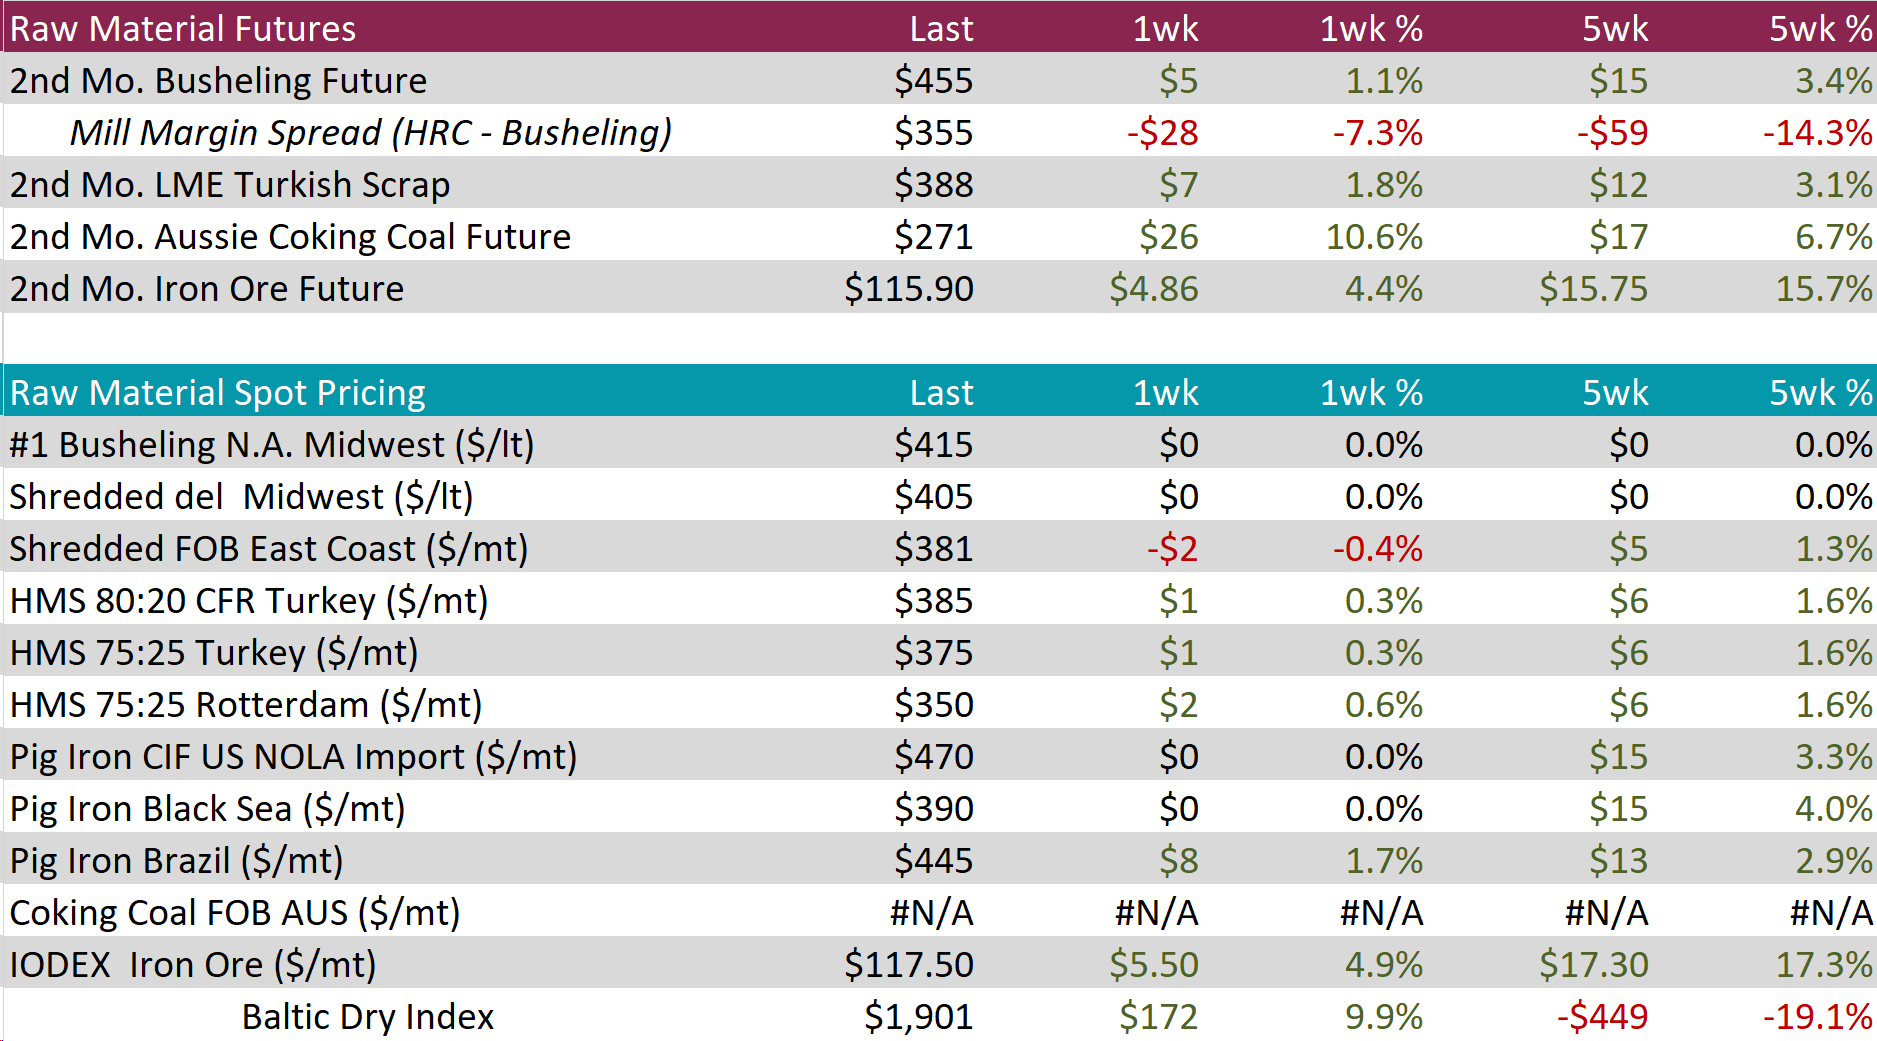
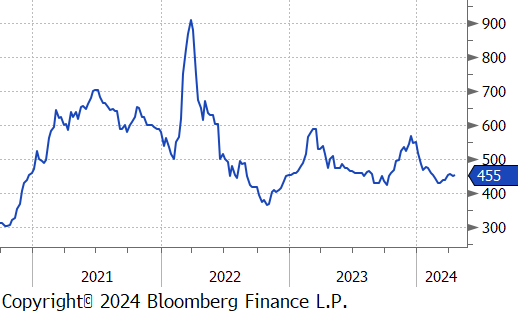
The 2nd month busheling future rose by $5 or 1.1% to $455, marking the five-week change being up by $15 or 3.4%.
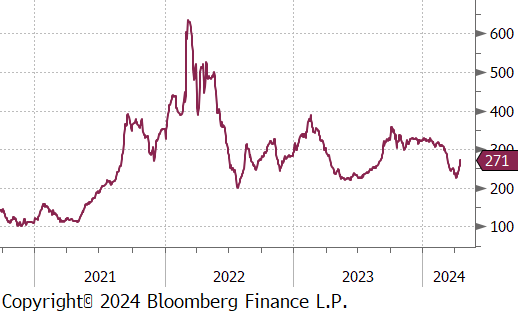
The Aussie coking coal 2nd month future soared up by $26 or 10.6% to $271, marking the third consecutive week of price increases and the price continues to recover.
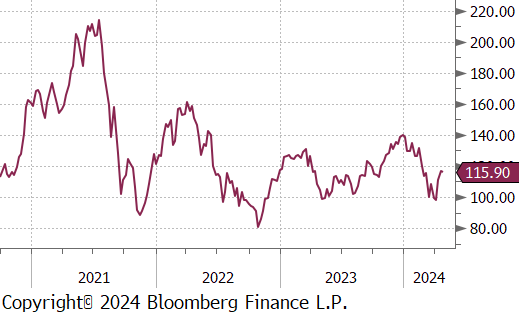
The 2nd month iron ore future climbed by $4.86 or 4.4% to $115.90, maintaining to rebound after hitting recent price low of $97.
Dry Bulk / Freight
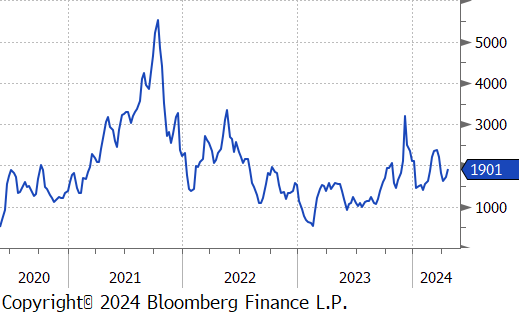
The Baltic Dry Index increased by $172 or 9.9% to $1,901, furthering last weeks rebound and hitting its highest price in four weeks.
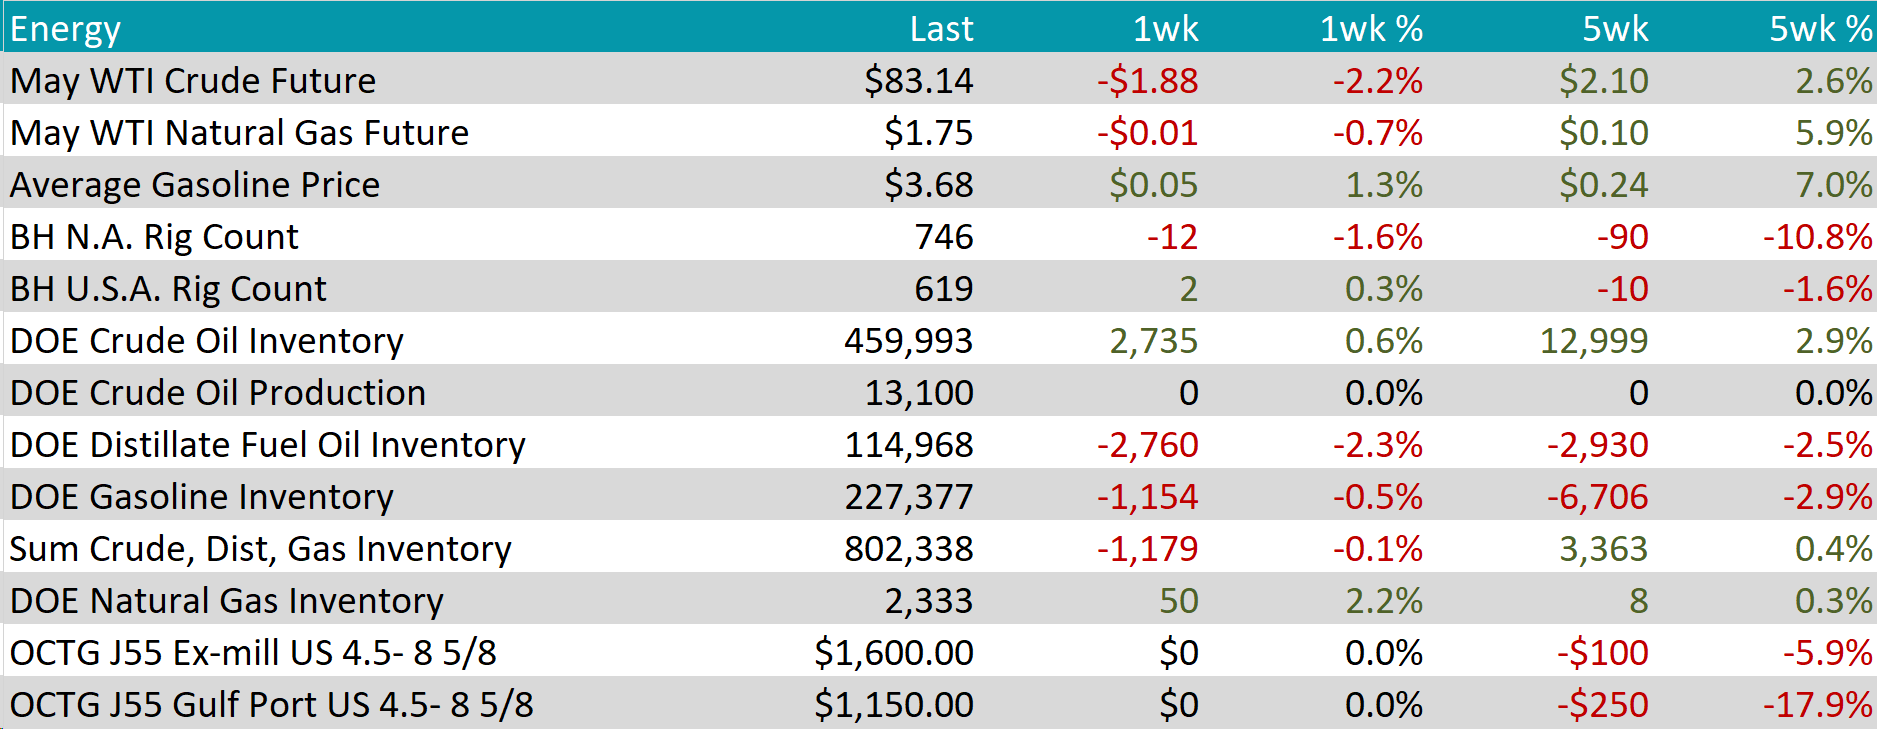
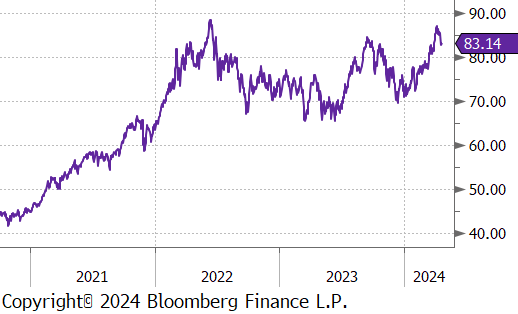
WTI crude oil future lost $1.88 or -2.2% to $83.14/bbl.
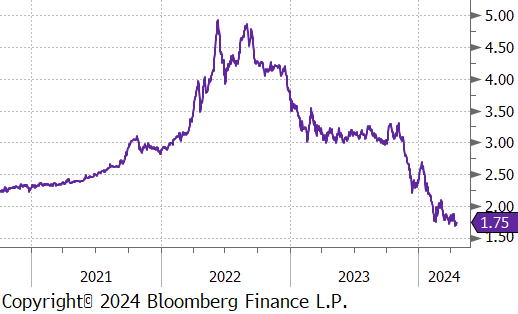
WTI natural gas future lost $0.01 or -0.7% to $1.75/bbl.
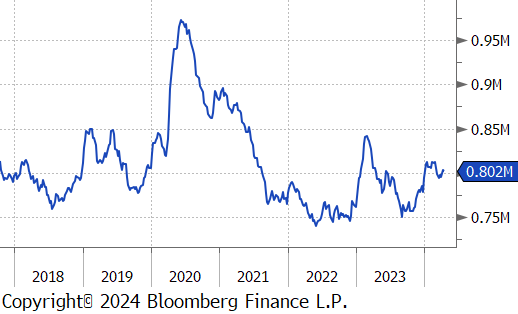
The aggregate inventory level experienced a slight decline of -0.1%.
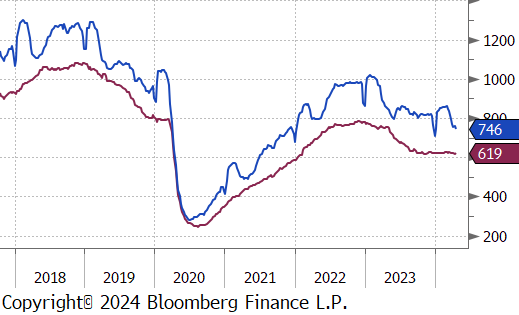
The Baker Hughes North American rig count reduced by 12 rigs, bringing the total count to 746 rigs, whereas the US rig count added 2 rigs, bringing the total count to 619 rigs.
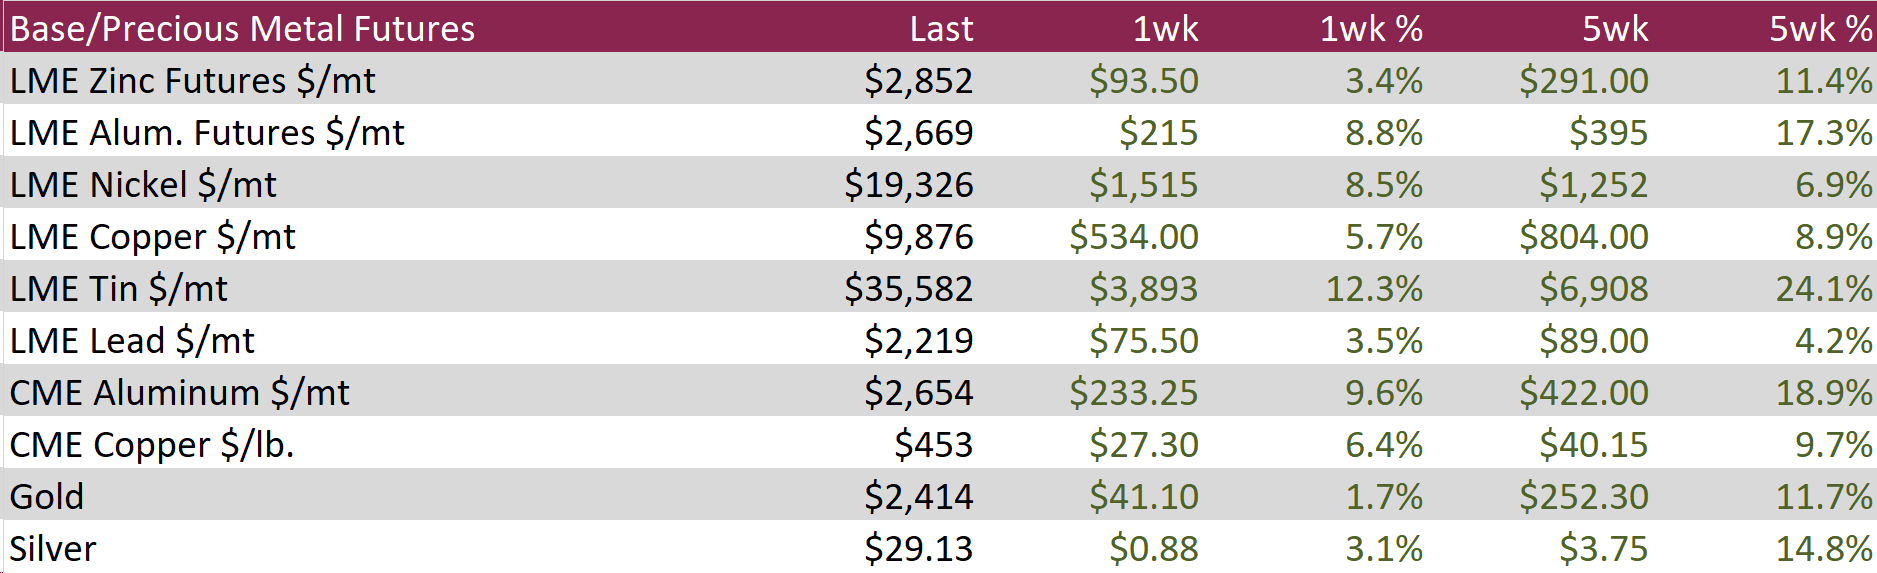
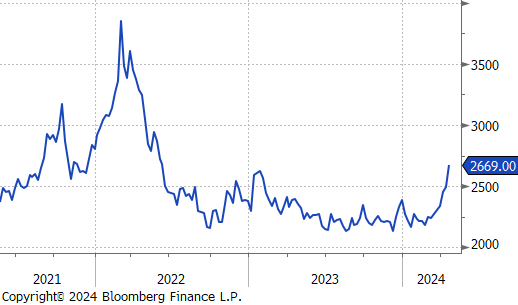
Aluminum rose by $215 or 8.8% to $2,669, the highest since early 2023, as Western sanctions against Russian metals disrupted supply. The US and UK imposed bans on new deliveries of Russian aluminum to the London Metal Exchange (LME), significantly restricting availability at one of the world’s key metal markets. Moreover, the prospect of further sanctions has made Western buyers cautious about purchasing Russian aluminum outside of LME contracts, adding to supply concerns. In China, the Aluminum Corp highlighted ongoing uncertainties in bauxite security, largely due to reliance on Guinea, which has faced disruptions after an explosion at a major fuel depot. Additionally, production in Yunnan, China’s fourth-largest aluminum-producing region, continued to be limited by seasonal production cuts during the dry season.
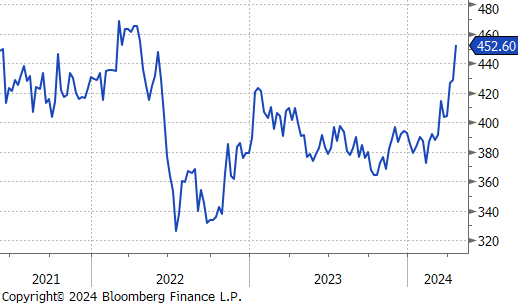
Copper climbed by $27.30 or 6.4% to $453, reaching a near two-year high, driven by tight supply and increasing demand. In China, the world’s leading producer of refined copper, satellite data revealed reduced activity at copper smelters, in line with commitments to cut output by up to 10% this year. This decision is a response to the scarce copper ore supply, which has exacerbated the sector’s overcapacity issues, pushing smelting fees to their lowest in years. Additionally, supply constraints were compounded as Zambia halted operations at key mines due to power shortages, Panama’s Cobre mine shut down, and South American mines underperformed against their 2023 projections. Concurrently, demand in China is rebounding, evidenced by a 16% increase in imports of unwrought copper to 474,000 tonnes in March, and strong manufacturing PMI data suggesting a revival in factory activity after a period of economic downturn.
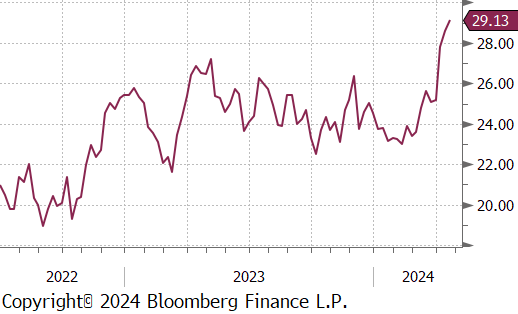
Silver jumped by $0.88 or 3.1% to $29.13, as tensions in the Middle East have somewhat eased and hawkish statements from the Federal Reserve and robust US economic data have raised expectations for continued tight monetary policy, diminishing the appeal of non-interest-bearing assets like silver. Despite this, strong industrial demand for silver persists, driven by its increasing use in electronics and solar power sectors. This demand is evident in the market’s deficit, with above-ground inventories held in LBMA and exchanges showing significant declines over recent years.
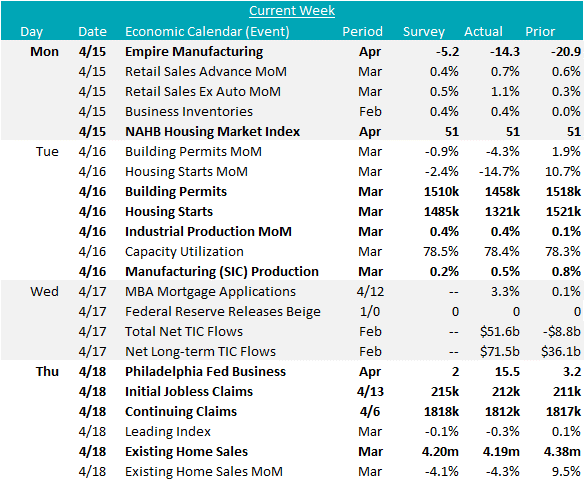
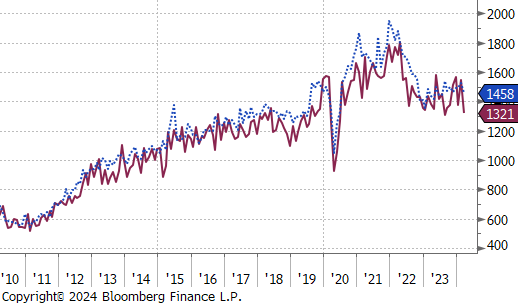
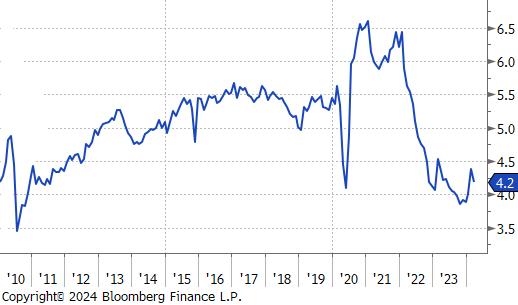
Housing starts and building permits were both down 14.7%, and 4.3%, respectively in March, which was below expectations of down 2.4%, and 0.9%. This comes after 2 months of impressive growth to start the year. Additionally, March’s existing homes sales were down 0.3% compared to the expectation of a 0.1% decline. Existing sales were likely a reaction to the fact that mortgage rates started increasing in March and are currently back up to early December levels. Finally, the NAHB (National Association of Homebuilders) housing market index remained stable at 51 in March, in line with expectations.
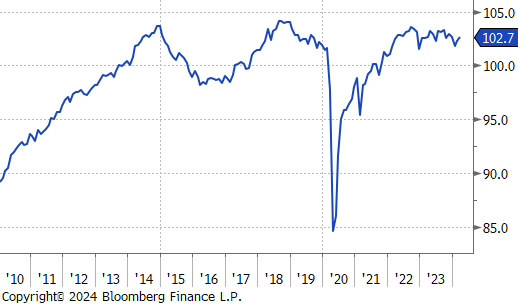
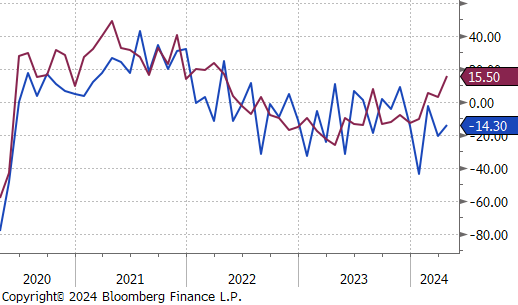
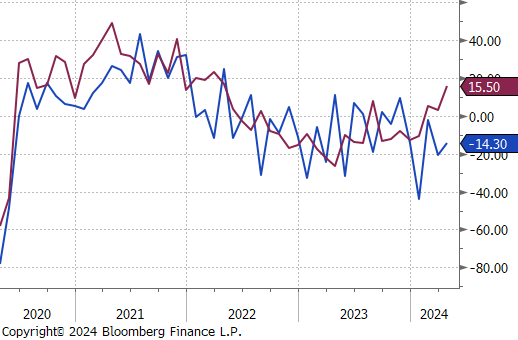
March’s Industrial production index came in line with expectations, printing up 0.4% compared to February. Looking more closely at the underlying manufacturing production component was even more impressive. Here, production rose 0.5%, beating expectations of up 0.2% and February data was also revised higher, to 1.1%, up from the initial read of 0.8%. FED Manufacturing surveys started to come out for April as well, with both Empire (NY) and Philly increasing from last months readings, up to -14.3 from -20.3, and 15.5 from 3.2, respectively.