Flack Capital Markets | Ferrous Financial Insider
April 26, 2024 – Issue #429
April 26, 2024 – Issue #429
Overview:
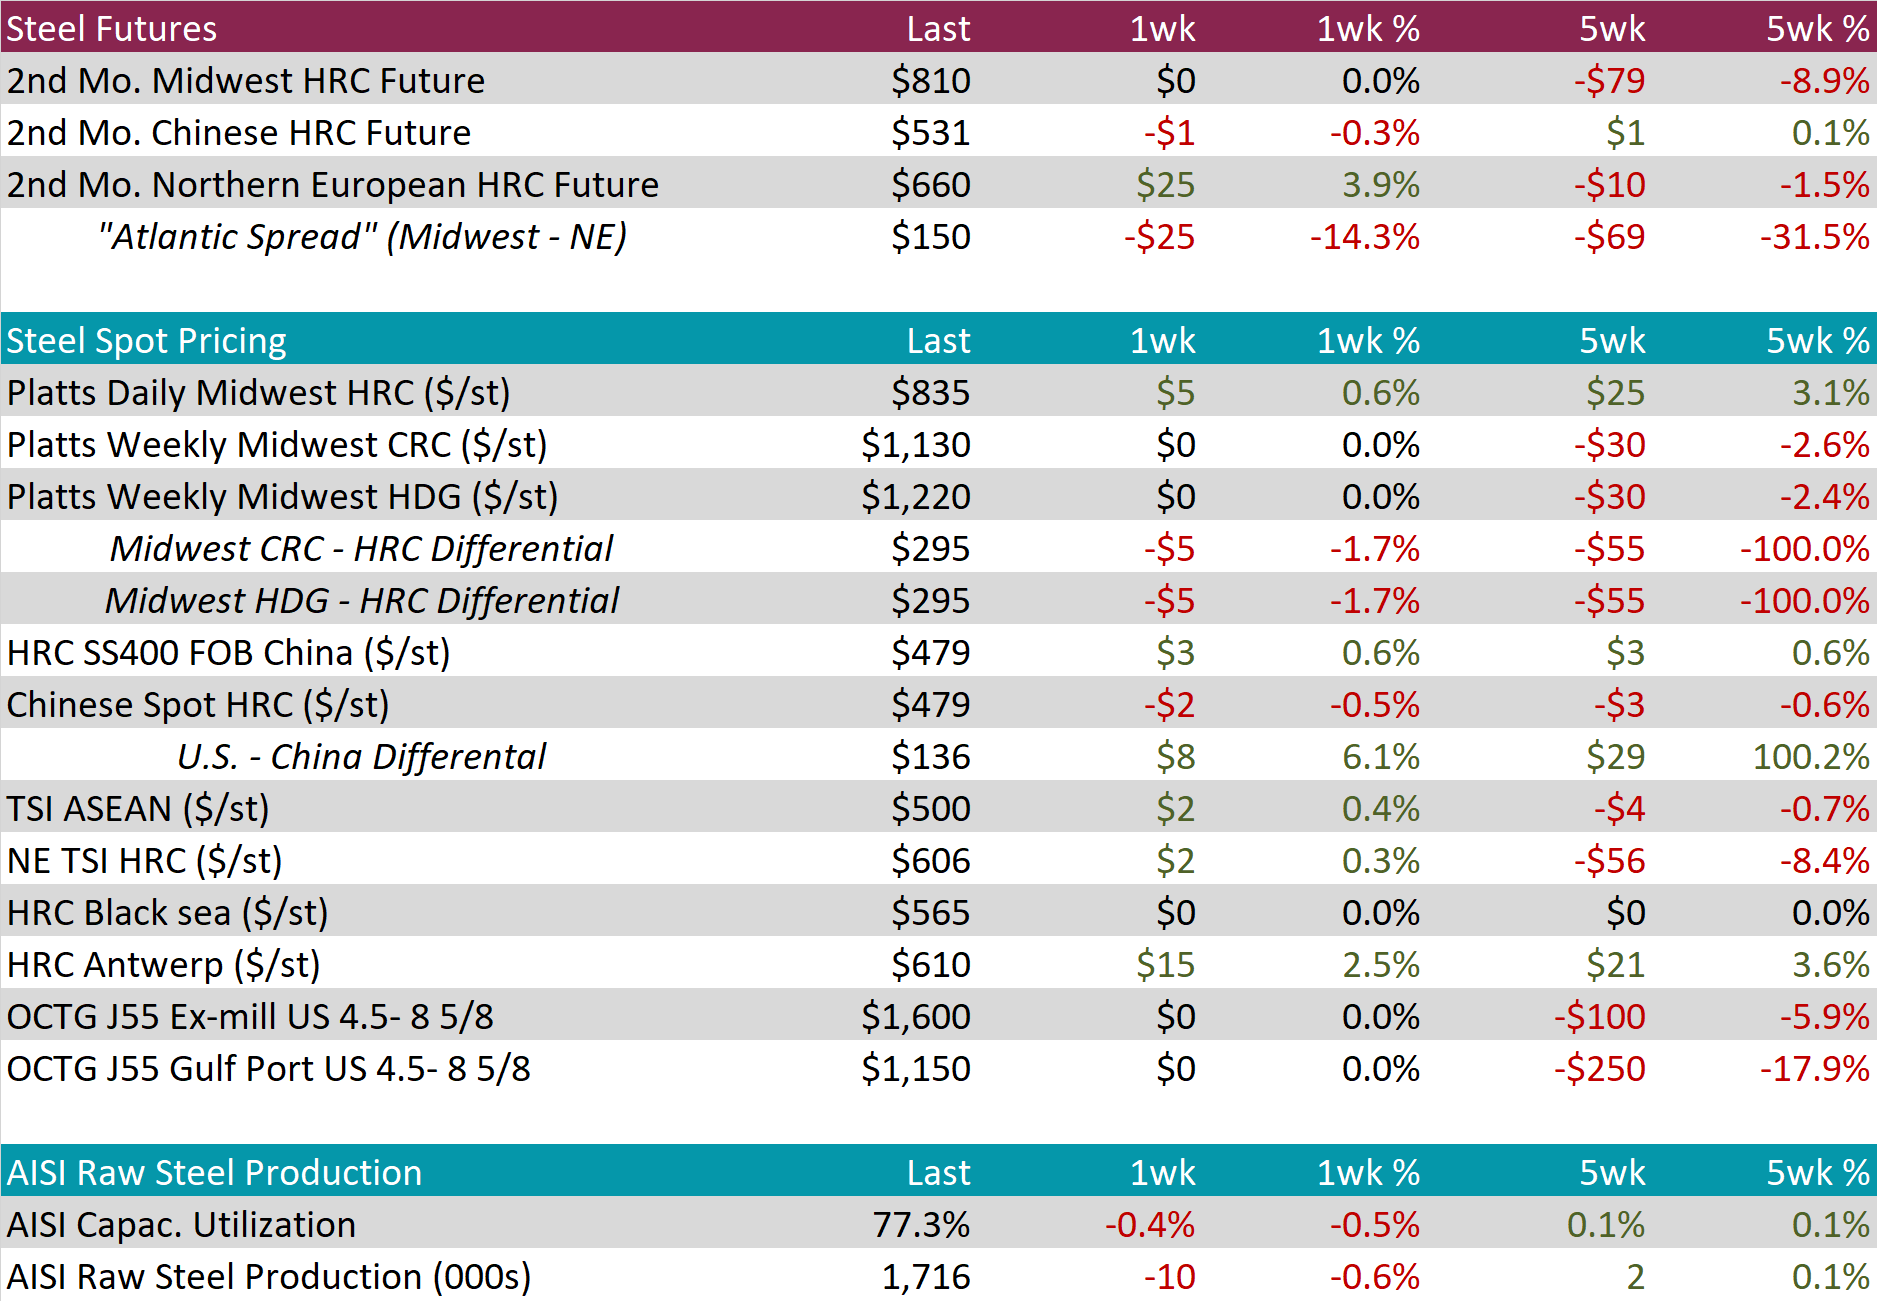
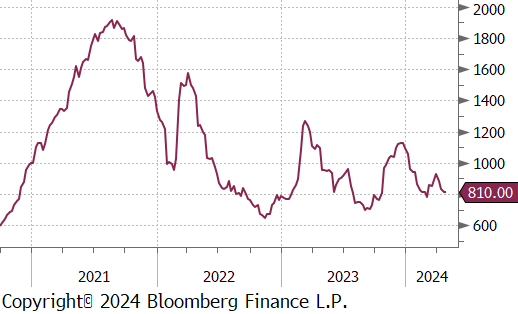
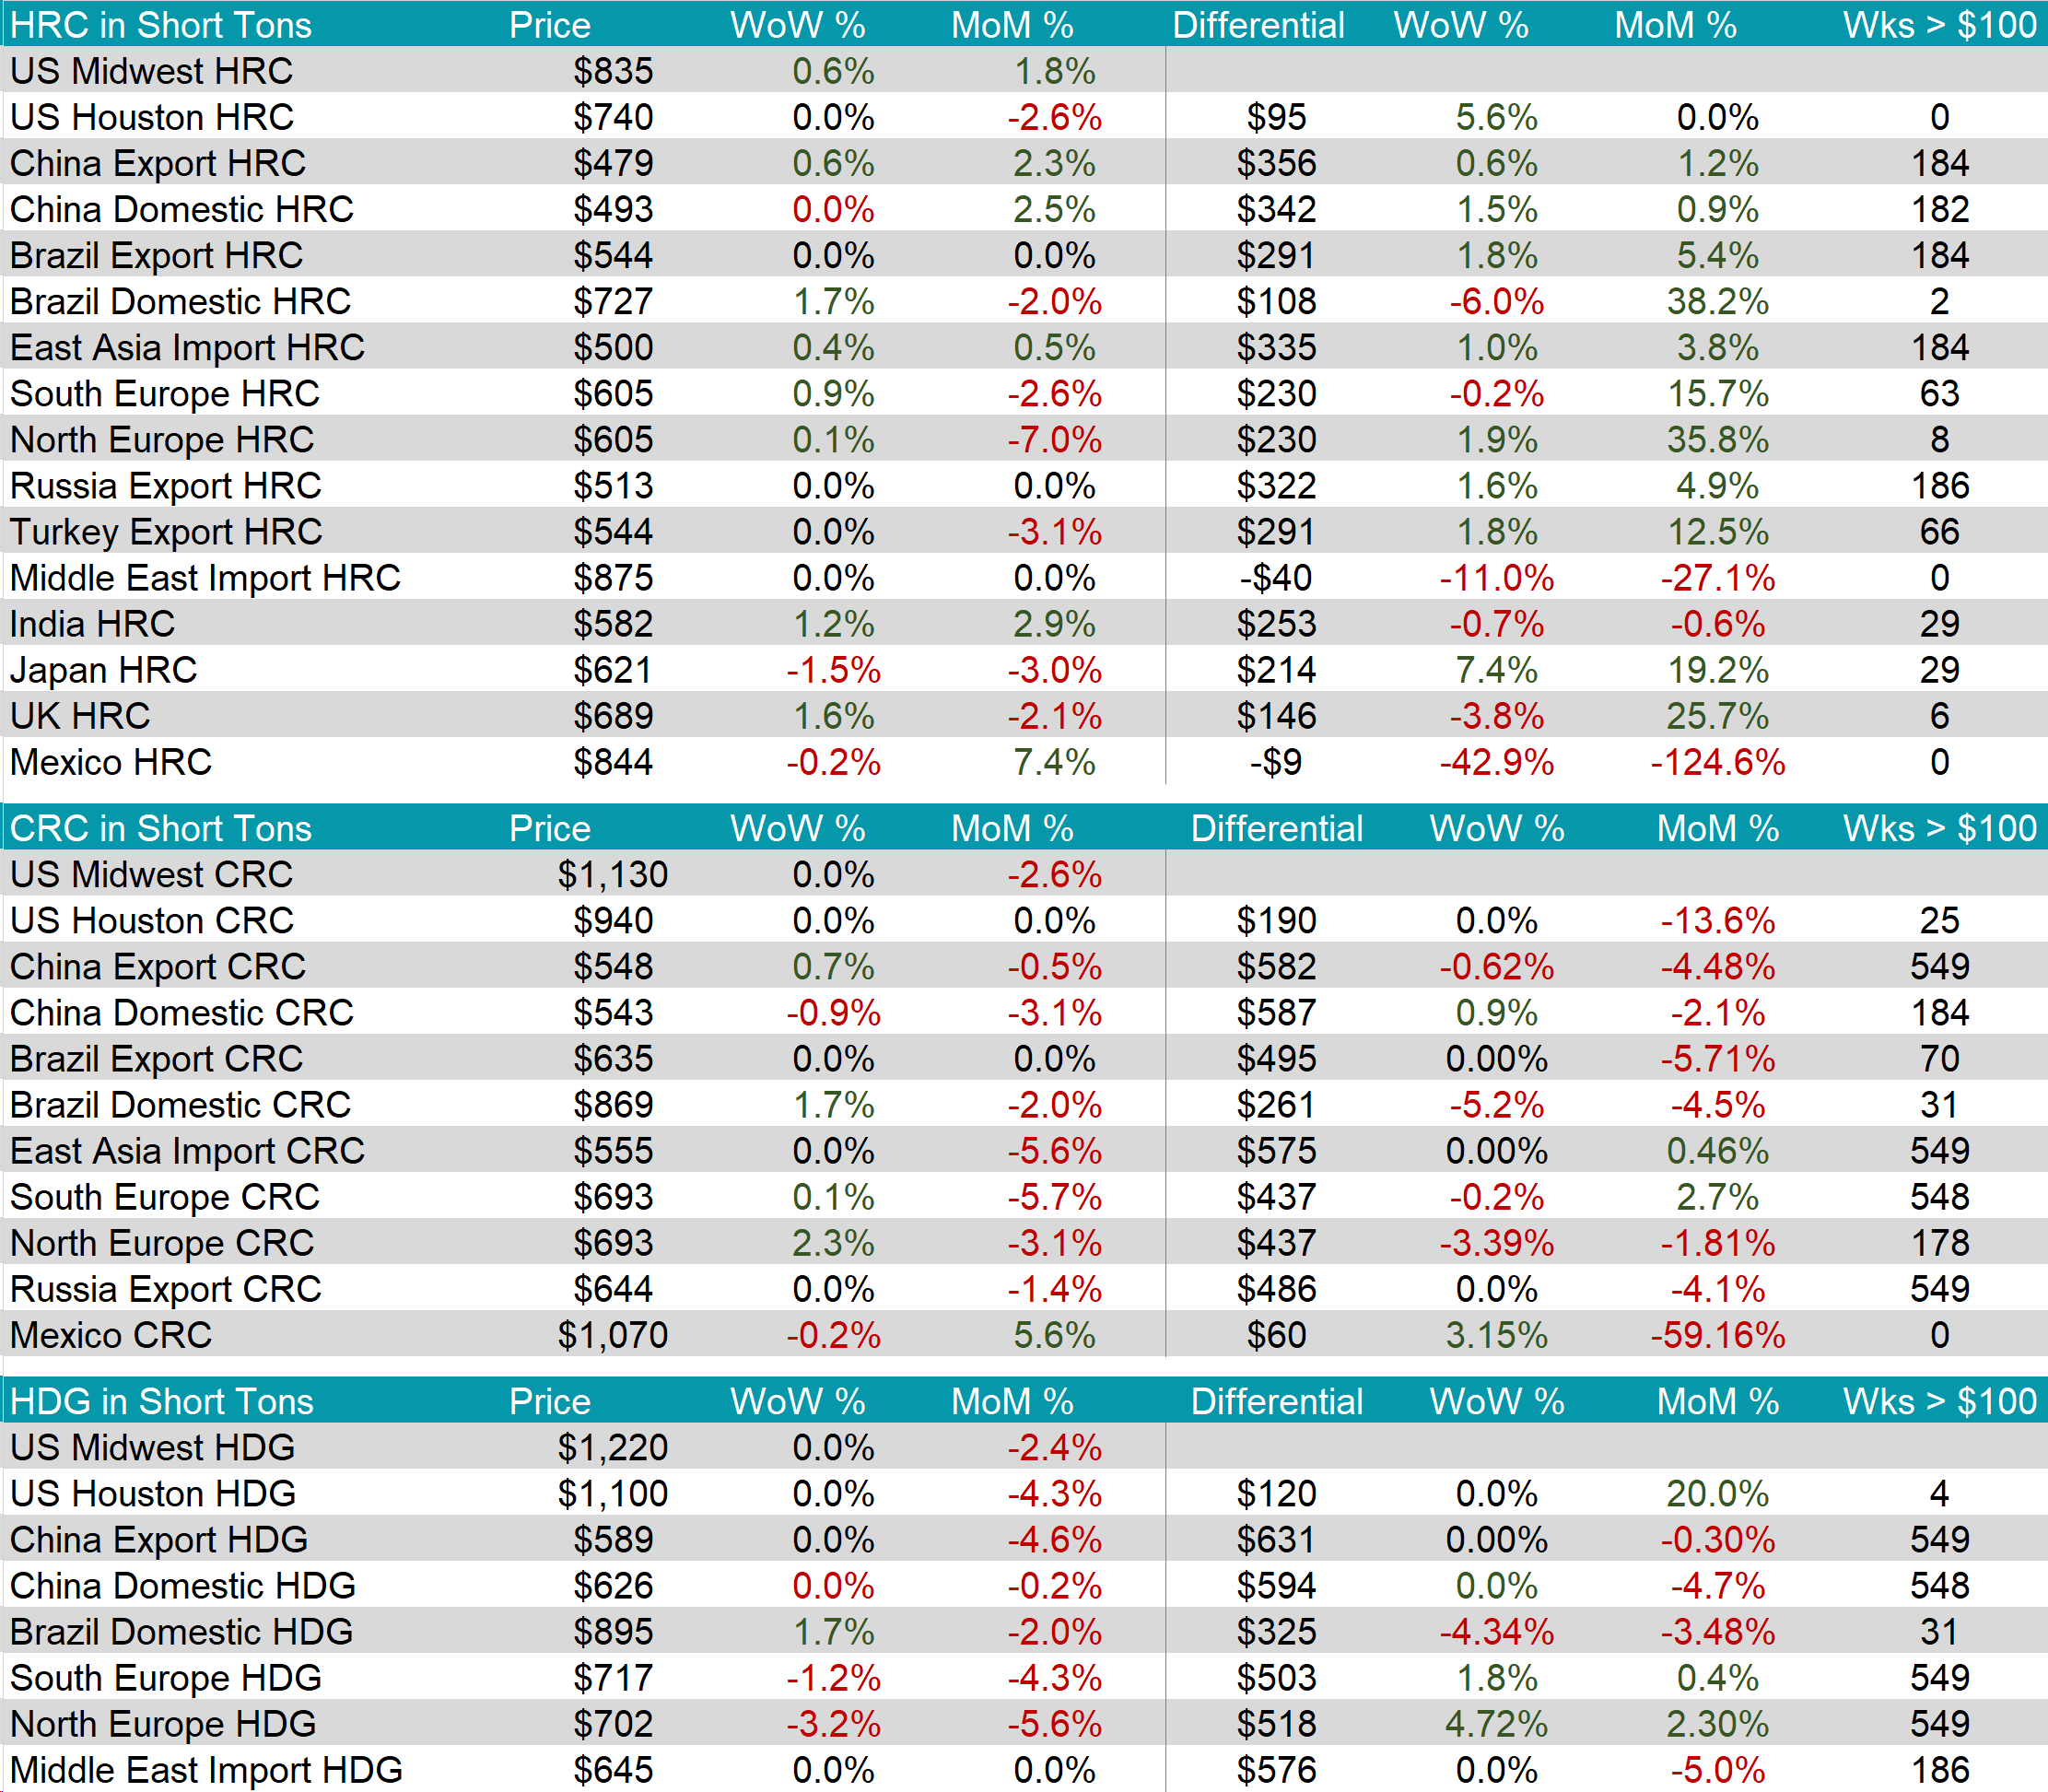
The HRC spot price slightly increased, rising by $5 or 0.6% to $835, resulting in the five-week change to be up by $25 or 3.1%. At the same time, the 2nd month future remained unchanged at $810, steadying after its recent price drops.
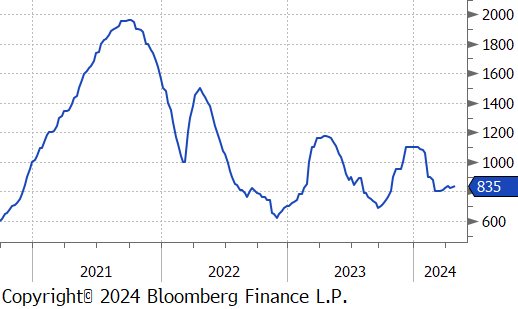
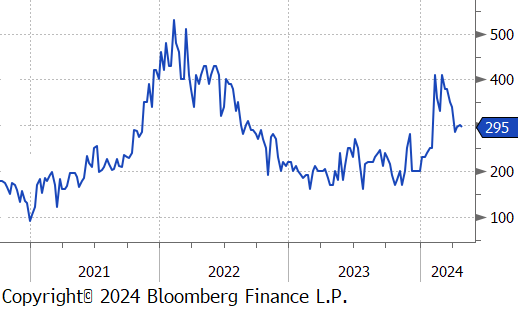
Tandem products both remained unchanged, resulting in the HDG – HRC differential to fall by $5 to $295.
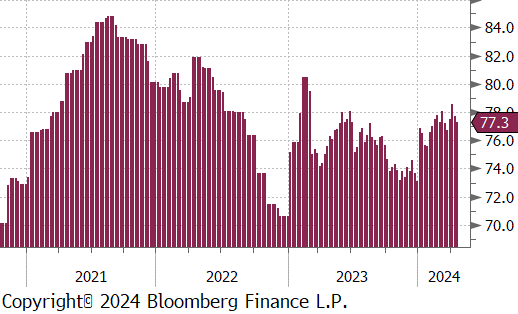
Mill production slightly scaled back further, with capacity utilization ticking down by 0.4% to 77.3%, bringing raw steel production down to 1.716m net tons.
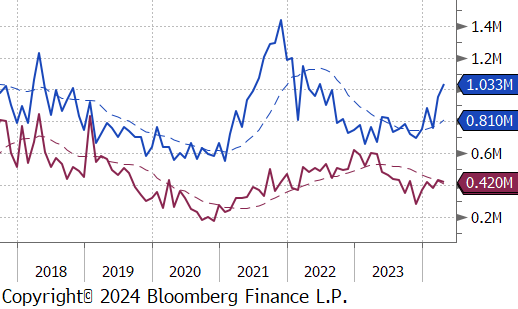
April Projection – Sheet 1033k (up 77k MoM); Tube 420k (down 15k MoM)
March Projection – Sheet 956k (up 197k MoM); Tube 436k (up 52k MoM)
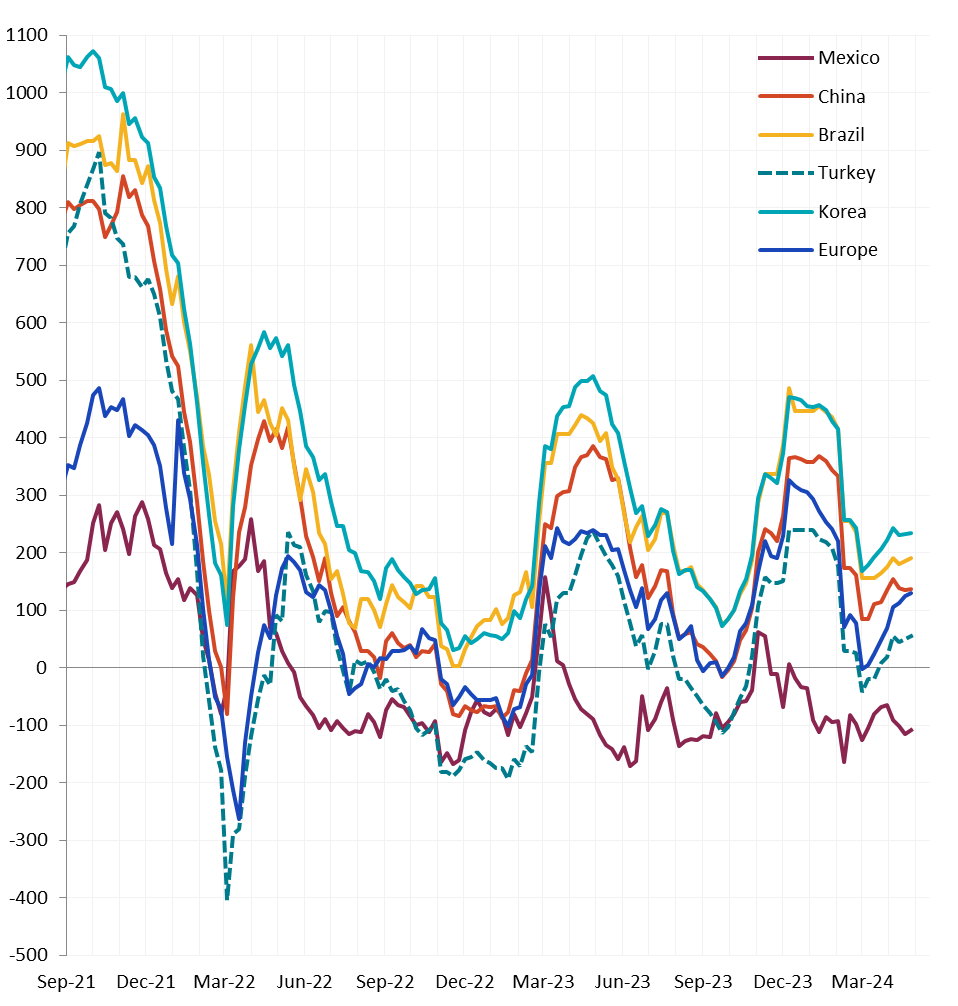
Watched global differentials were mixed this week, with the Europe HRC increasing by 0.9% and China’s Export HRC rising by 0.6%, while the Mexico HRC fell by -0.2%.
Scrap
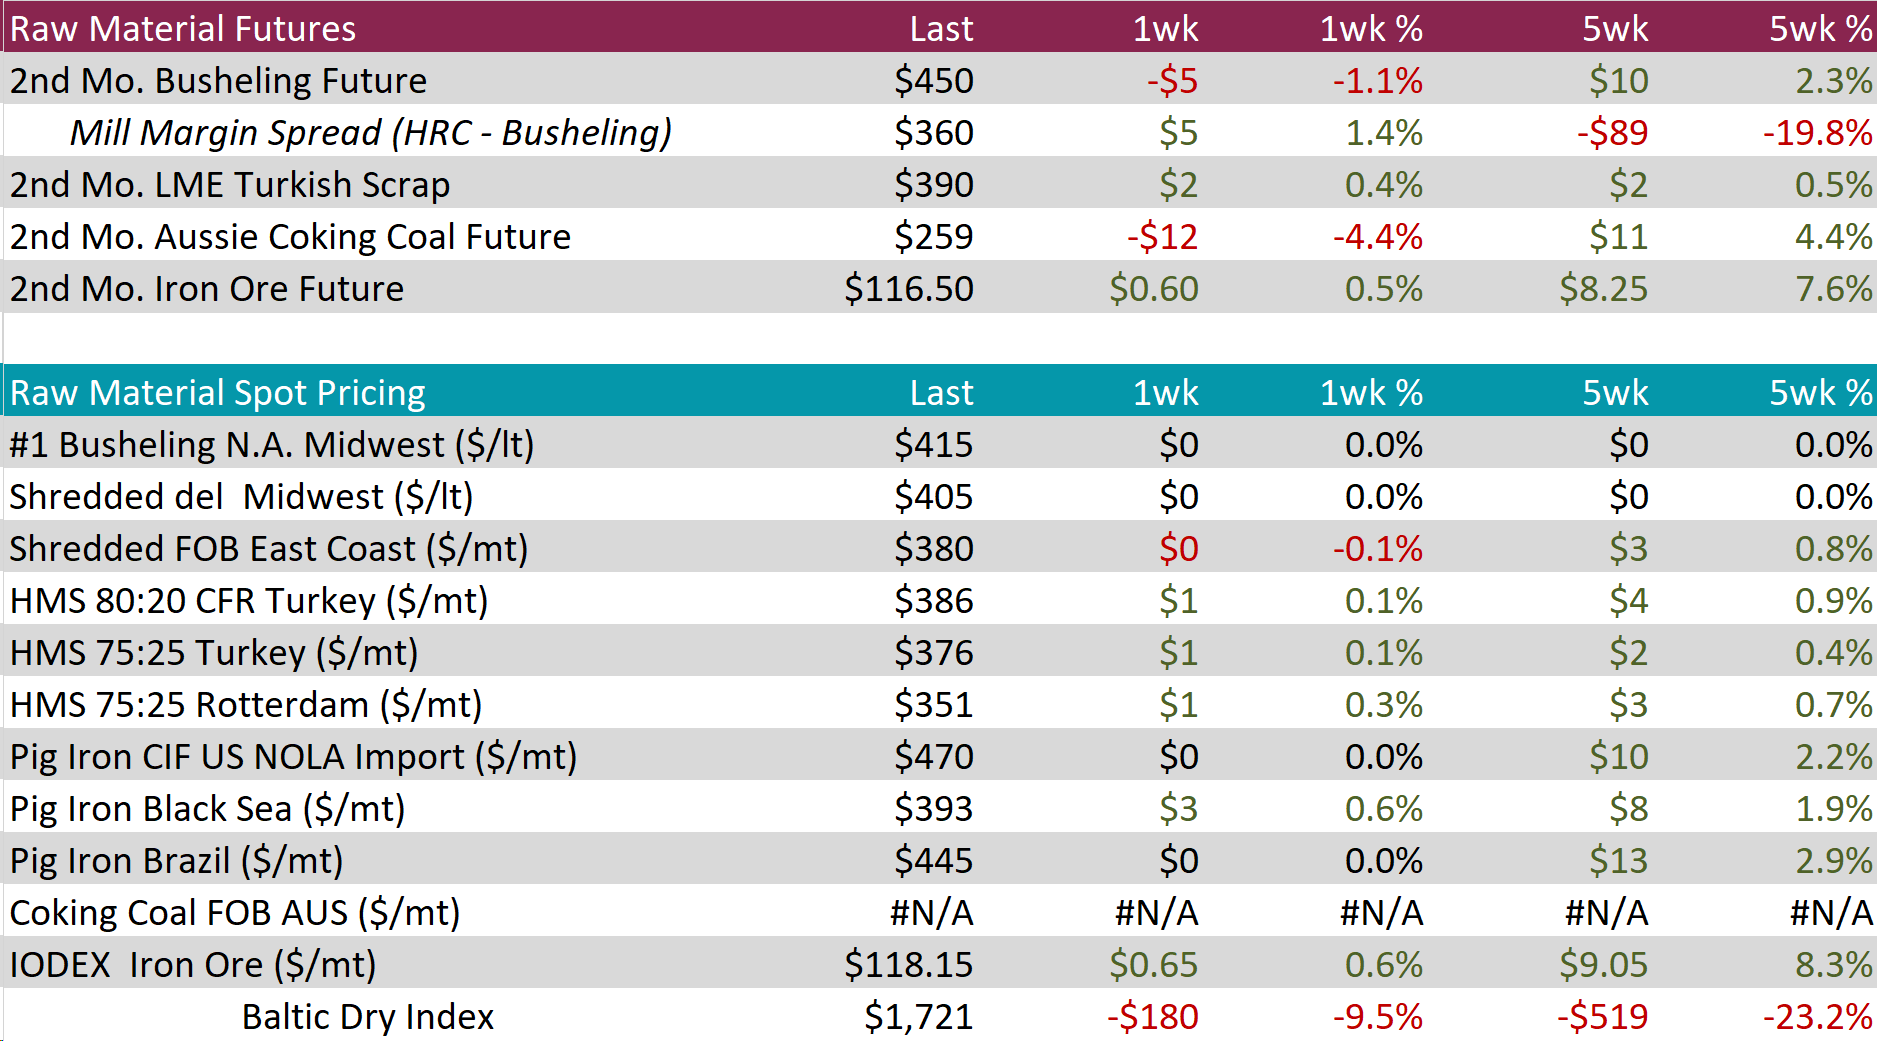
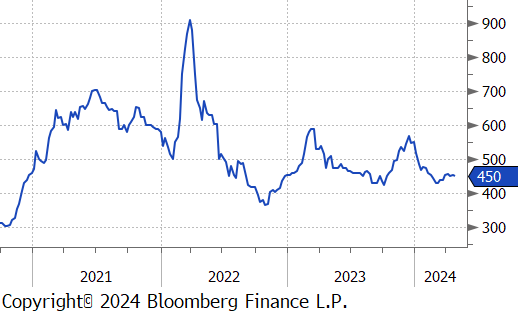
The 2nd month busheling future reversed last weeks gain, dipping back down by $5 or -1.1% to $450.
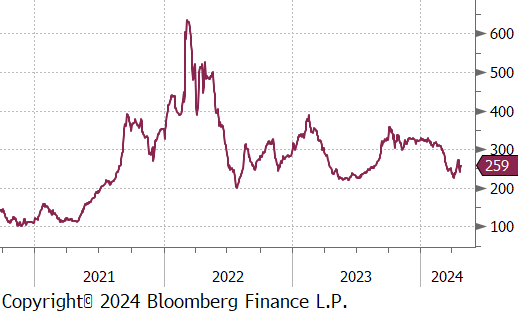
The Aussie coking coal 2nd month future dropped by $12 or -4.4% to $259, after experiencing two consecutive weeks of price increases.
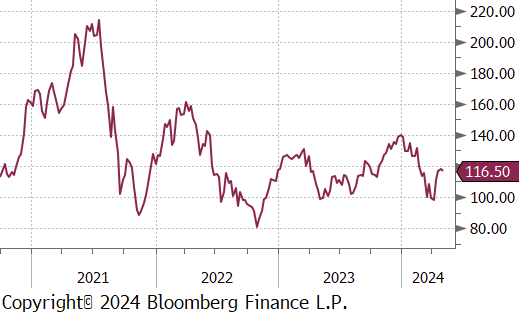
The 2nd month iron ore future rose by $0.60 or 0.5% to $116.50, resulting in the five-week change to be up by $8.25 or 7.6%.
Dry Bulk / Freight
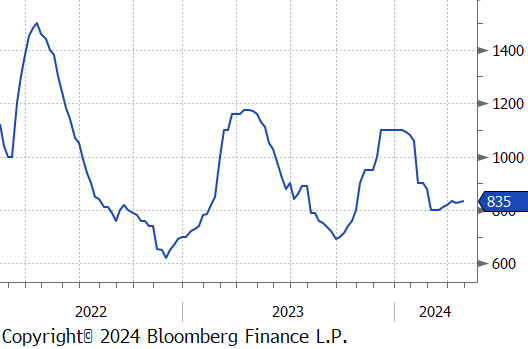
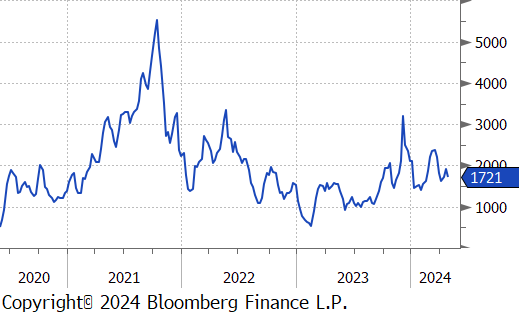
The Baltic Dry Index declined by $180 or -9.5% to $1,721, retreating from the recent price high hit last week.
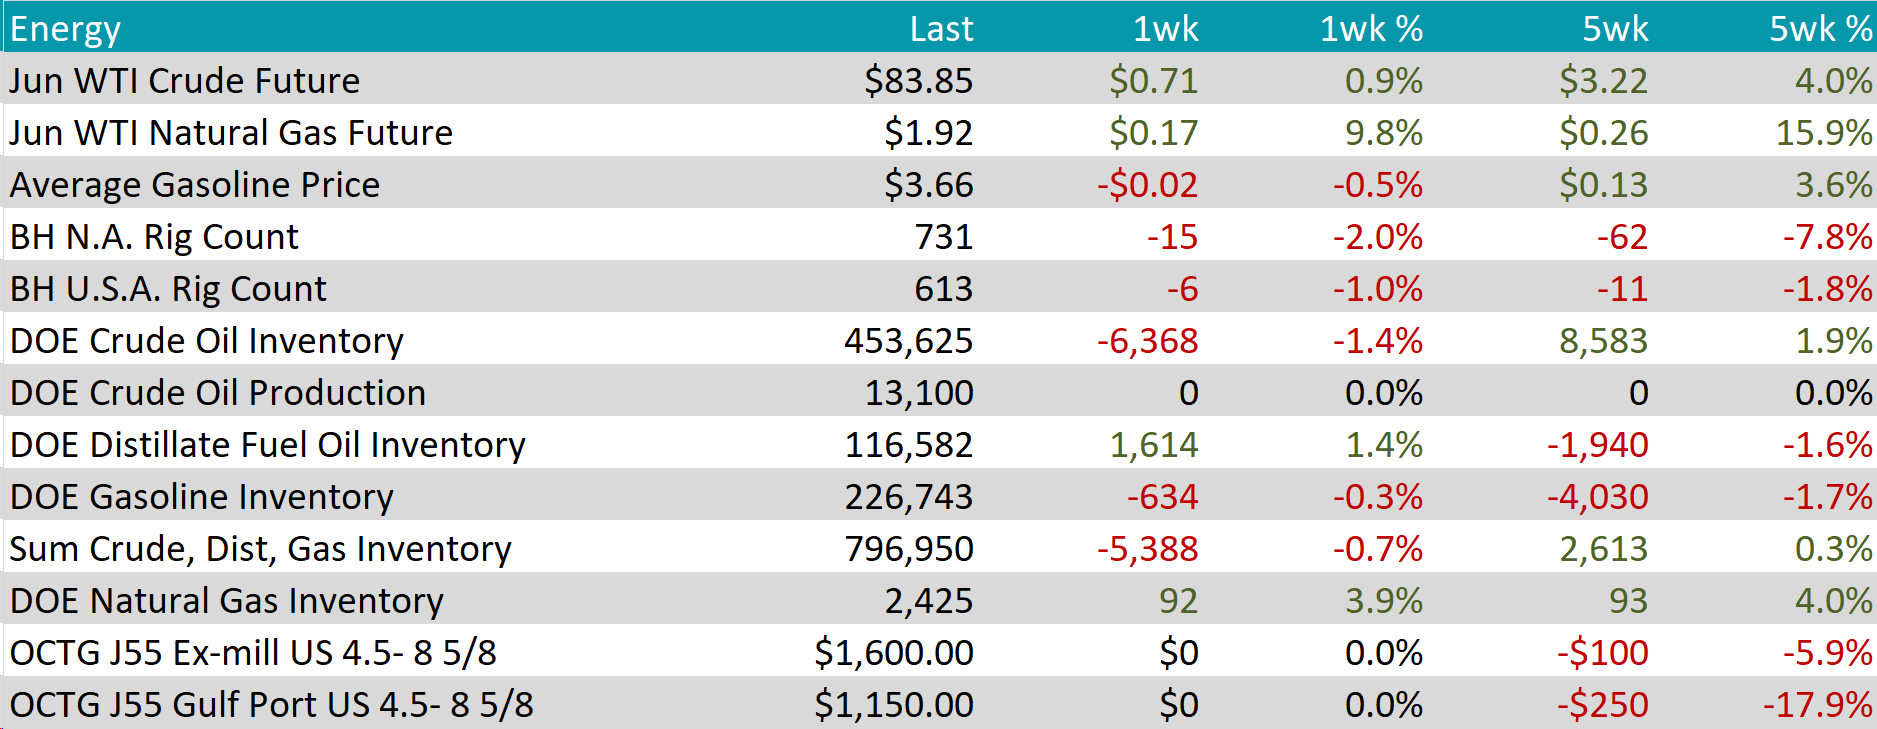
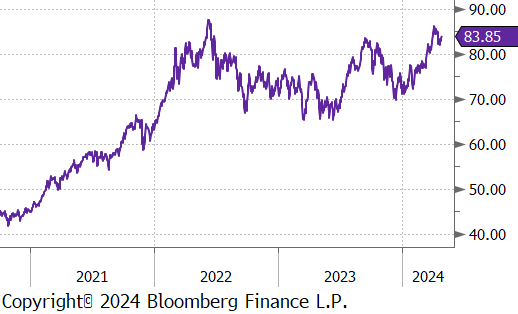
WTI crude oil future gained $0.71 or 0.9% to $83.85/bbl.
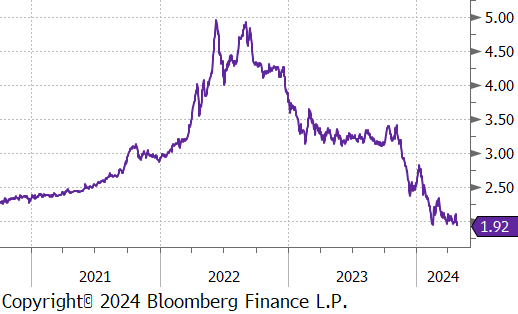
WTI natural gas future gained $0.17 or 9.8% to $1.92/bbl.
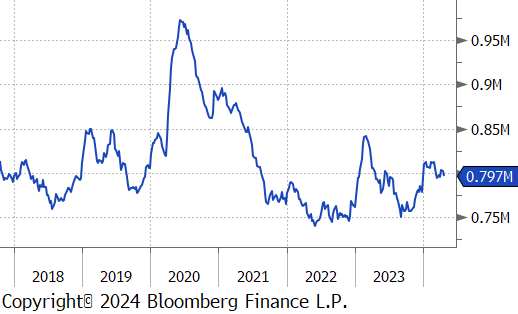
The aggregate inventory level experienced a slight decline of -0.7%.
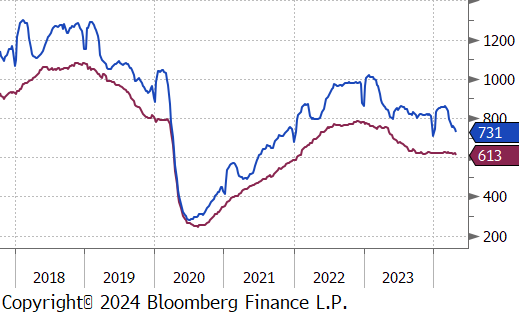
The Baker Hughes North American rig count reduced by 15 rigs, bringing the total count to 731 rigs. Meanwhile, the US rig count also reduced, dropping by 6 rigs, bringing the total count to 613 rigs.
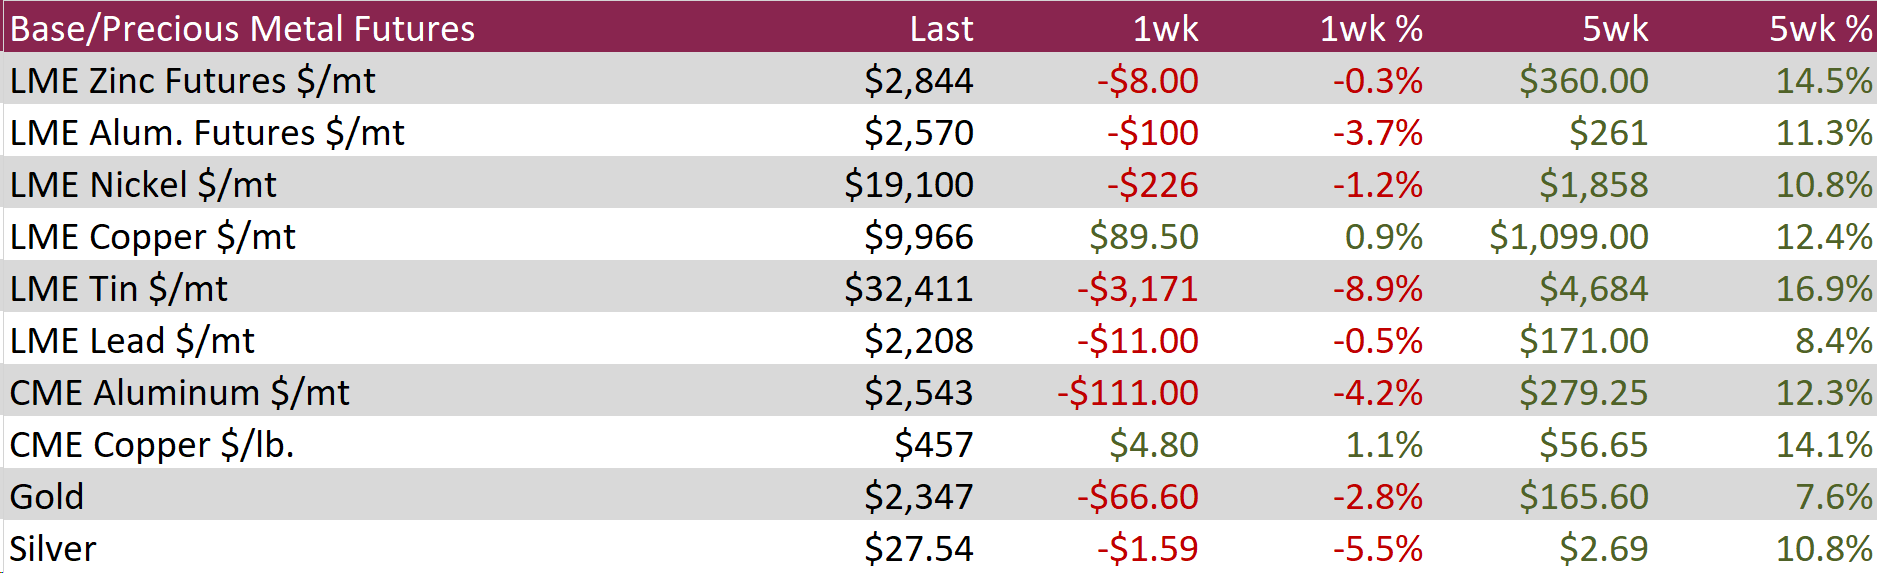
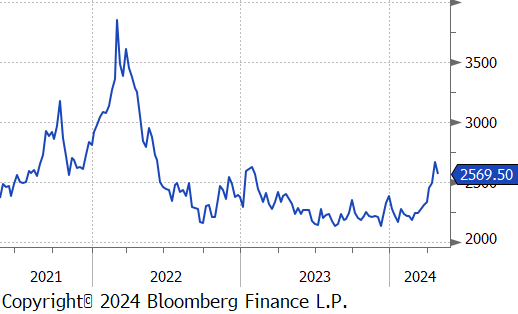
Aluminum dropped from its recent price high, falling by $100 or -3.7% to $2,570, following new sanctions by the US and UK on Russian metals. The sanctions prevent trading exchanges from accepting new supplies of aluminum, copper, and nickel produced in Russia after midnight on Friday, and ban the import of these metals into the US and UK. These measures aim to cut off a key revenue stream for Russia, which is believed to support its military activities in Ukraine. However, analysts indicate that these Western sanctions may not effectively halt Russian metal sales and could lead to a surge of older stock entering the market, thereby increasing volatility and uncertainty in commodity markets.
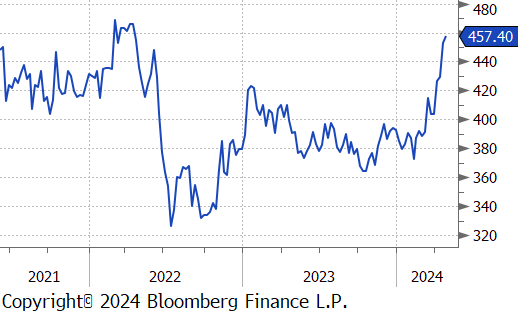
Copper soared further, rising by $4.80 or 1.1% to $457, fueled by escalating supply concerns and optimistic long-term demand forecasts, which ignited a wave of speculative buying. The supply chain has been disrupted by persistent issues in copper ore mining, highlighted by recent events such as the shutdown of Cobre Panama—one of the world’s largest open-pit copper mines, suspended operations in Zambia due to power shortages, and reduced production in South America due to political unrest. These challenges have squeezed margins for major Chinese smelters, prompting industry groups in the world’s leading copper producer to consider a 10% reduction in output this year. Additionally, the high costs associated with developing new mines have led companies to favor mergers and acquisitions over launching new projects, as evidenced by BHP’s recent bid to acquire Anglo American. Meanwhile, copper’s critical role in global electrification efforts continues to attract investment from funds.
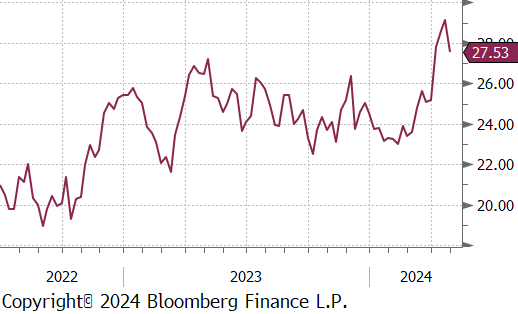
Silver retreated by $1.59 or -5.5% to $27.54, as investors digested the latest data and its implications for the Federal Reserve’s monetary policy. Both the key monthly and core inflation rates aligned with forecasts, but the annual rates exceeded expectations, underscoring persistent inflationary pressures as highlighted in the previous quarterly report. Current market sentiment has shifted to expect only one Federal Reserve rate cut this year. While higher interest rates generally diminish the appeal of non-yielding assets like silver and gold, their status as safe-haven investments partially buffers this impact, especially during uncertain times.
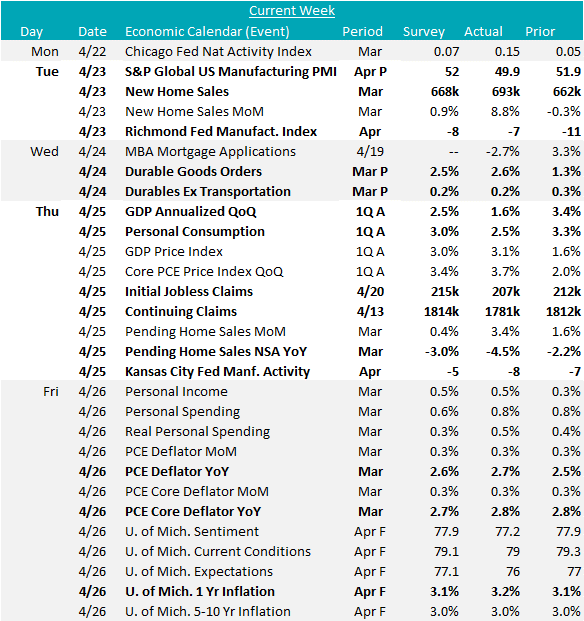
The 1Q GDP will color the week, coming in at 1.6%, well below the 2.5% median expectation. This was a negative surprise for a datapoint which had been handily beating consensus expectations, on top of that, Core PCE QoQ gave a concerning signal of prices heating up even more than the market had already anticipated. Digging in more deeply, the underlying components of GDP suggest that this may be a temporary blip on the radar. Investments and consumer spending continue to be strong, and the “miss” was the result of a reduction in inventories and a surge of imports. Likely the consequence of changing market expectations on cuts and a strong dollar.
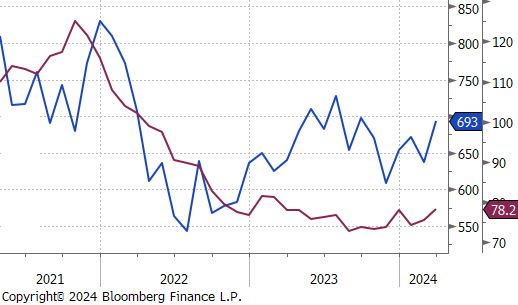
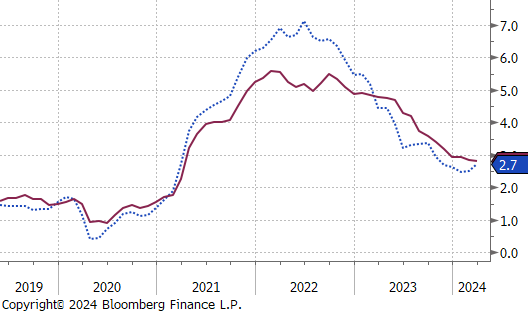
The Core PCE YoY deflator continued the recent trend of stickier prices from CPI & PPI, printing up 2.7%, above expectations of a 2.6% increase in March. The April final University of Michigan consumer sentiment survey provided confirmation of the concerning signal that we have been closely watching, with 1-yr inflation expectations coming in at 3.2%, above the preliminary reading of 3.1%. This is the highest reading since November, and untethered expectations are a serious risk that could keep the FOMC hawkish for longer.
The remainder of the housing data for March came in as well. New home sales were up 8.8%, beating expectations of a 0.9% increase, continuing their uptrend. Pending home sales SA were up 3.4% compared to expectations of a 0.4% increase, but these figures continue to be down compared to last years levels.
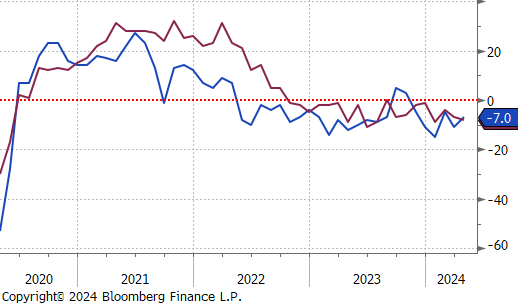
Finally additional FED manufacturing surveys were released this week, with mixed results. Richmond printed up to -7, from -11, beating expectations of a -8 print, while Kansas City printed down to -8, from -7, below expectations of a -5 print. Overall, manufacturing surveys have been trending higher after last months concerning print.