Flack Capital Markets | Ferrous Financial Insider
April 7, 2023 – Issue #374
April 7, 2023 – Issue #374
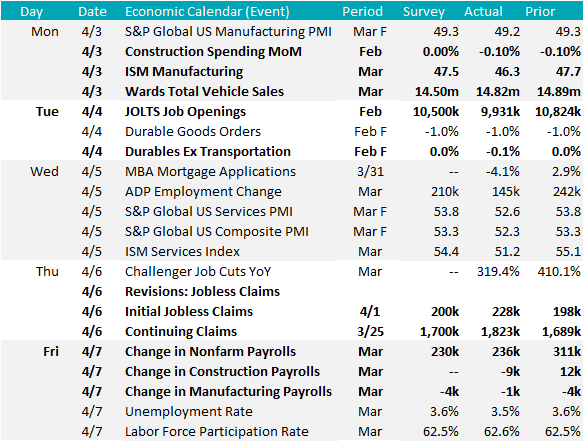
While other economic data released in the beginning of the month has a more direct impact on the steel market and prices, this week also provided a refresh of important labor market data. The significance of labor market and inflation data cannot be understated at a time when the Fed is attempting to determine where to pause its rapid interest rate hiking cycle.
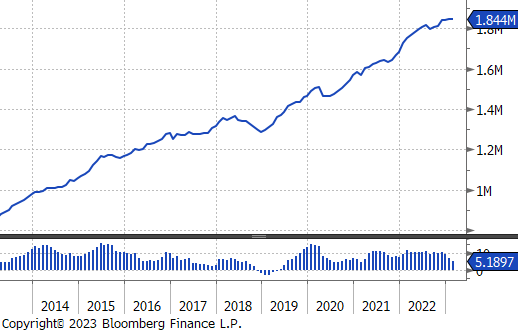
The most watched data was the change in non-farm payrolls, and unemployment rate, both released on Friday the 7th. Payrolls increased at a slower pace in March but beat consensus expectations for the 12th month in a row. On top of that, the unemployment rate fell in March, due to an increase in the labor force participation rate, meaning new entrants into the labor market were filling openings. These factors together signal more strength in the labor market, although it is showing preliminary signs of cooling.
To dig in further, we look at JOLTS job openings and jobless claims. Compared to historical data, job openings are shockingly high, although they have been trending lower, the ratio of job openings to unemployed worker is 1.7. While there is a mismatch in skills for many of these positions, this is dynamic of more openings than workers explains much of the upward wage pressure which is a major concern for the FED due to the risk of a wage price spiral and reaccelerating inflation. At this point, the trend is moving in a more manageable direction, but the risk remains. Turning to jobless claims, we are starting to see the uptick that has been long expected in the data after the increased rate of layoffs started to be announced at the end of last year. As it currently stands the increase in continuing and initial claims still leaves levels well below historical norms, but the weekly update will provide our best look at how these dynamics are evolving.
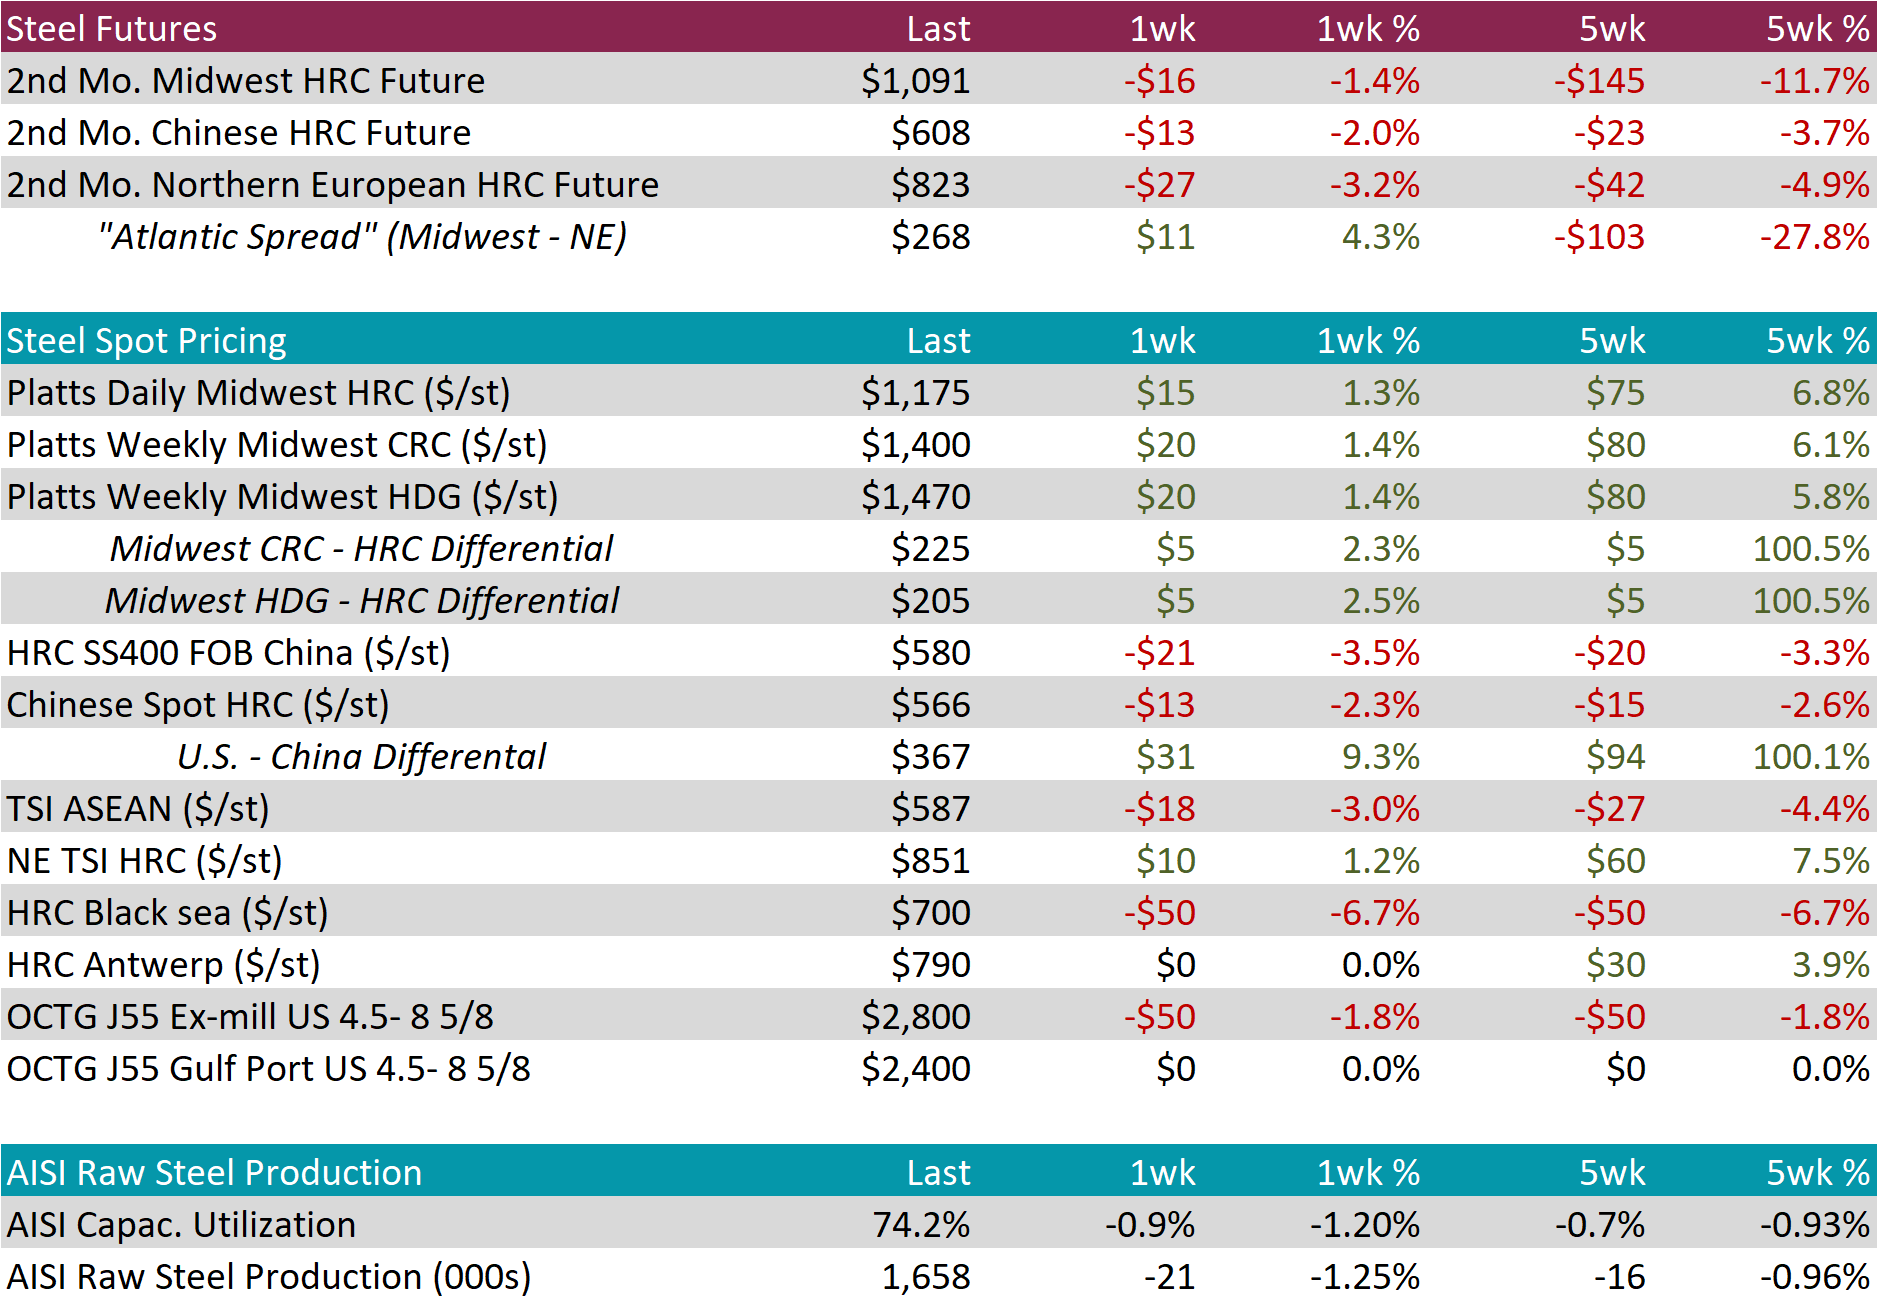
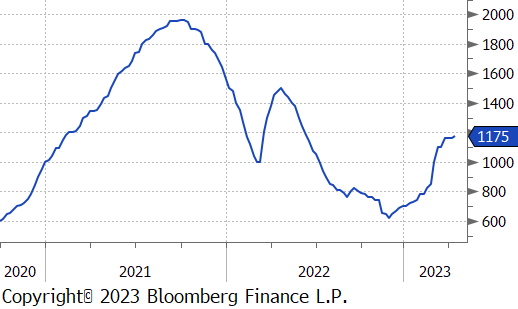
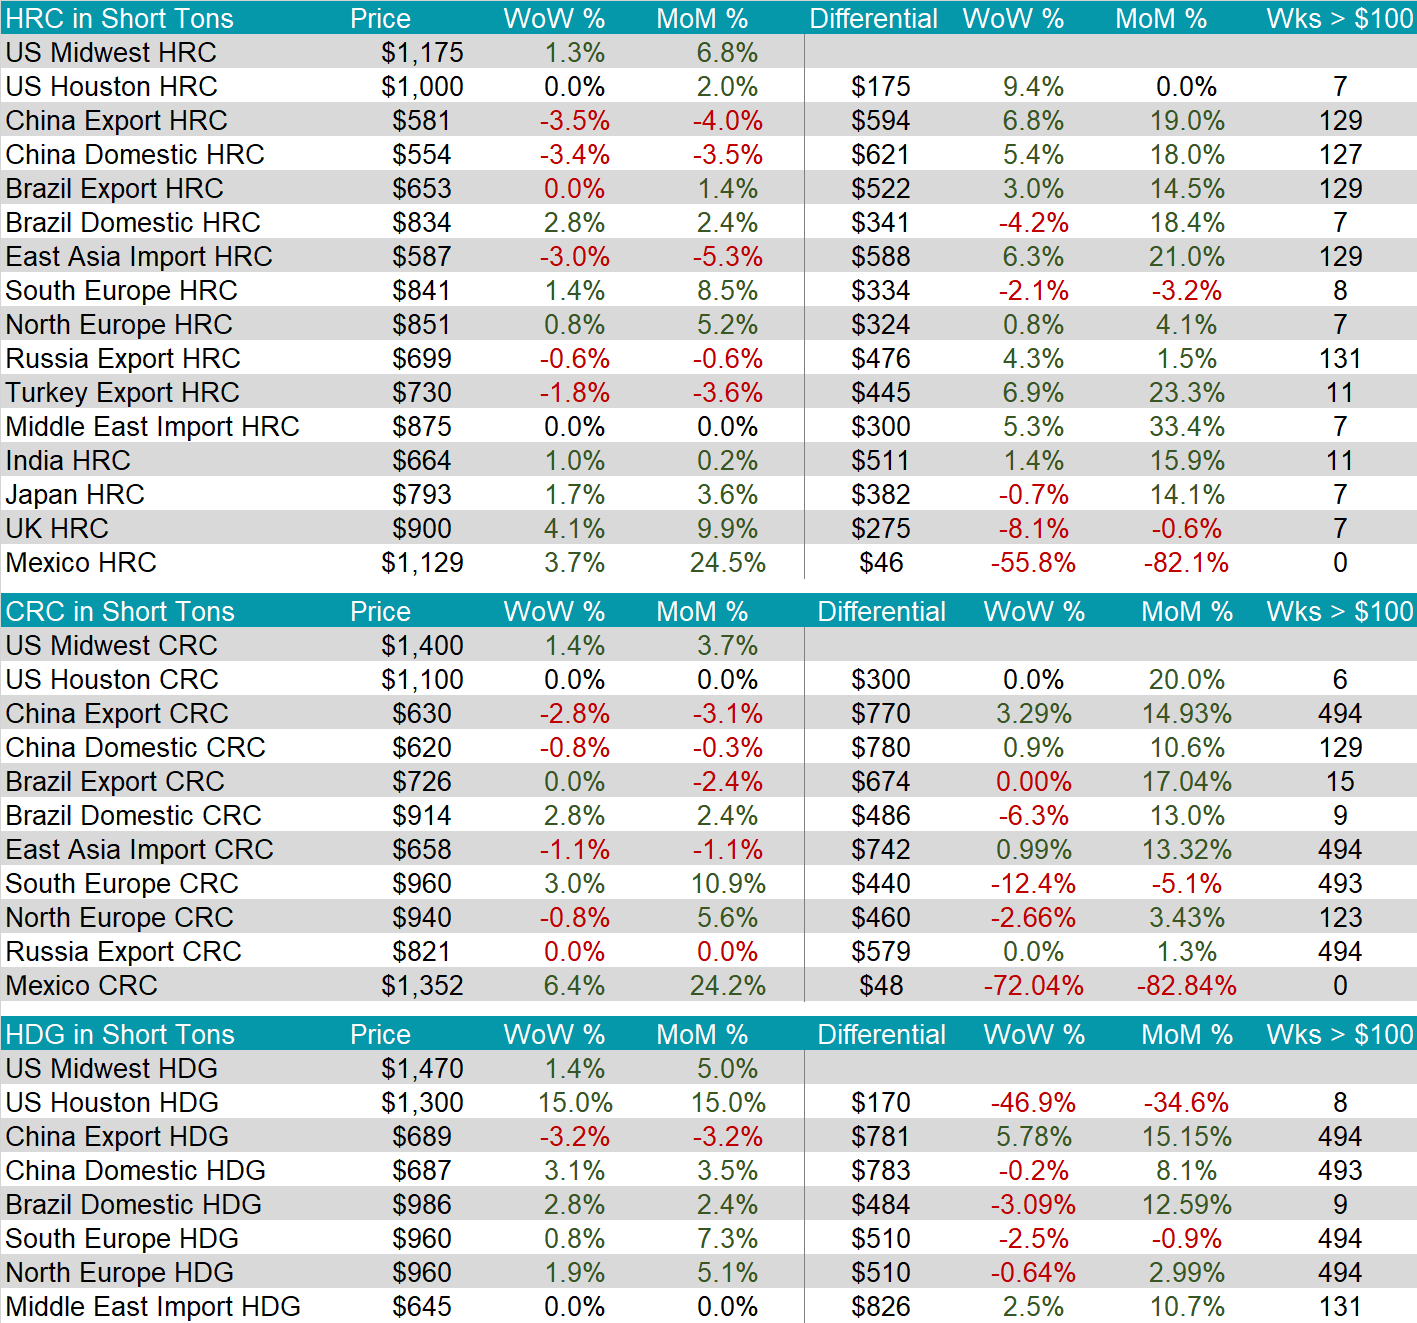
After plateauing around the $1,160 price increase announcements drove U.S. domestic HRC another step higher, up 1.3% on the week. In the futures market, the May future followed the recent trend and continued to sell off, down 1.4%. Tandem products were both higher 1.4% higher as well.
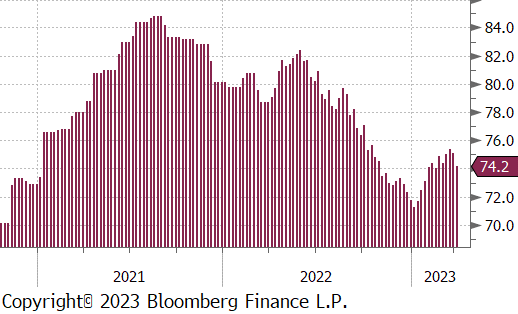
Interestingly, domestic production fell further last week, with raw steel capacity utilization now down another 0.9% to 74.2%. In the beginning of the year, production moved sharply higher along with prices, however, it has leveled off since the end of February.
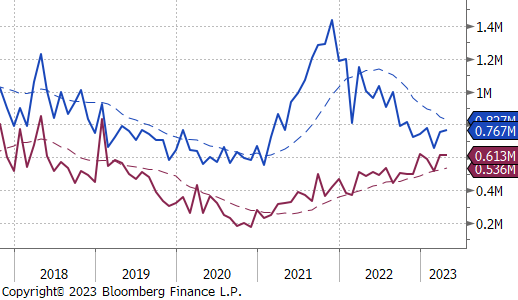
April Projection – Sheet 767k (up 12k MoM); Tube 613k (down 2k MoM)
March Projection – Sheet 755k (up 97k MoM); Tube 616k (up 97k MoM)
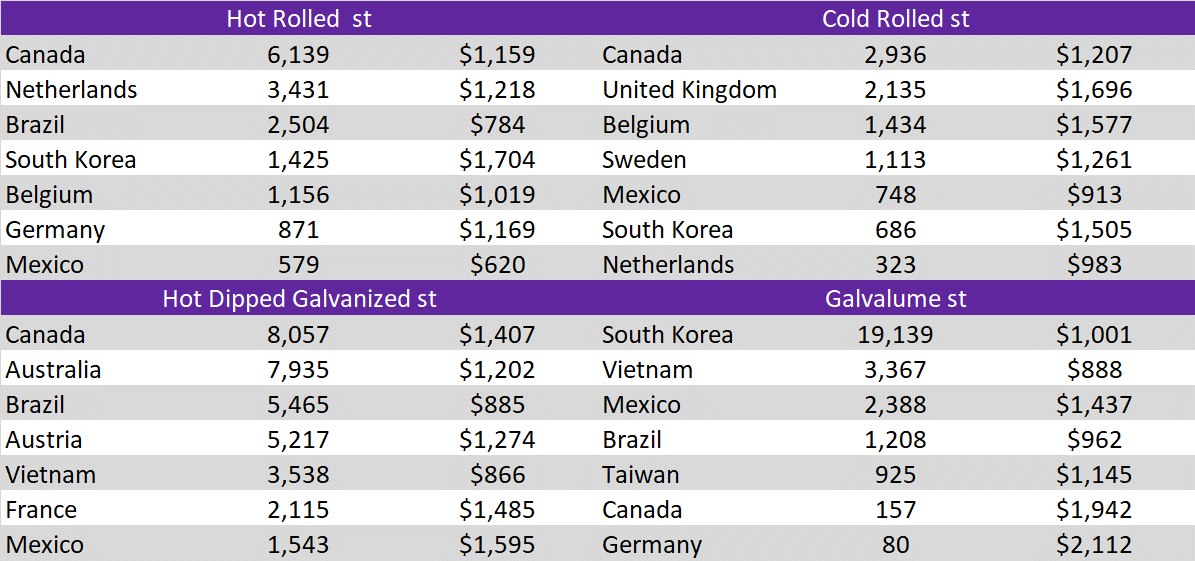
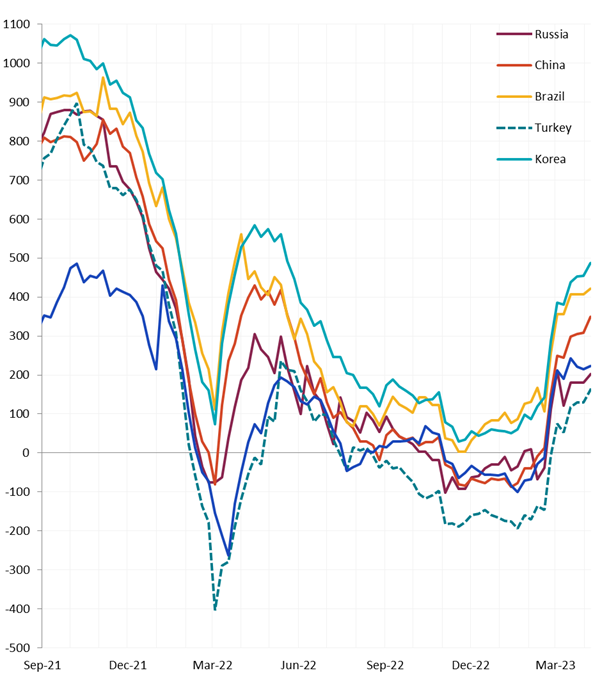
Differentials from all the closely watched countries increased again last week. This was partially driven by higher U.S. prices, however, steel in Asia continued it’s 3-week trend lower as well.
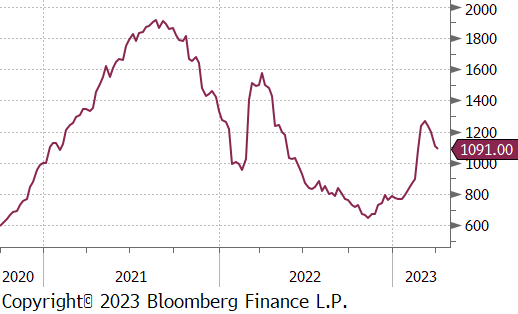
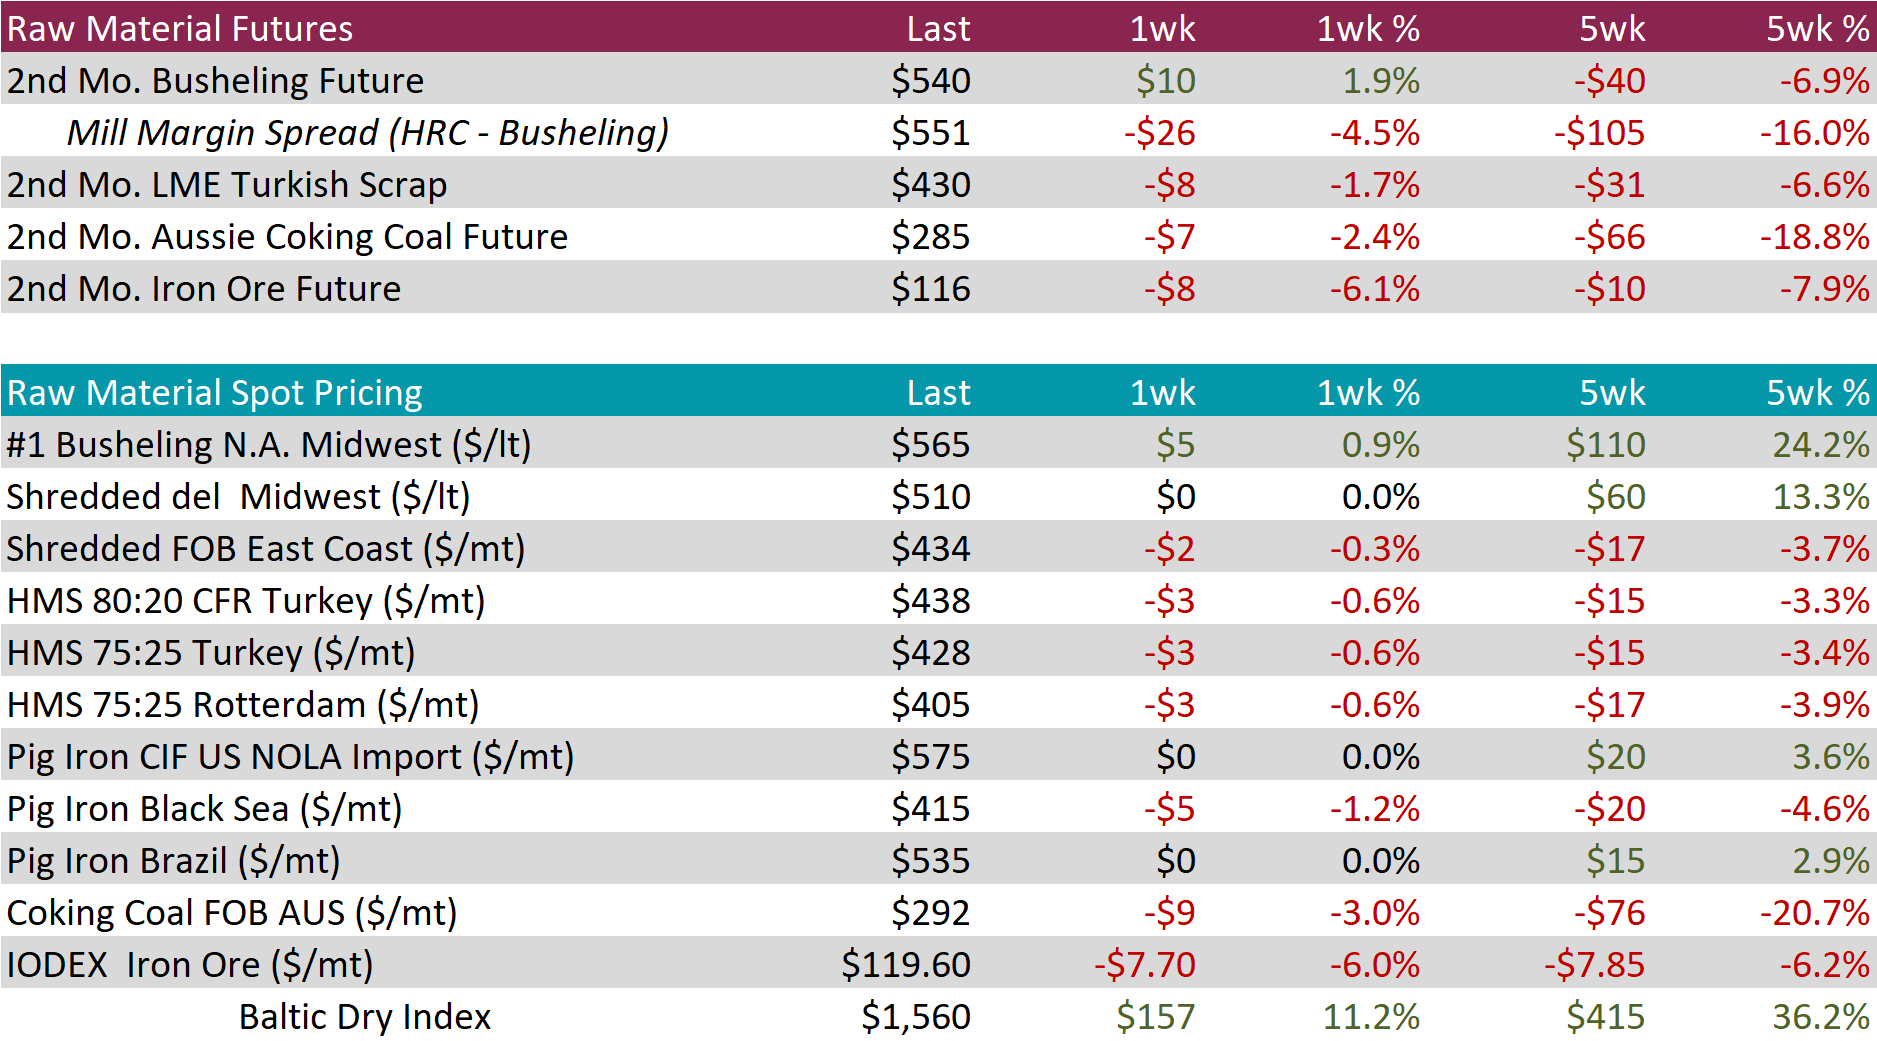
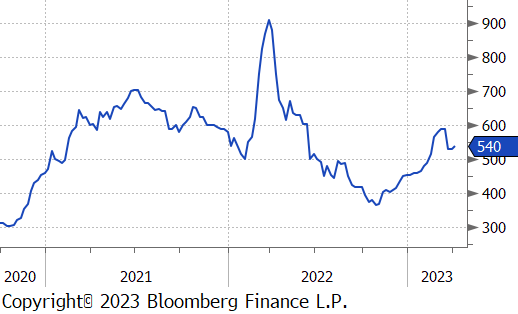
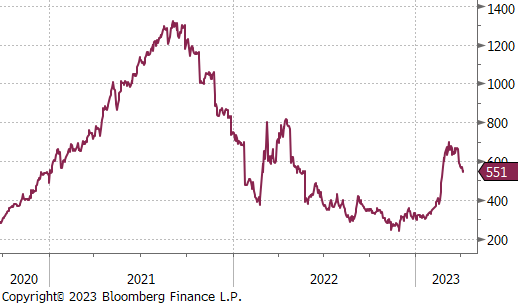
Domestic scrap spot prices were unchanged on the week, ahead of the monthly settlements. In the futures market, the May busheling future was up $10, or 1.9% after selling off and plateauing since mid-March. Higher busheling and lower HRC caused the May mill margin to contract further, however it remains well above 2H22 levels.
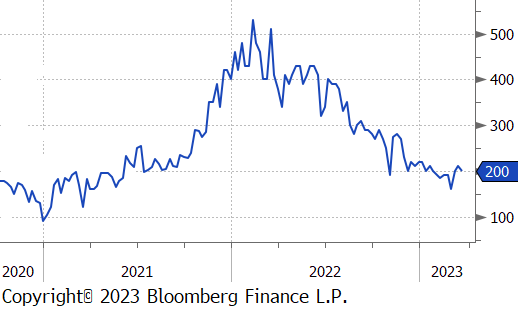
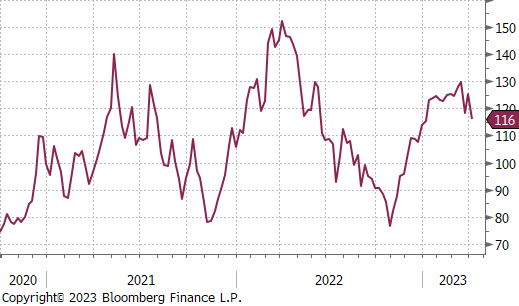
The May Iron ore future broke below it’s recent trading range of $120-130, last week, down $8, or 6.1%, to $116.
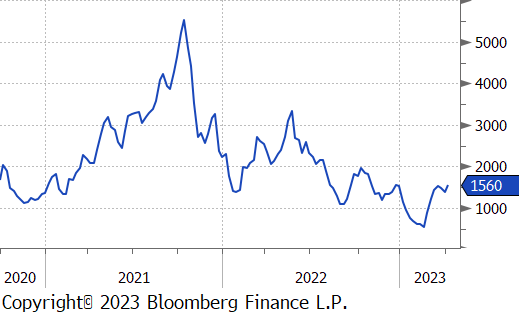
Dry Bulk / Freight
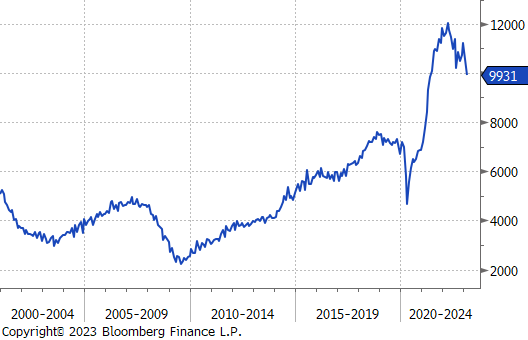
The Baltic dry index rebounded this week, up $157, or 11.2%.
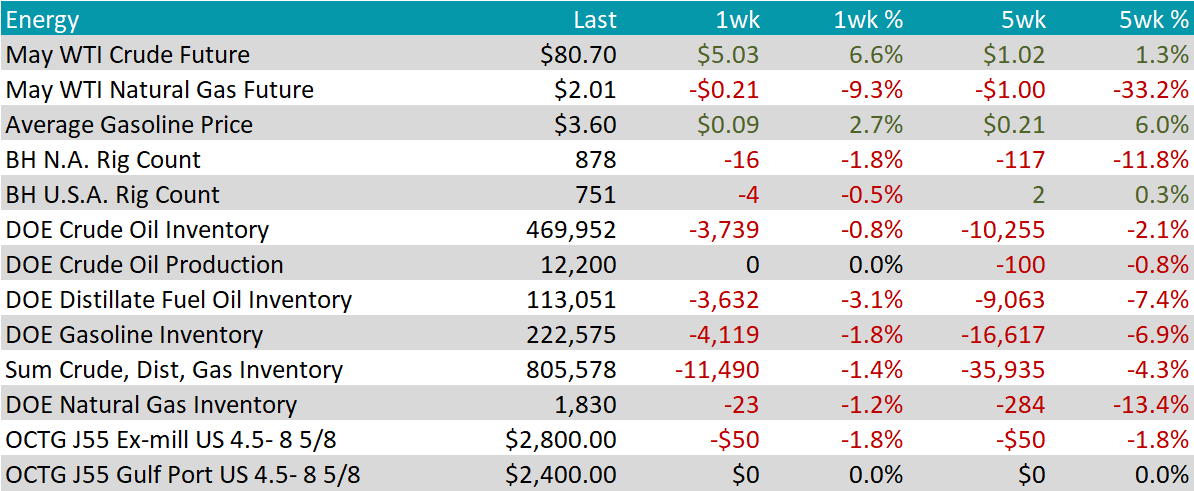
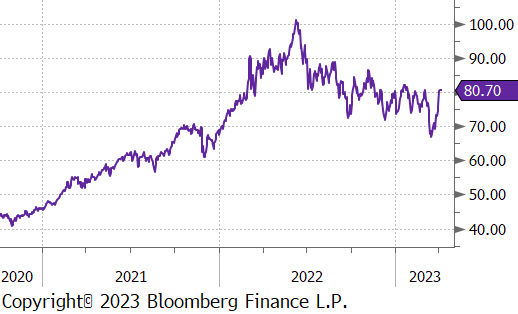
WTI crude oil future gained $80.71 or 6.6% to $80.70/bbl.
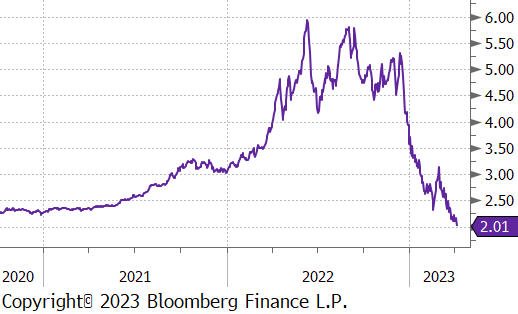
WTI natural gas future lost another $0.21 or 9.3% to $2.01/bbl.
Early in the week, OPEC+ announced significant and unexpected production cuts. This caused crude prices to jump on April 3rd, and then hold steady around the current level for the remainder of the week.
The named reason behind the move was concern around weak global demand. At the same time, the production cuts also appear to be aimed at both the U.S. and speculators who were the “most short” they have been since August 2016. The U.S. has been considering legislation known as NOPEC which would allow seizure of OPEC assets within the U.S. territory if price collusion is proven. Additionally, the Biden administration long claimed they would begin refilling the strategic petroleum reserves when prices were below $70 for a prolonged period. These cuts and resulting higher prices impact those plans and increase the risk of higher global inflation.
The aggregate inventory level was down another 1.4%. After a rapid restock, inventories are clearly trending lower going into the warmer part of the calendar.
The Baker Hughes North American rig count was down 16 rigs, and the U.S. rig count was down 4 rigs.
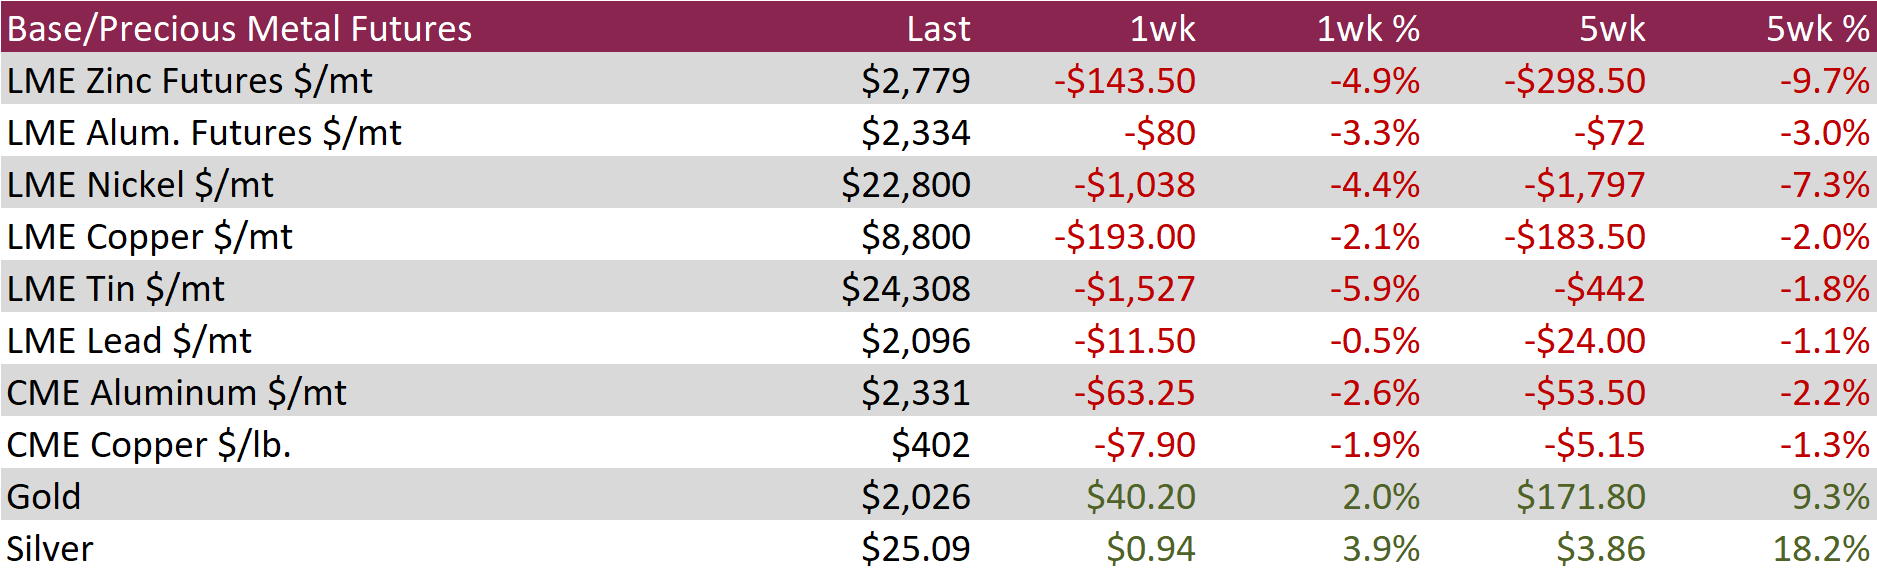
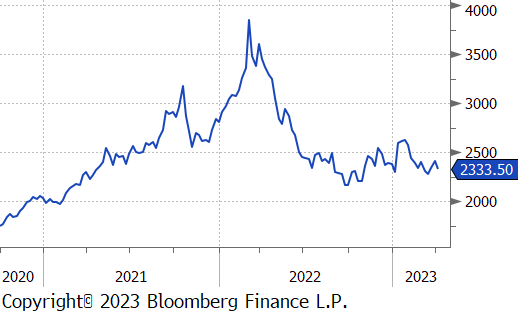
Aluminum futures on the LME erased the prior two-weeks gains, falling 3.3% to $2,334 in a shortened holiday trading schedule. There was very little aluminum-specific news to hit the wire, however, China urged futures companies to analyze the iron ore market in an objective manner to avoid exaggerating the atmosphere of price increases, dampening sentiment toward the metals complex more broadly.
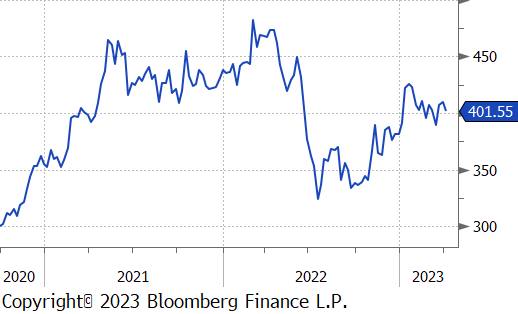
LME Copper snapped a two-week winning streak, as well, falling 2.1% to $8,800. However, copper did find supportive price action later in the week after data showed that China’s services activity accelerated in March, bolstering hopes for an improvement in the economy. The Caixin China services purchasing managers index rose to its highest since November 2020, well above expectations.
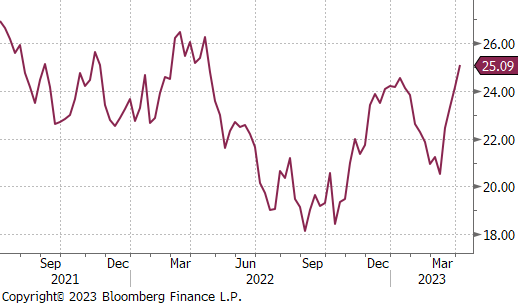
Silver rallied 3.9%, marking its largest weekly gain since March 17th when it rallied 9.5%. Silver has traded higher for four consecutive weeks and is up 18.2% in the last 5 weeks, outpacing gains in Gold during that same time frame. Money managers increased their bullish silver bets to the most bullish in nine weeks.
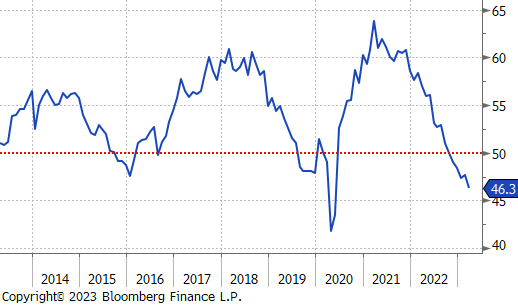
Data released at the beginning of the month provide a mixed snapshot of recent demand. Manufacturing data continues to disappoint and is cause for concern, after the ISM Manufacturing PMI printed below expectations and all three demand subcomponents (new orders, backlogs, and new export orders) showed further contraction. The topline index has now been in contraction territory for 5 months.
Auto sales dipped slightly but came in above expectations, reaffirming the thesis that there is strong backlog for cars after years of supply chain issues and higher interest rate environment.
Seasonally adjusted total construction spending for February was down slightly, 0.1%, but remains 5.2% higher than last year’s levels. This continues to be driven by strong private non-residential spending, up 19.4% compared to last year, while private residential spending is down 5.5% over the same period.
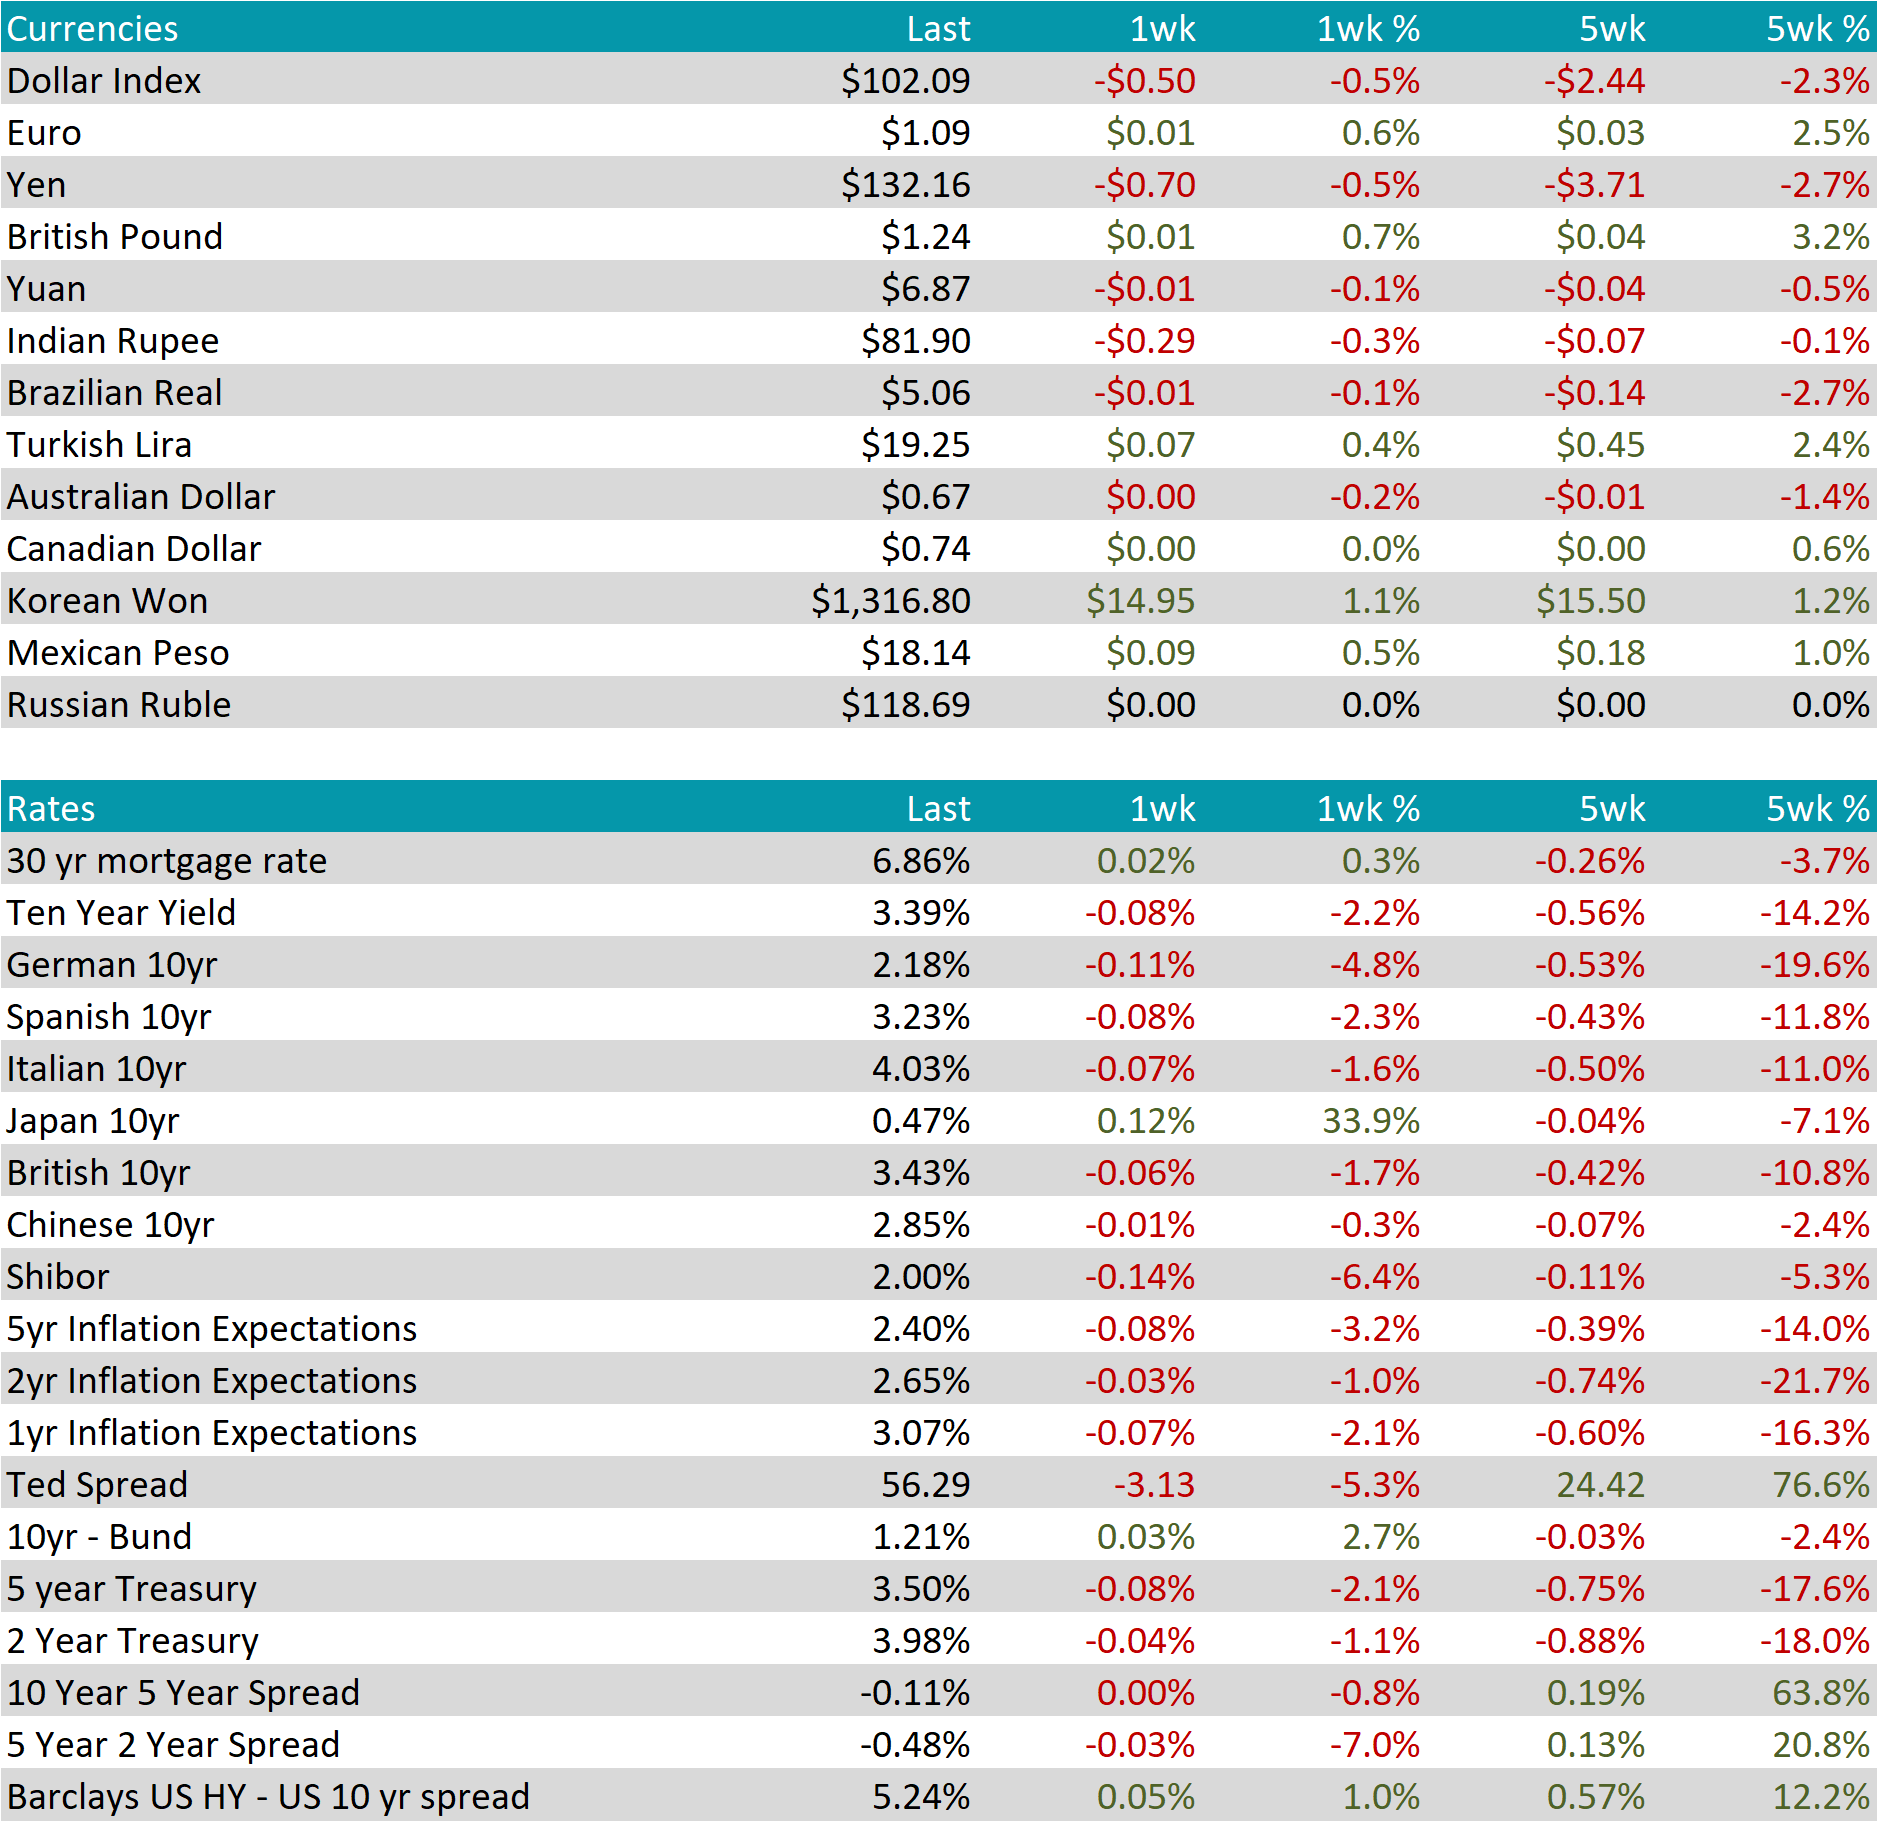
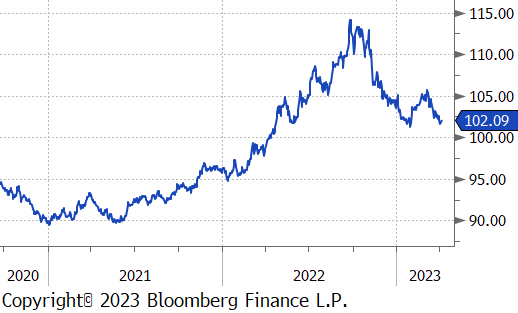
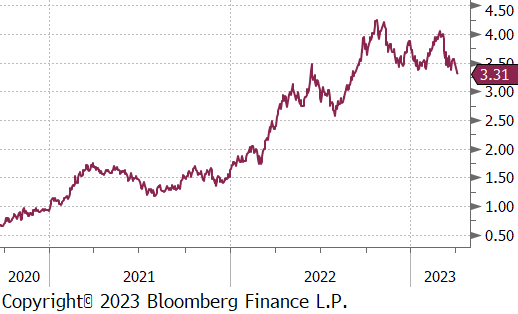
This week, the U.S. dollar lost $0.50, while the British pound gained 0.7% and even out above 1.25 on April 4th, the highest level since June 2022. This reflects investors’ expectations that the Bank of England will raise interest rates further to combat inflation. UK inflation unexpectedly rose to 10.4% in February with food inflation reaching an all-time-high in March. The growing divergence in policy outlook for the U.K. and U.S. has driven the GBPUSD cross up from 1.18 in early March to its current level of 1.24.
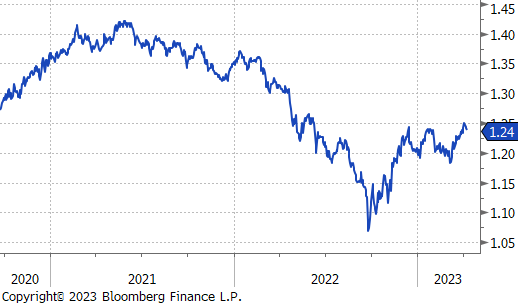
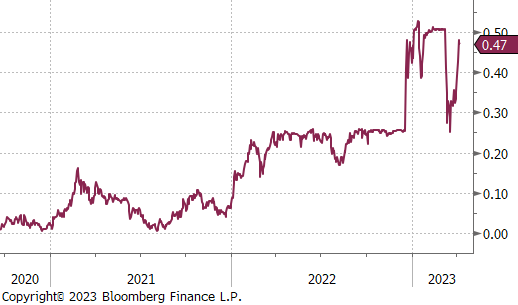
The U.S. bond market was noticeably less volatility last week as the conversation returned to the Federal Reserve with most investors expecting a 25bps increase in the fed funds rate in May. The U.S. 10yr treasury yield was down 8 bps to 3.39%. In contrast, the Japanese 10yr yield moved aggressively this week, climbing 12 bps to 0.47%. The move was largely driven by speculation that there may be adjustments to the central bank’s ultra-easy monetary when the new Bank of Japan Governor takes office. The Japanese yen has now appreciated on the dollar by 2.7% over the past 5 weeks.