Flack Capital Markets | Ferrous Financial Insider
August 16, 2024 – Issue #445
August 16, 2024 – Issue #445
Overview:
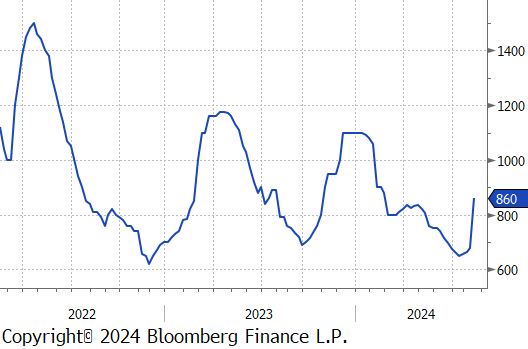
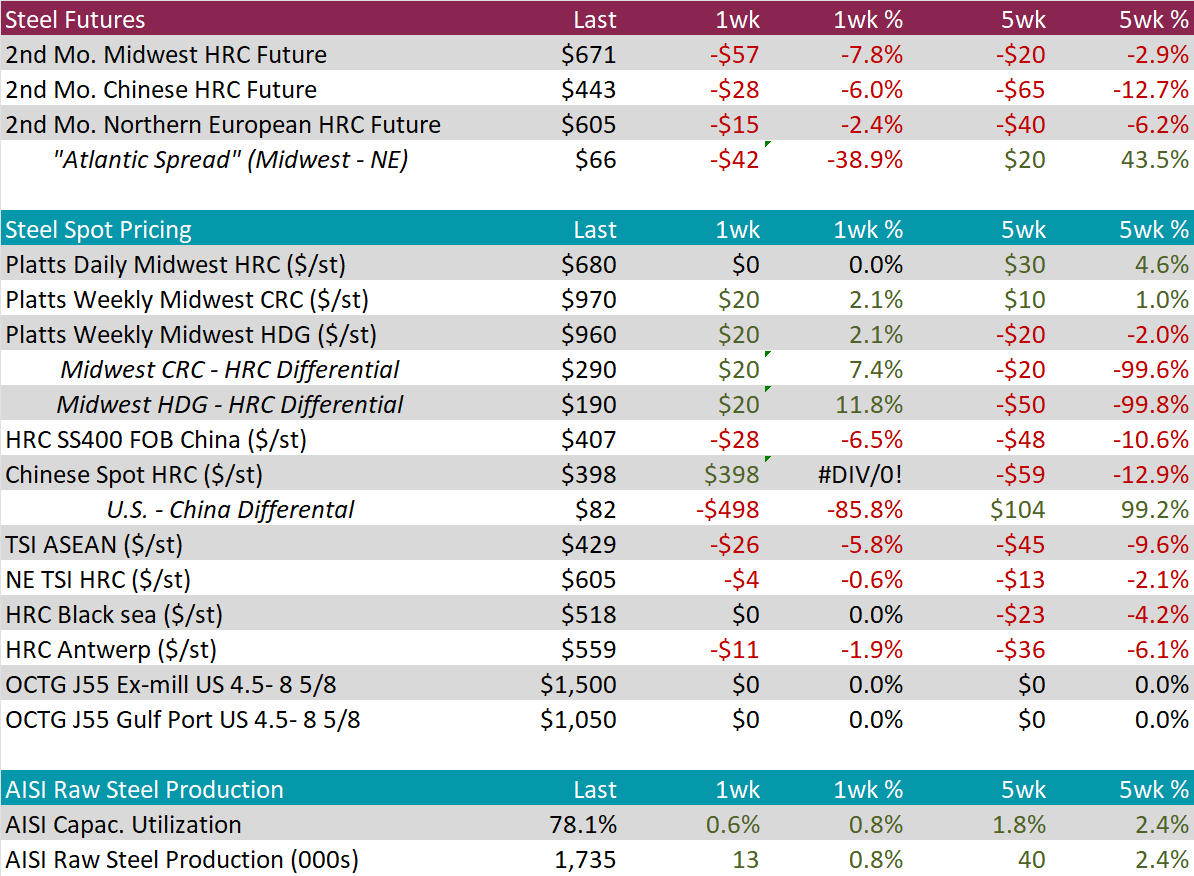
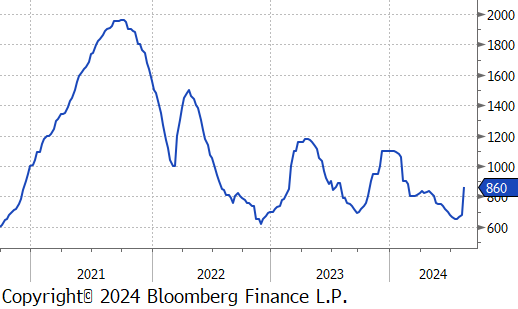
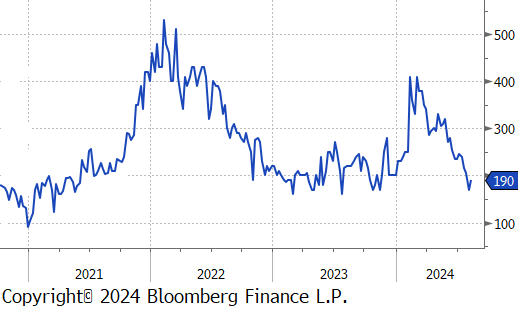
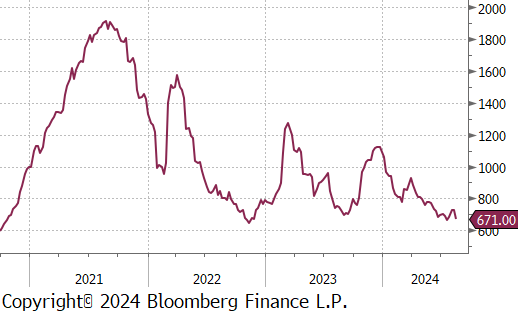
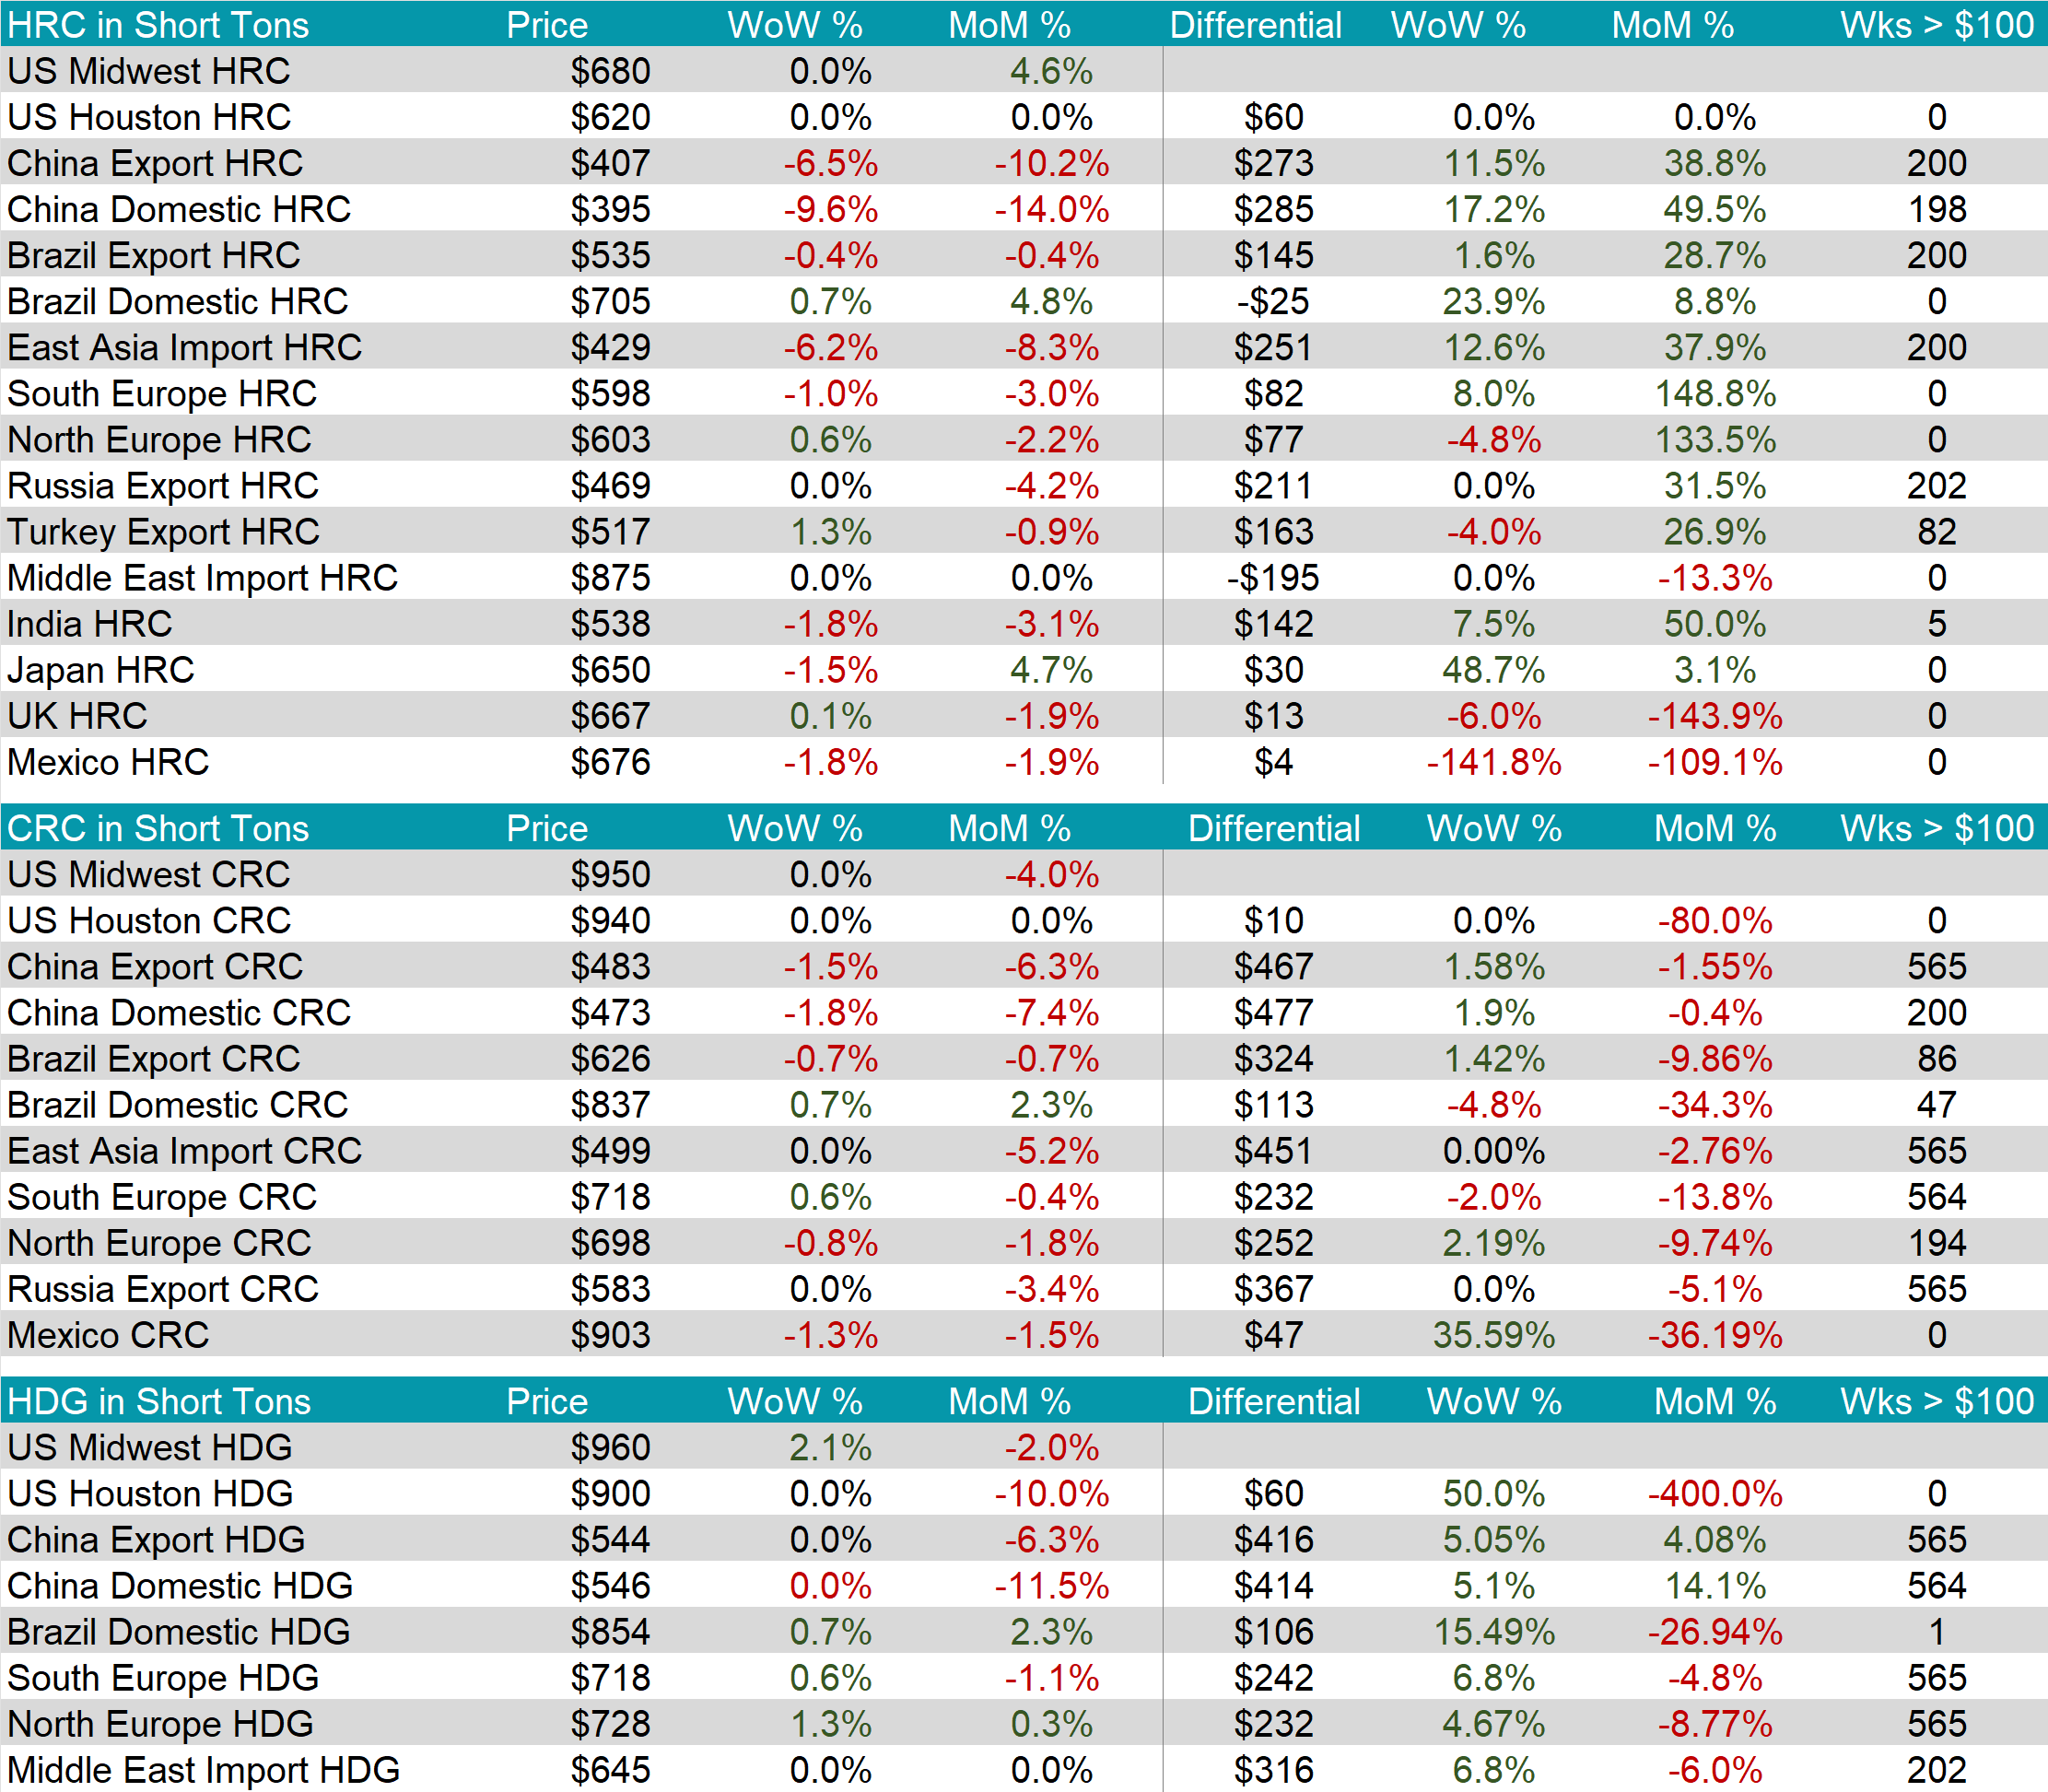
The HRC spot price remained unchanged at $680. At the same time, the HRC 2nd month future dropped by $57 or -7.8% to $671, ending three consecutive weeks of price increases and hitting the lowest price in four weeks.
Tandem products both rose by $20, resulting in the HDG – HRC differential to rebound by $20 or 11.8% to $190.
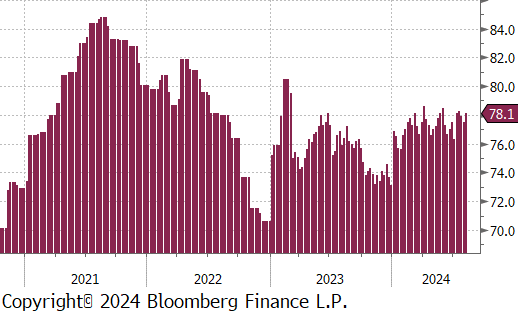
Mill production jumped back up, with capacity utilization ticking up by 0.6% to 78.1%, bringing raw steel production up to 1.735m net tons.
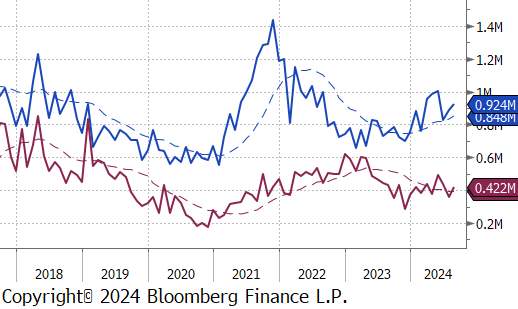
August Projection – Sheet 924k (up 36k MoM); Tube 422k (up 66k MoM)
July Projection – Sheet 88k (up 63k MoM); Tube 356k (down 58k MoM)
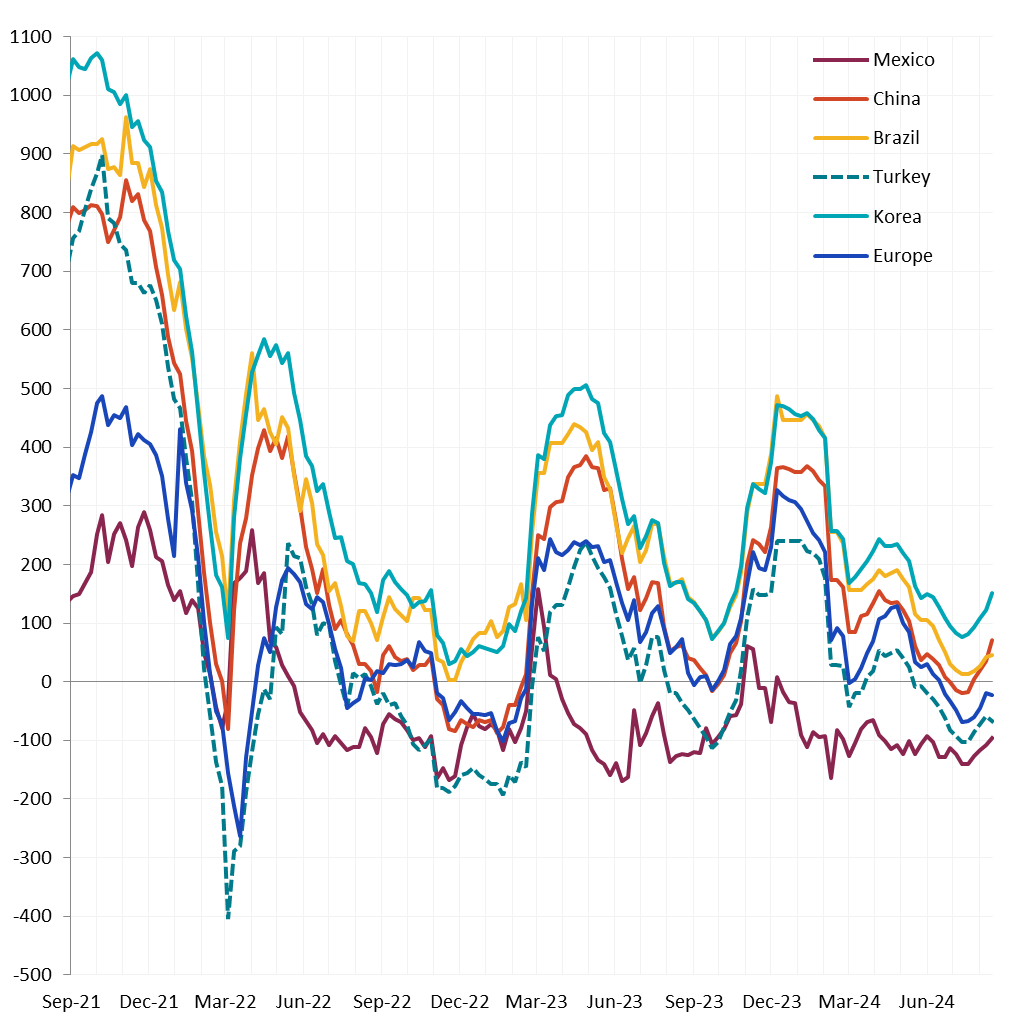
Watched global differentials were mixed this week, with China Export and Domestic HRC dropping by -6.5% and -9.6%, respectively. Korea’s Import HRC fell by -6.2%, while Turkey Export HRC rose by 1.3%.
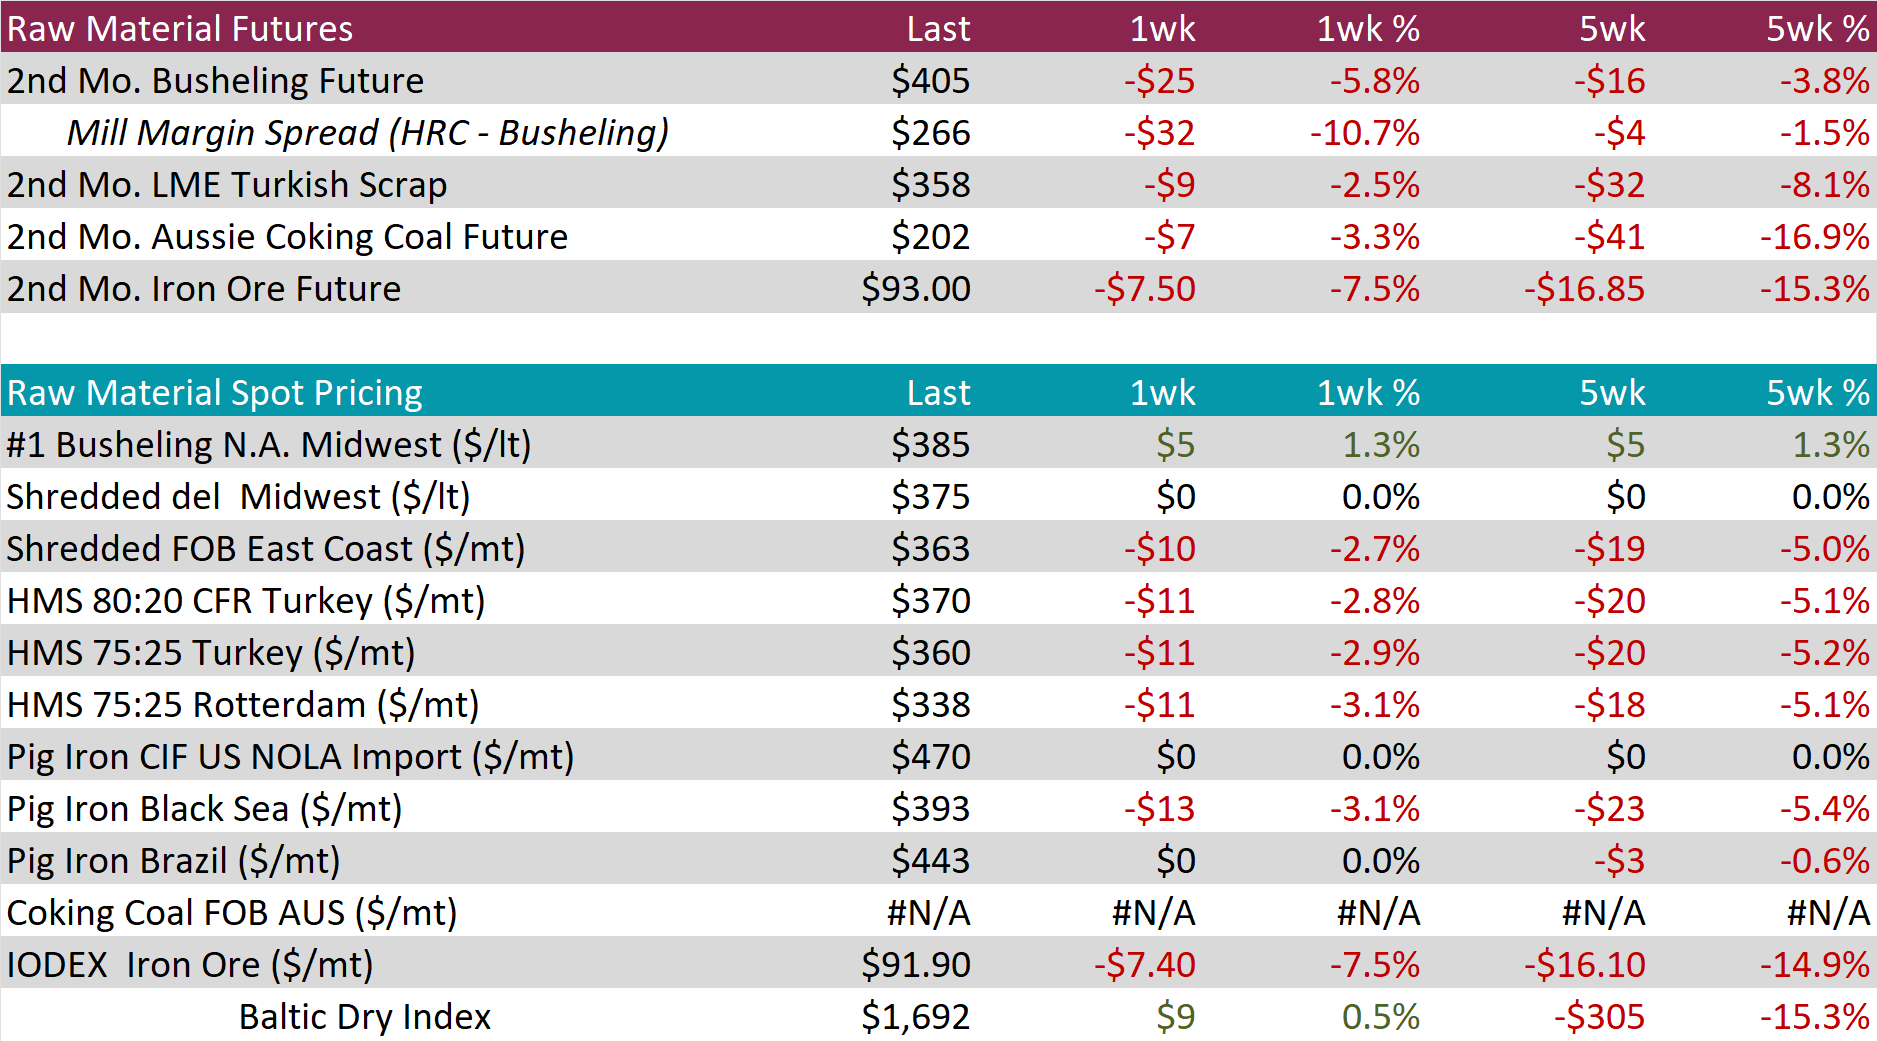
Scrap
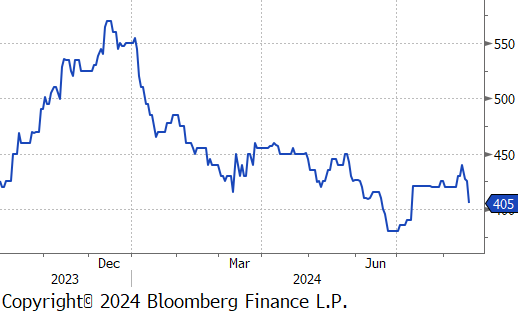
The busheling 2nd month future dropped by $25 or -5.8% to $405, falling to its lowest price since early July.
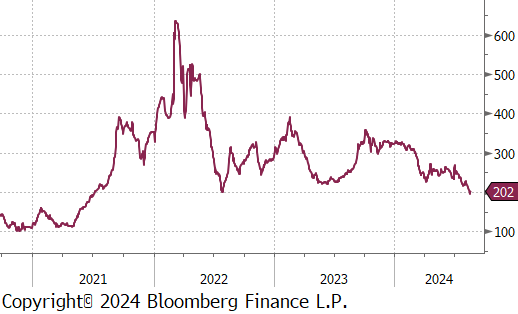
The Aussie coking coal 2nd month future fell by $7 or -3.3% to $202, marking the second consecutive week of price declines, reaching the lowest price since July 2021.
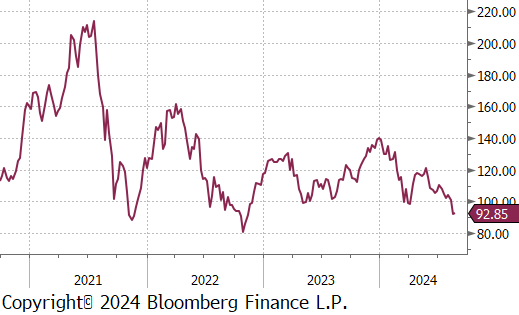
The iron ore 2nd month future decreased by $7.50 or -7.5% to $93, hitting the lowest price since November 2022.
Dry Bulk / Freight
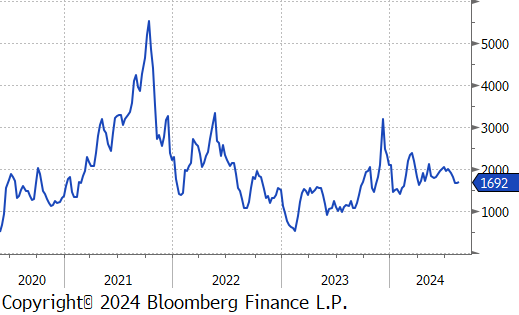
The Baltic Dry Index inched up by $9 or 0.5% to $1,692, marking the second consecutive week of price increases, continuing to rebound from recent price low.
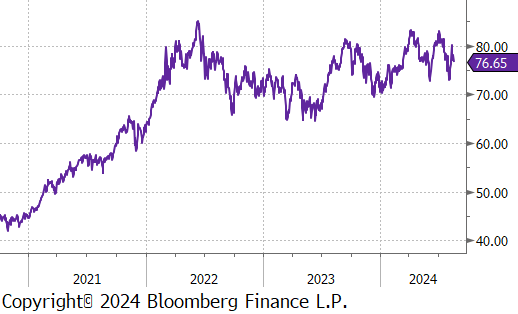
WTI crude oil future lost $0.19 or -0.2% to $76.65/bbl.
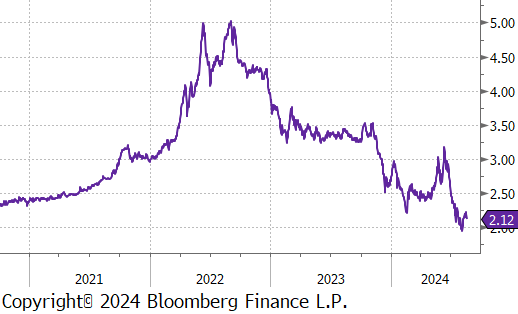
WTI natural gas future lost $0.02 or -0.9% to $2.12/bbl.
The aggregate inventory level declined further, shrinking by -0.4%.
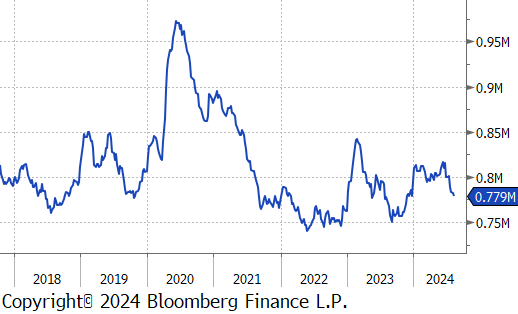
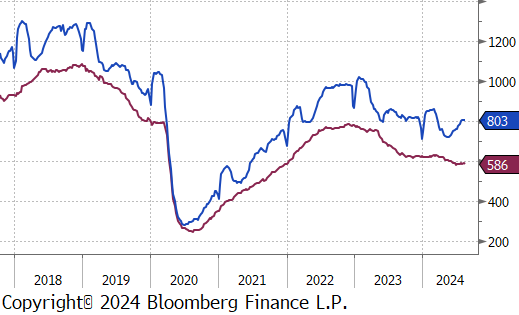
The Baker Hughes North American rig count reduced by 2 rigs, bringing the total count down to 803 rigs. Similarly, the US rig count dipped by 2 rigs, bringing the total count to 586 rigs – marking the eleventh week under 600.
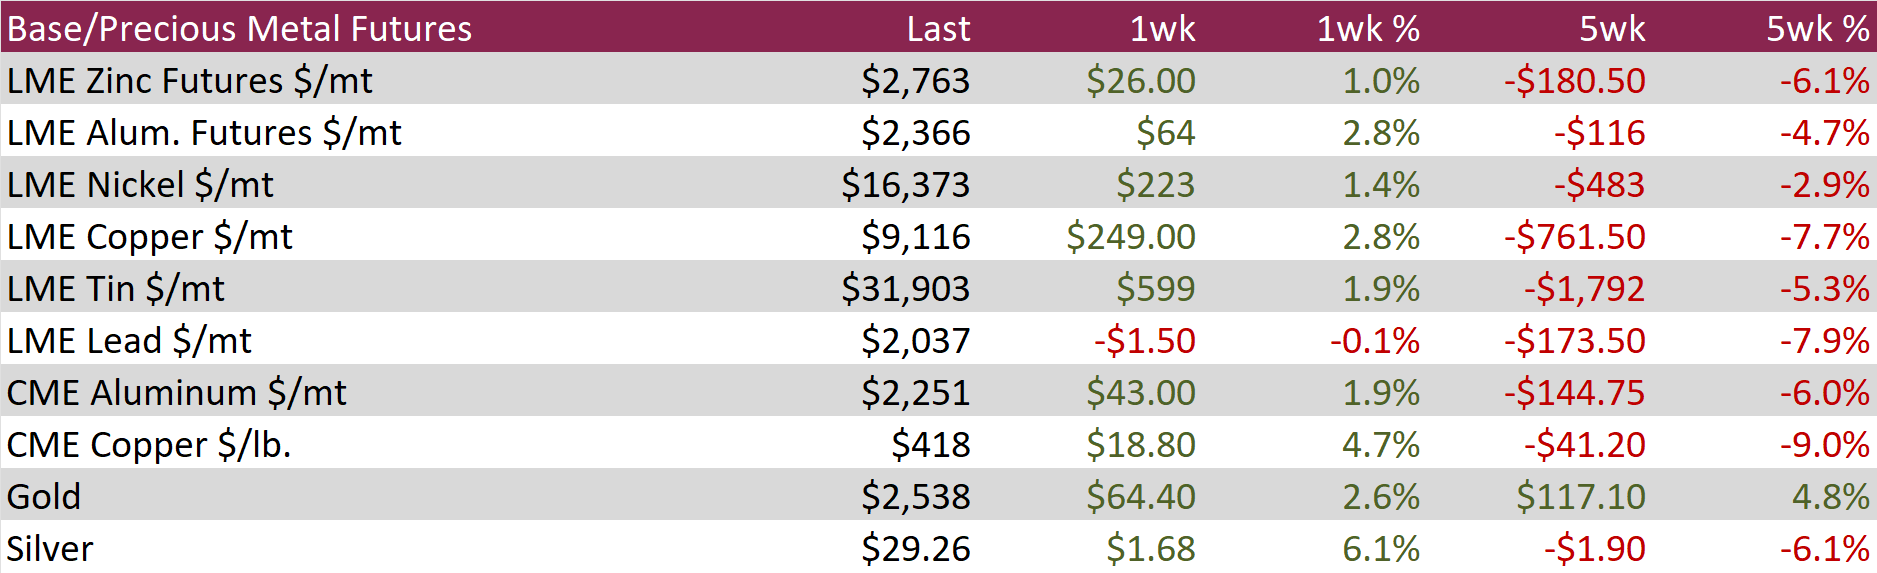
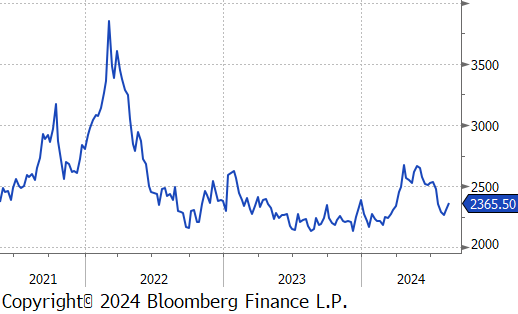
Aluminum futures jumped up by $64 or 2.8% to $2,366, rebounding from five-month low. Increased rainfall in Yunnan, a key Chinese production hub, boosted hydropower availability, enabling smelters to restart previously idled capacity. This development alleviated earlier concerns that dry weather would disrupt production, resulting in a 6.2% year-on-year increase in China’s primary aluminum output in June to 3.76 million tonnes, the highest since November 2014. Meanwhile, economic data highlighted subdued domestic demand for factory goods in China. The NBS manufacturing PMI indicated a third consecutive month of contraction in July, while the broader Caixin gauge also unexpectedly contracted, suggesting that Chinese factories are struggling to find foreign clients to offset declining domestic demand.
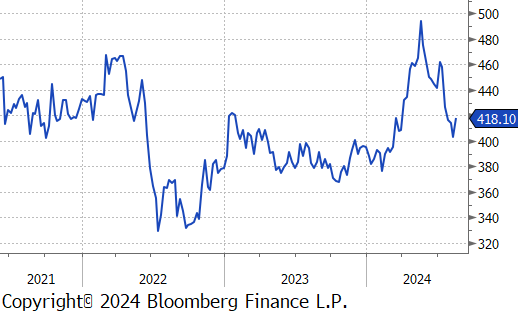
Copper futures rebounded by $18.80 or 4.7% to $418, reaching a two-week high as a strike at BHP’s Escondida mine in Chile threatened to disrupt over 5% of global copper supply. The potential for a supply deficit was further heightened by ongoing wage negotiations at other Chilean mines, keeping the market on edge. On the demand side, better-than-expected US economic data eased fears of an imminent recession in the world’s largest economy. However, concerns over weak demand from top consumer China continued to dampen sentiment. Recent data showed that China’s industrial production in July fell short of expectations, and manufacturing PMI reports pointed to worsening operating conditions.
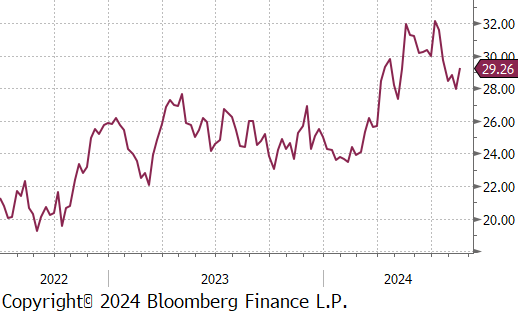
Silver climbed by $1.68 or 6.1% to $29.26 as cooling US inflation bolstered expectations for Federal Reserve rate cuts. Recent data showed that both producer and consumer prices in the US rose less than anticipated in July, with the annual headline CPI recording its lowest level since March 2021. Markets are now fully expecting a Fed rate cut in September, though opinions vary on whether the reduction will be 25 or 50 basis points. A total of 100 basis points in rate cuts is anticipated by year-end. Meanwhile, Australian miner Perth Mint reported a 91% surge in silver product sales for July, reaching 939,473 ounces, the highest since February, with US-bound shipments accounting for the bulk of its sales, reaffirming the US as its largest market.
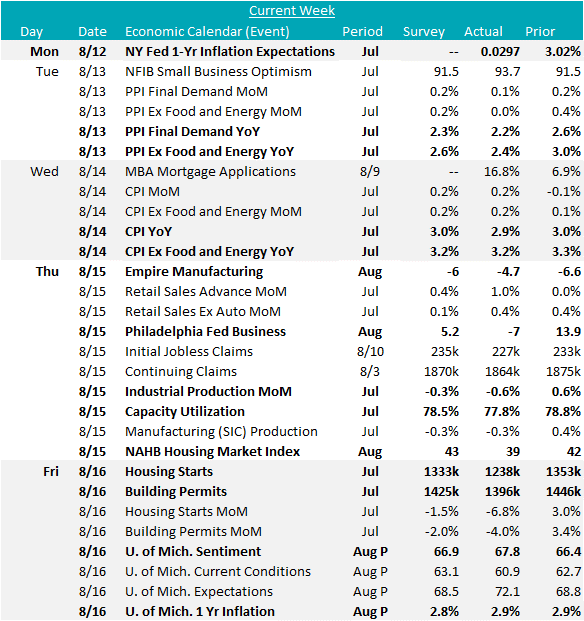
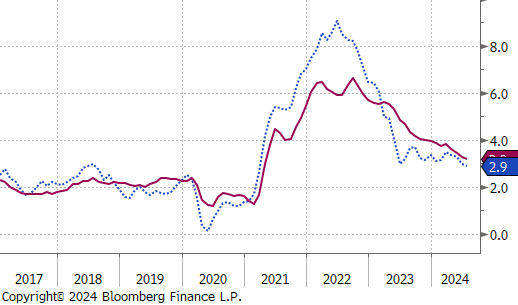
This week’s highlight was the cooling inflation data, reinforcing expectations for a September rate cut. The Core CPI YoY rose 3.2% in July, marking the lowest pace in over 3 years. The headline CPI YoY increased by 2.9% vs the forecasted 3.0%. The Core PPI YoY rose 2.4% in July vs the anticipated 2.7%, while the overall PPI YoY was also below expectations, 2.2% vs 2.3%. This easing was largely due to a decline services, signaling a broader moderation in inflation pressures. Regarding inflation outlook, the NY Fed 1-Yr Inflation Expectations held steady at 3.0%, and the University of Michigan’s preliminary August results for 1-Yr Inflation Expectations remained at 2.9% vs the forecasted 2.8%.
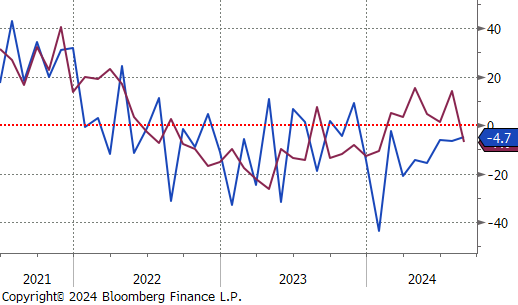
The first 2 of the 5 FED Manufacturing Surveys for August were released and highlighted the sectors ongoing challenges as it continues to struggle with the pressures of high interest rates. Philadelphia, which had been the strongest among the regional surveys, unexpectedly dropped to -7 vs the forecasted 5.2, the first contraction since January. Conversely, NY Empire exceeded expectations, rising to -4.7 vs -6, the highest reading in six months, albeit still in contraction. Additionally, July’s Industrial Production also showed signs of weakness, falling by -0.6% vs a -0.3% decline. However, this larger-than-anticipated drop has been mainly attributed to the disruptive impact of Hurricane Beryl.
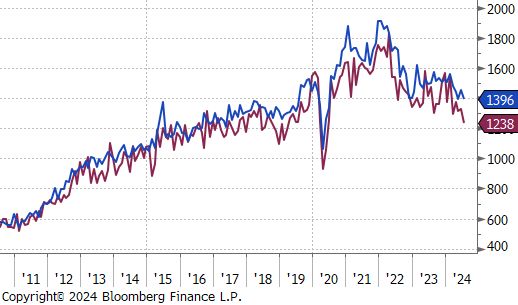
Finally, the first round of housing data for July came through with Housing Starts and Building Permits both coming in down and worse than expected, (-6.8%, vs exp. -1.5%), and (-4%, vs exp. -2%), respectively. Furthermore, the NAHB Housing Market Index fell to 39, from 42 in August. Taking a step back, it is important to remember that the recent step lower in interest rates only occurred in the last two weeks.