Flack Capital Markets | Ferrous Financial Insider
August 2, 2024 – Issue #443
August 2, 2024 – Issue #443
Overview:
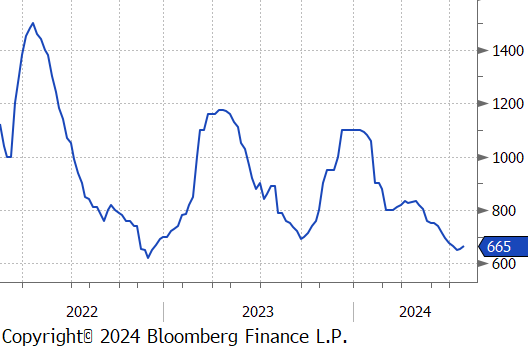
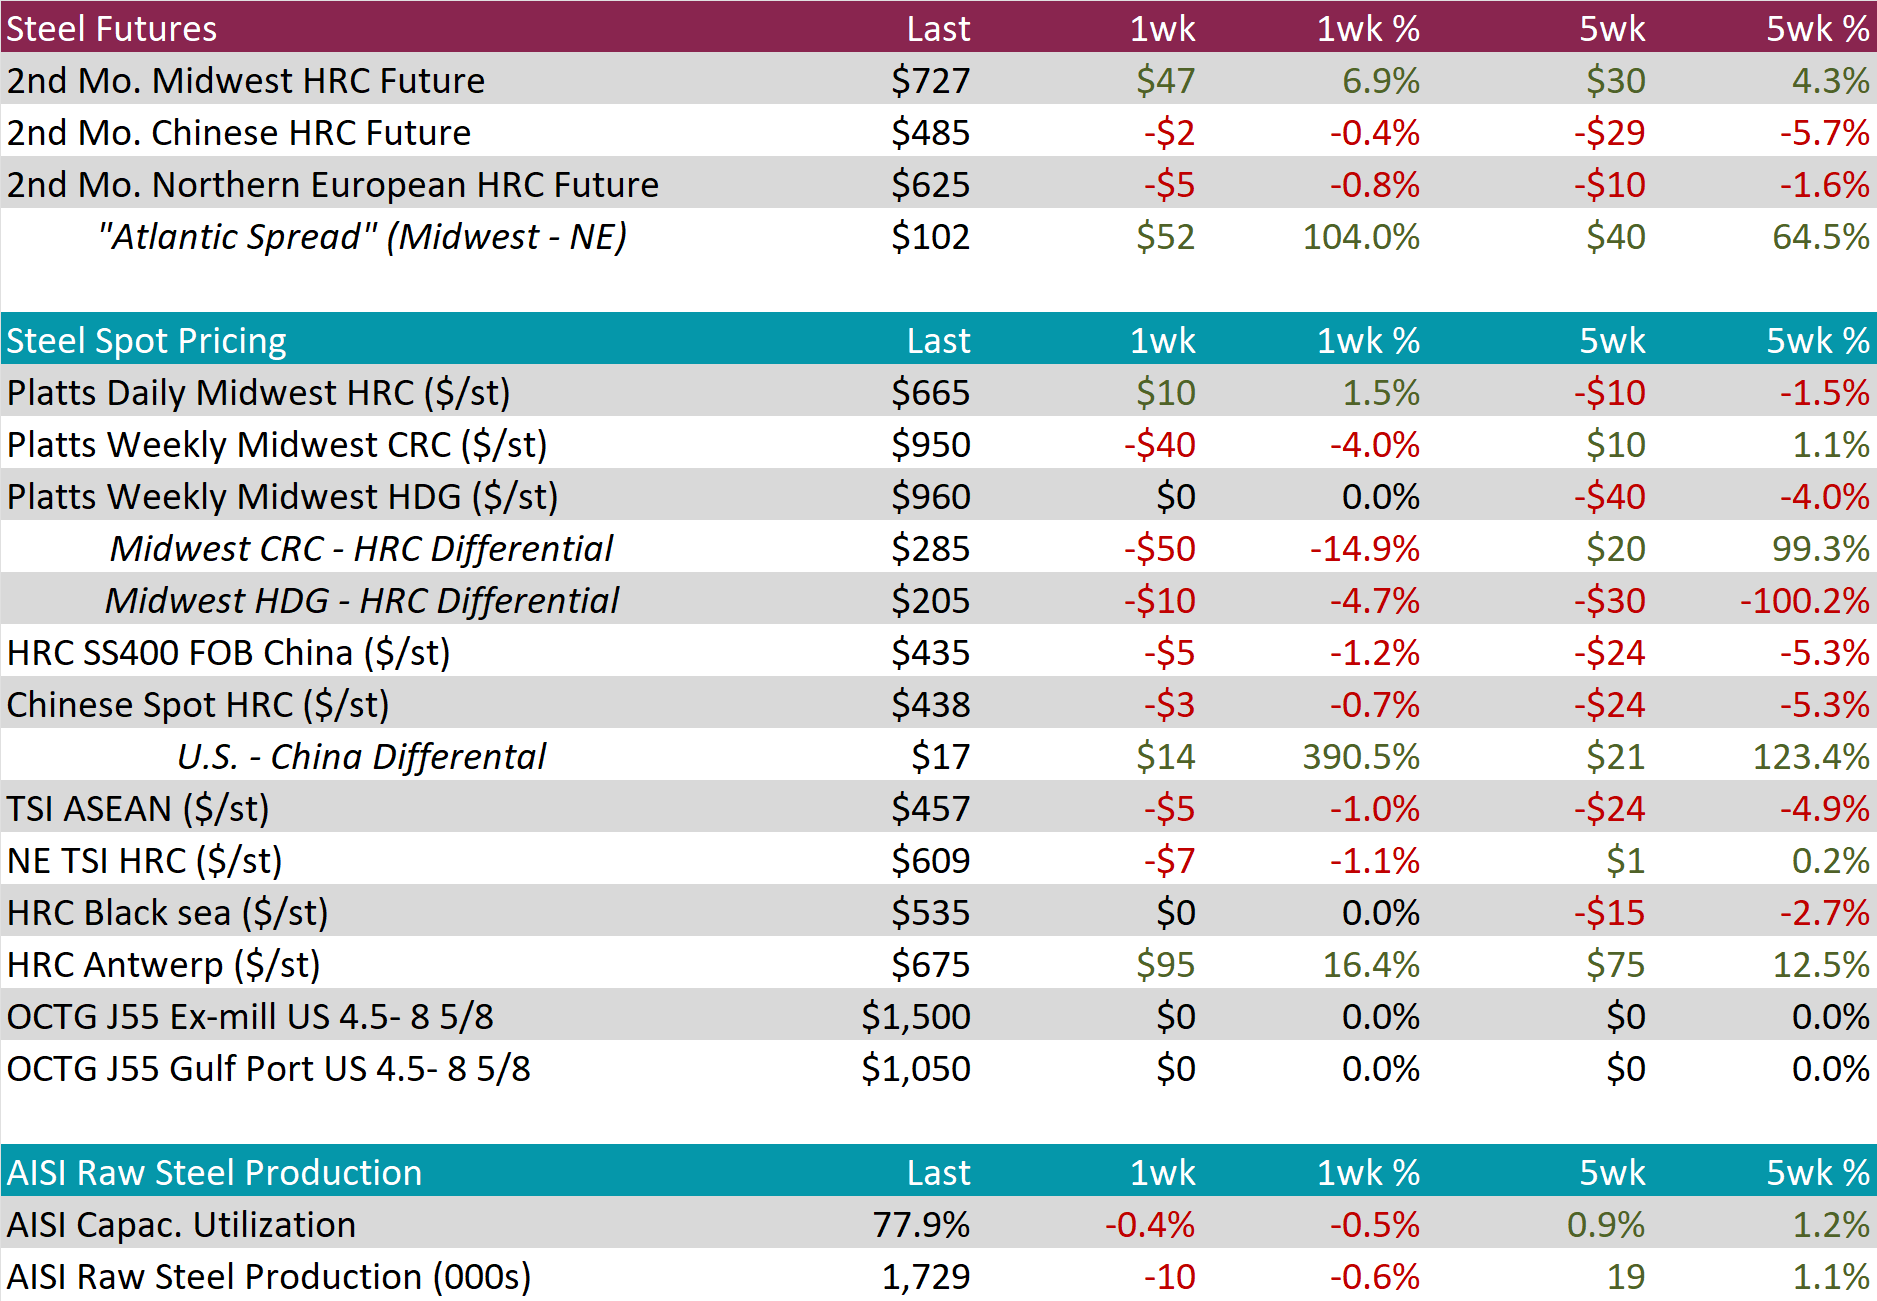
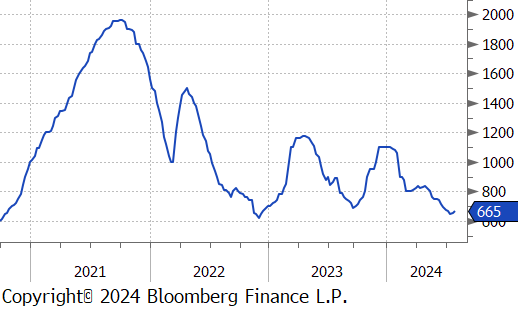
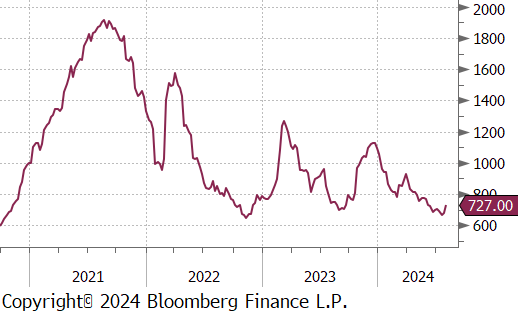
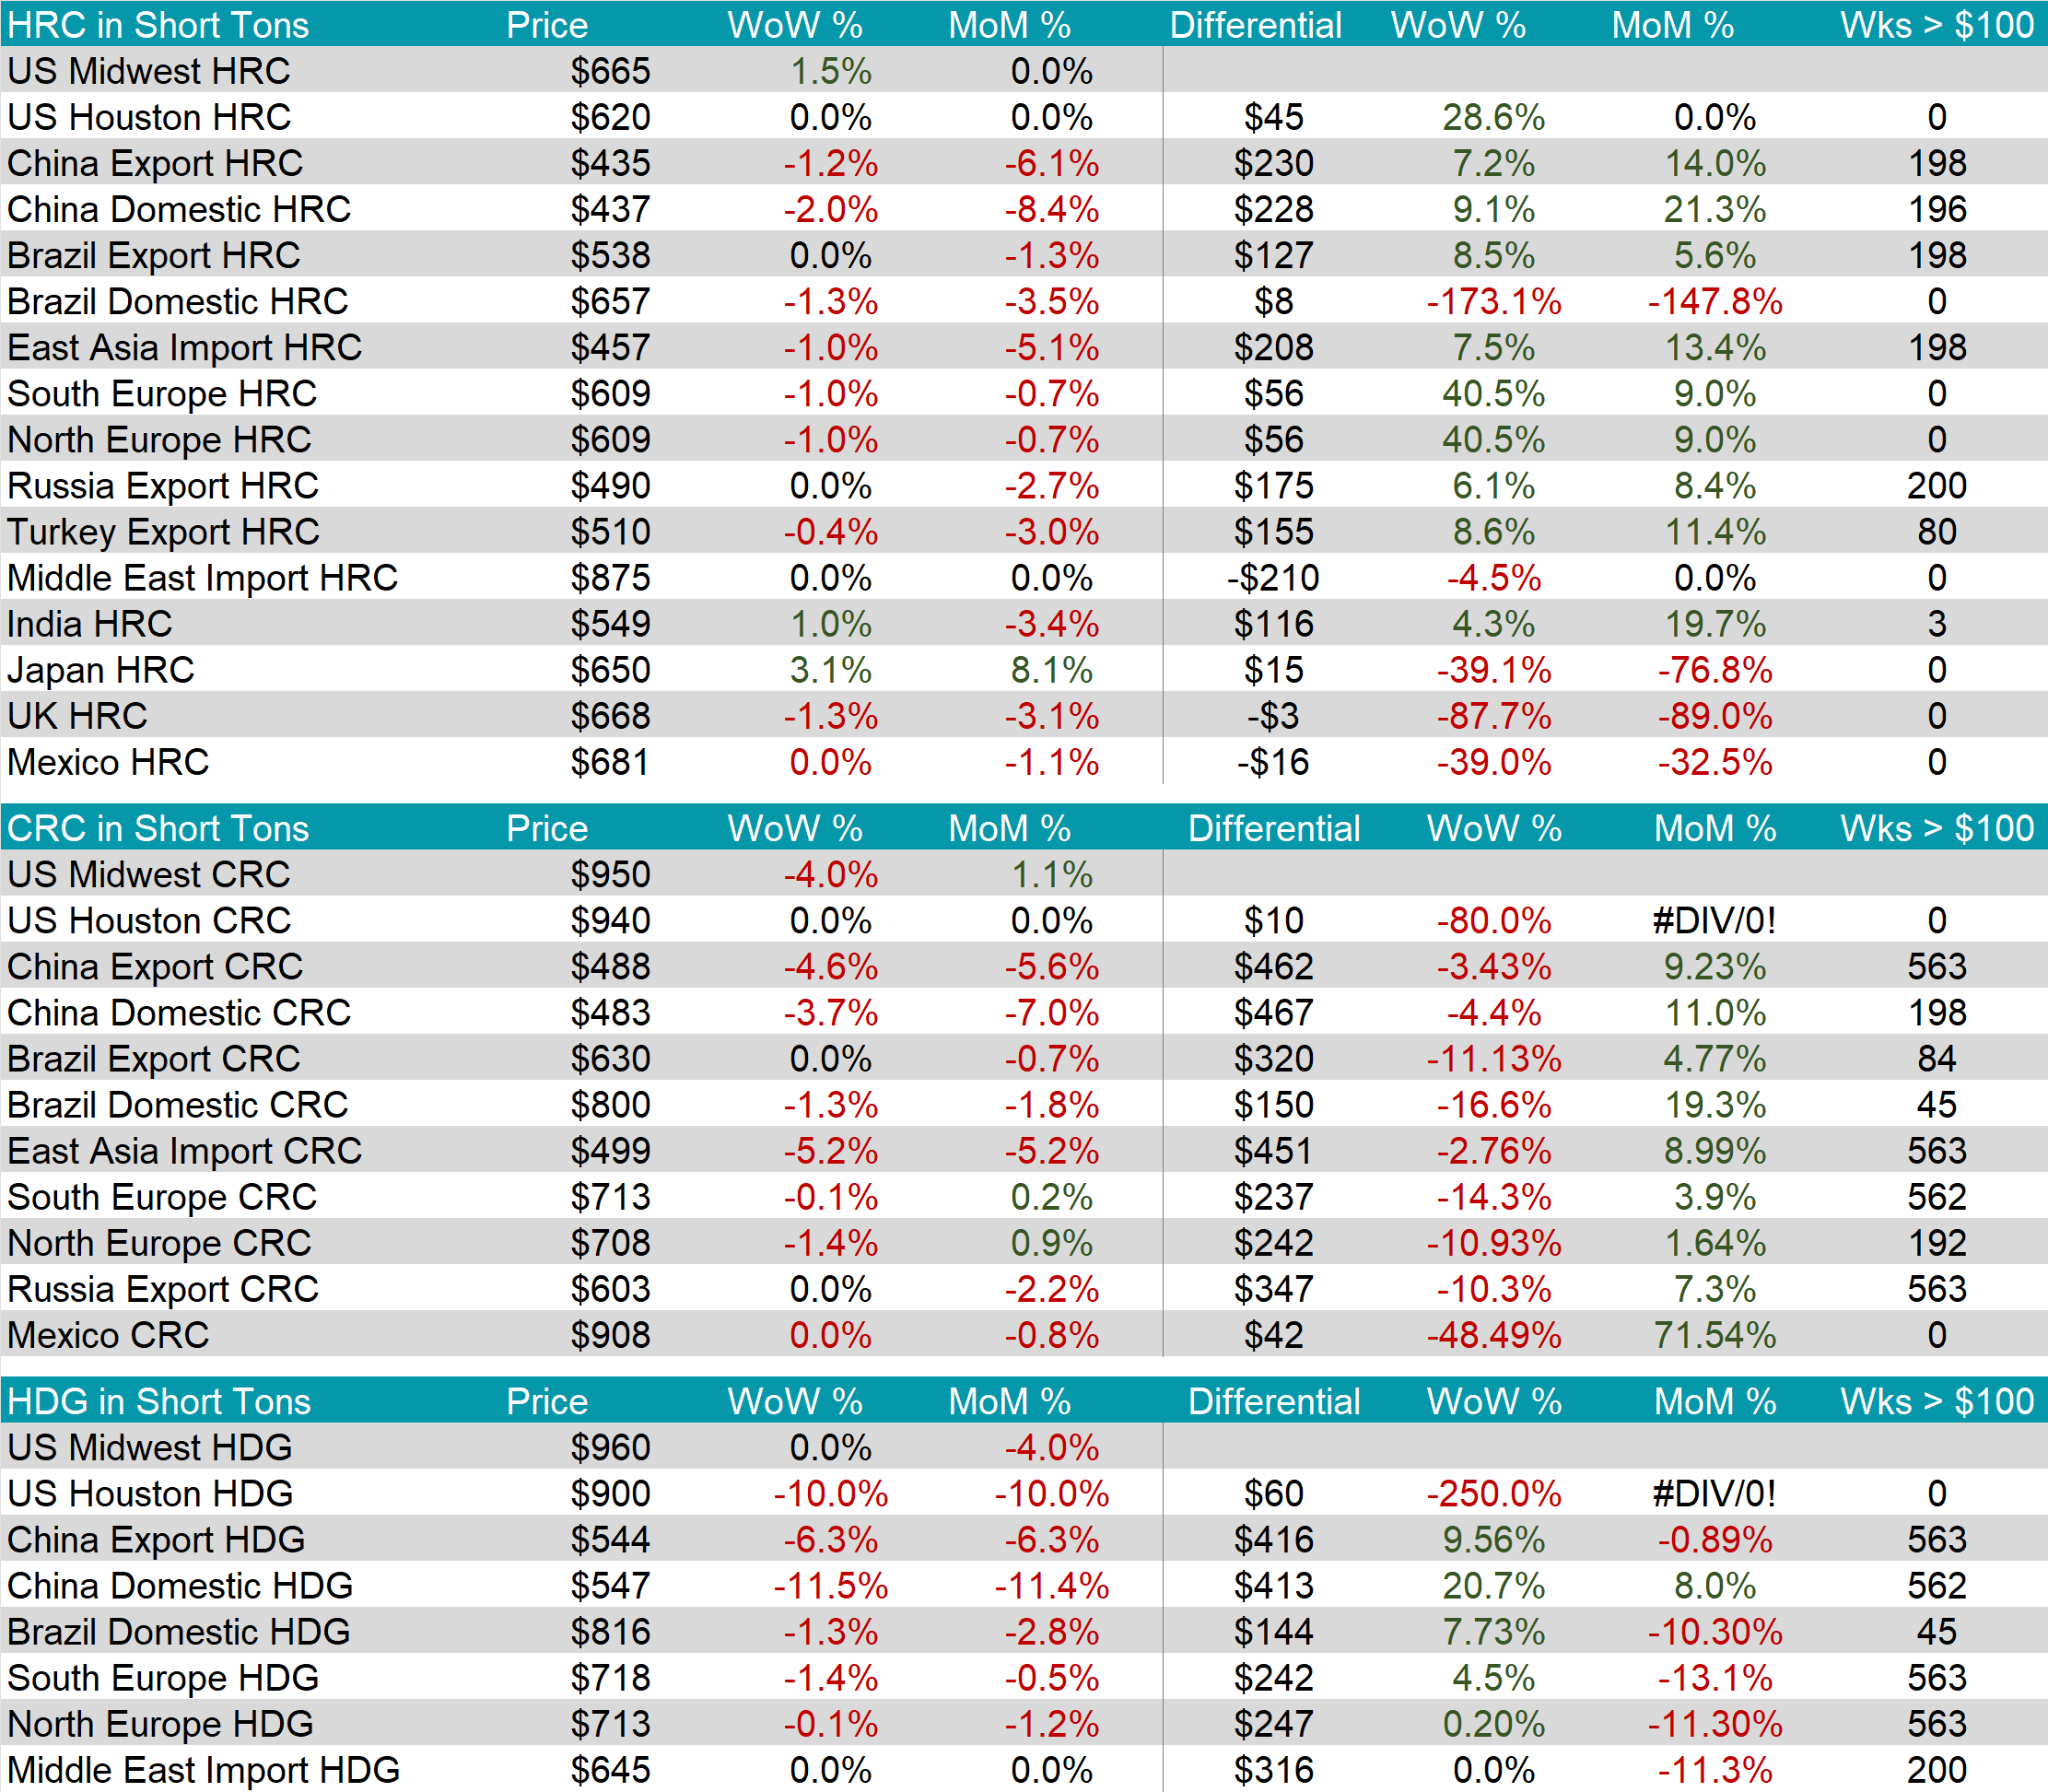
The HRC spot price rose by $10 or 1.5% to $665, marking the second consecutive week of price increases. At the same time, the HRC 2nd month future jumped by $47 or 6.9% to $727, also marking the second consecutive week of price increases.
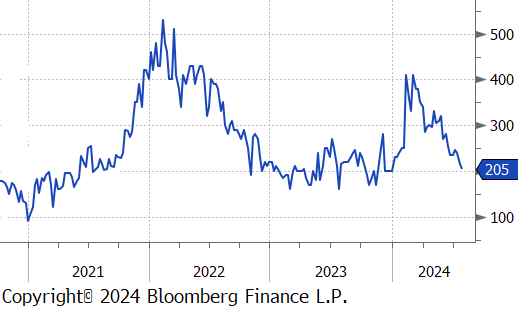
Tandem products were mixed with the CRC dropping by $40 and HDG remaining unchanged, resulting in the HDG – HRC differential falling by $10 to $205.
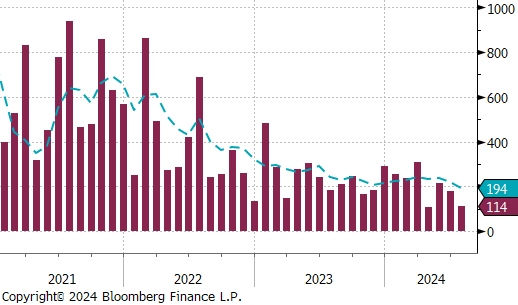
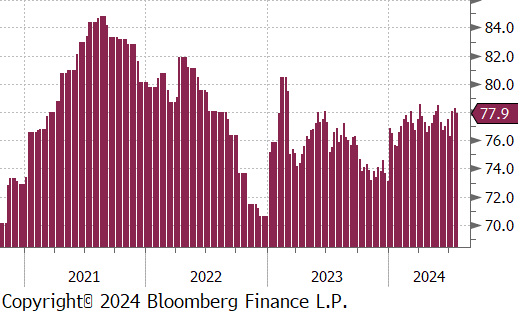
Mill production scaled back but remains somewhat elevated, with capacity utilization ticking down by 0.4% to 77.9%, bringing raw steel production down to 1.729m net tons.
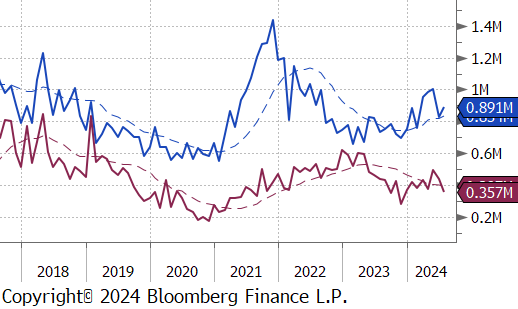
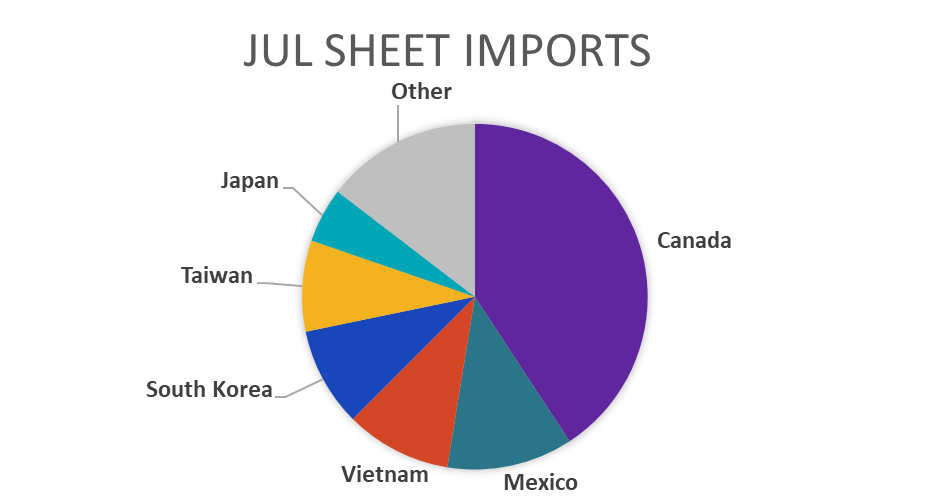
July Projection – Sheet 891k (up 66k MoM); Tube 357k (down 57k MoM)
June Census – Sheet 825k (down 179k MoM); Tube 414k (down 80k MoM)
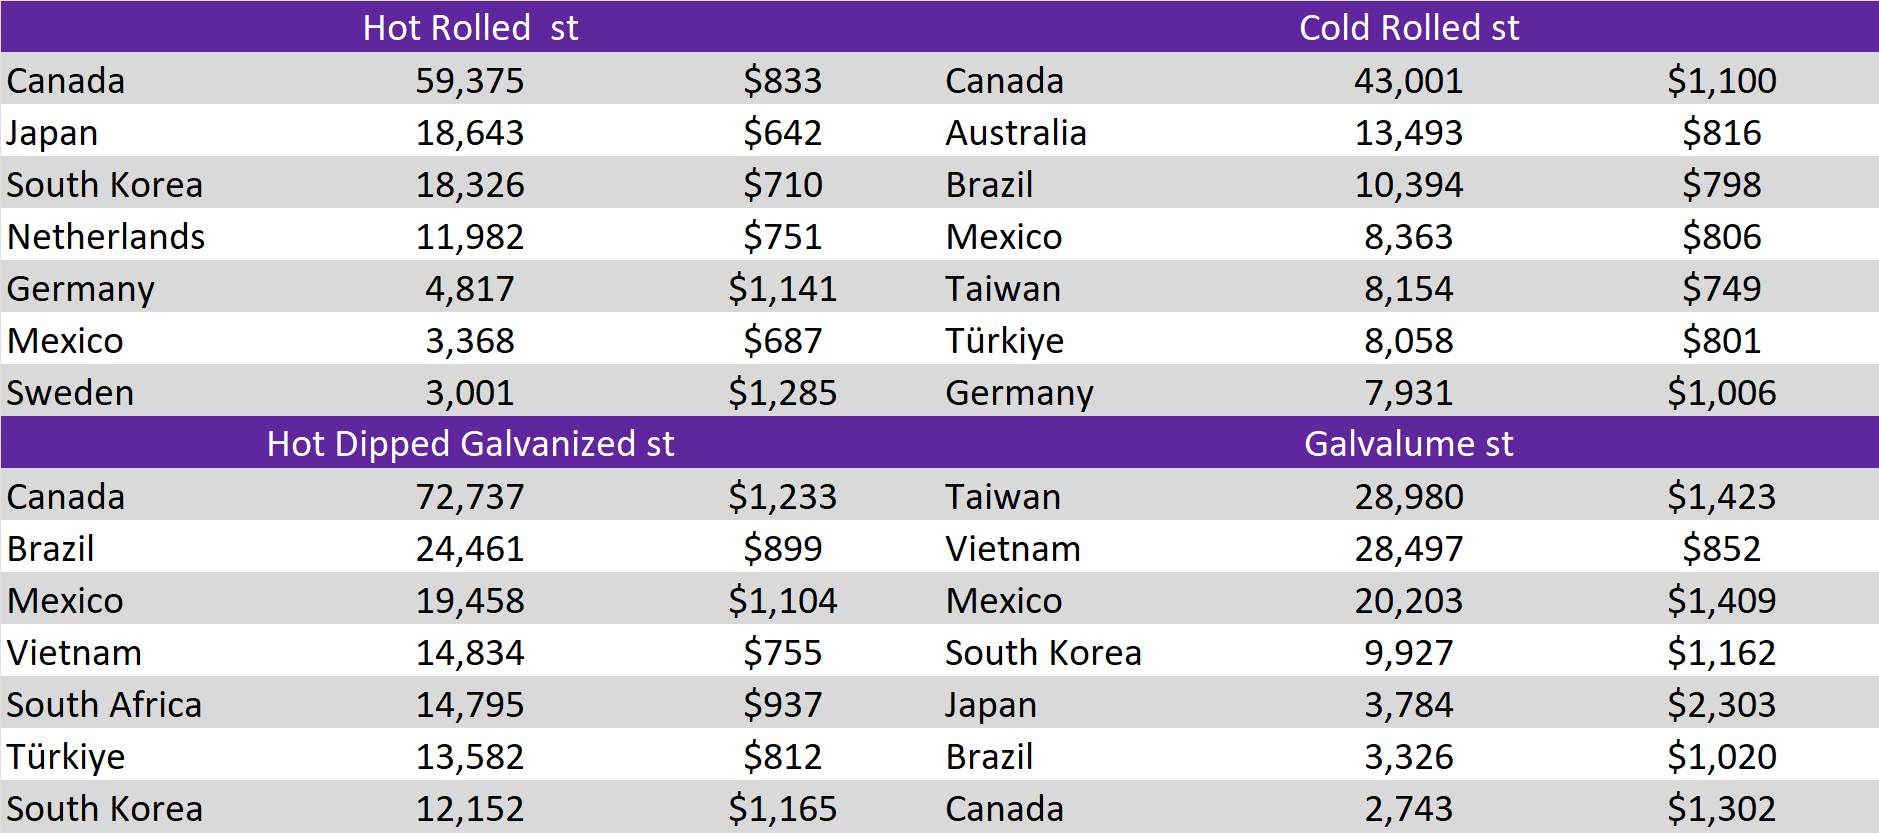
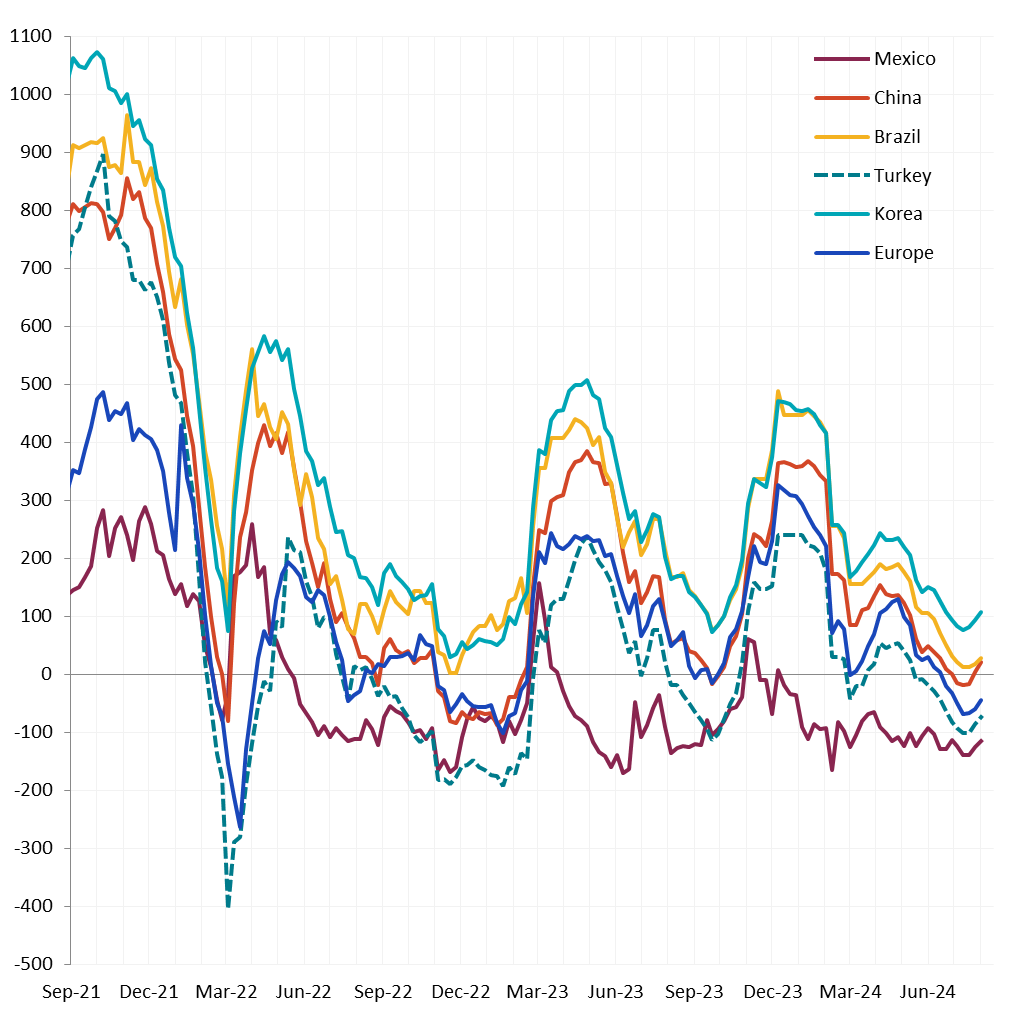
All watched global differentials mainly expanded further this week, with China Domestic and Export HRC decreasing by -2.0% and -1.2%, respectively, as well as Brazil Domestic HRC falling by -1.3%.
Scrap
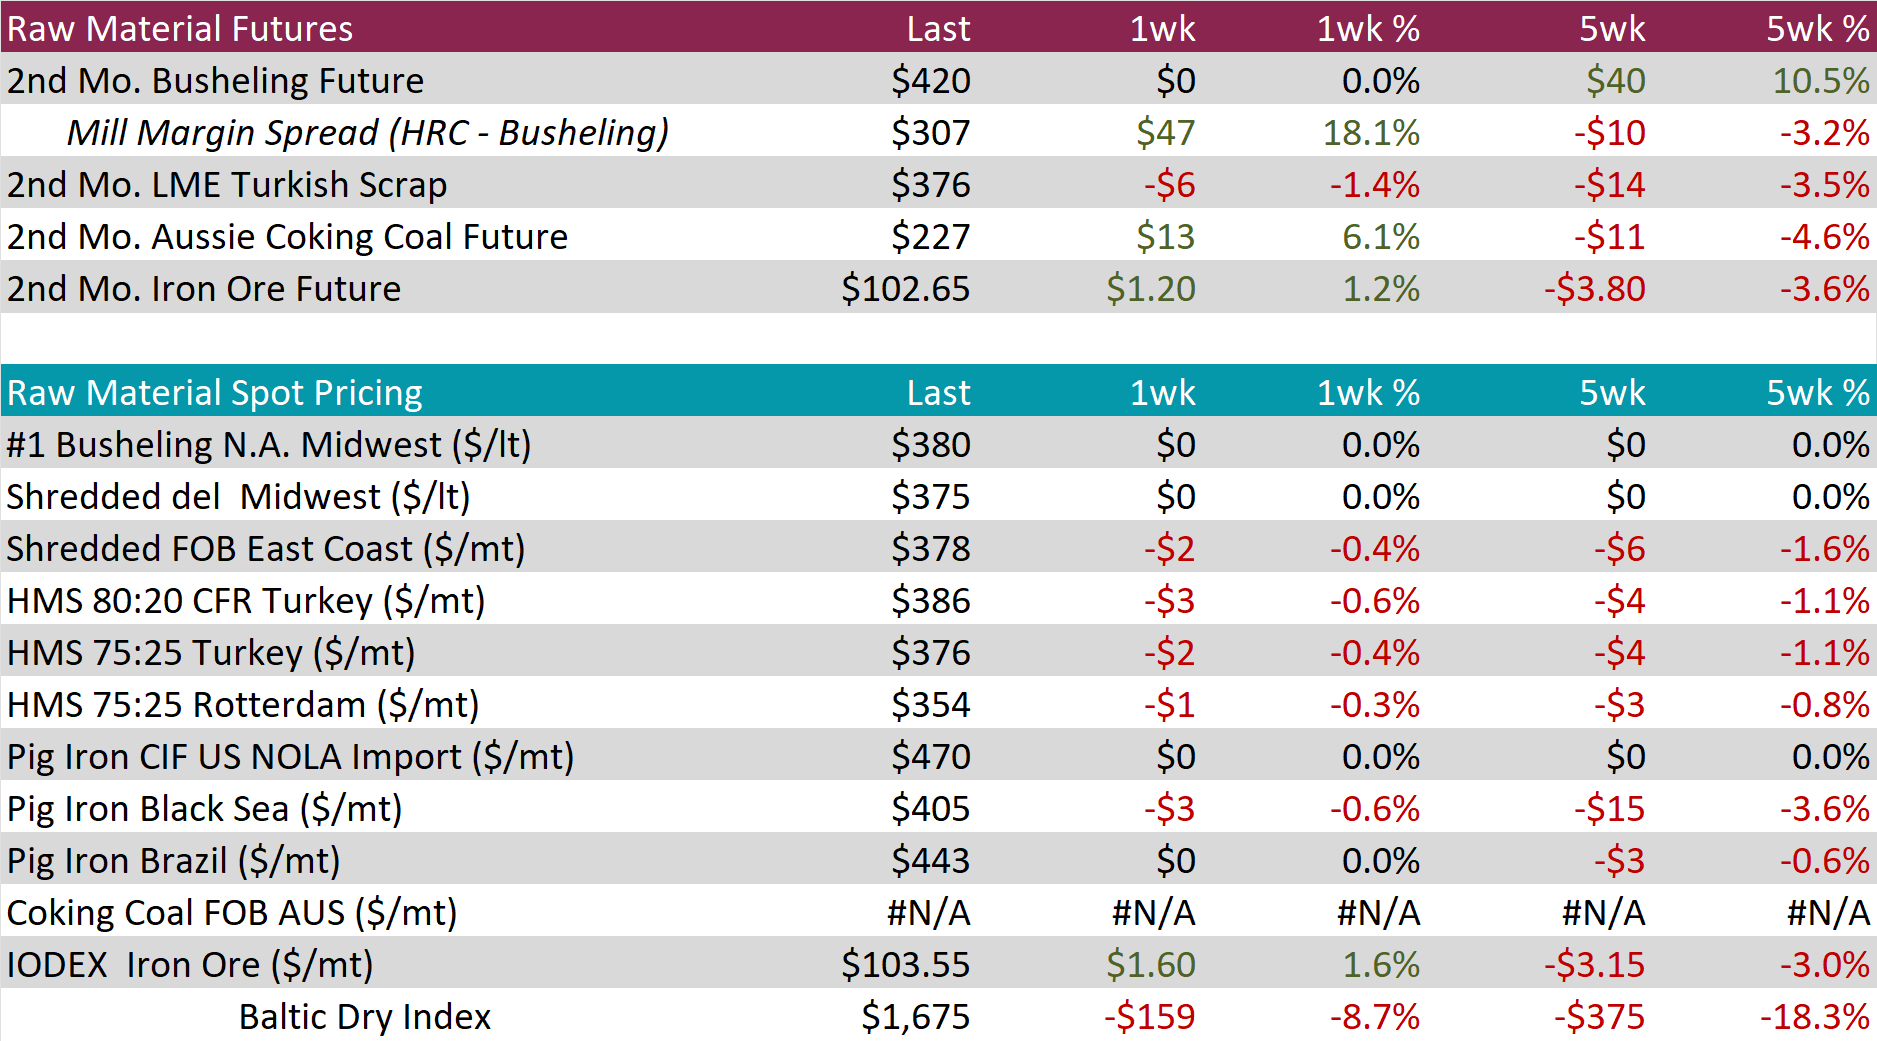
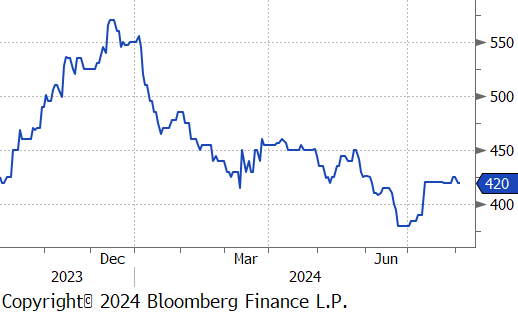
The 2nd month busheling future remained unchanged at $420, resulting in the five-week price change to be up by $40 or 10.5%.
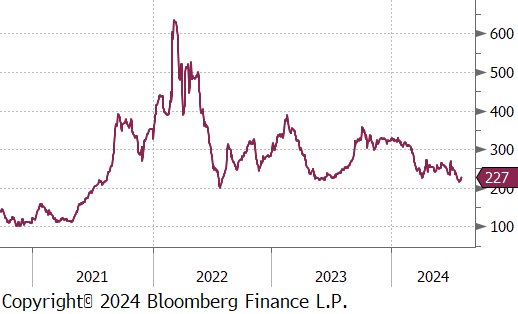
The Aussie coking coal 2nd month future rose by $13 or 6.1% to $227, rebounding from a three week down trend.
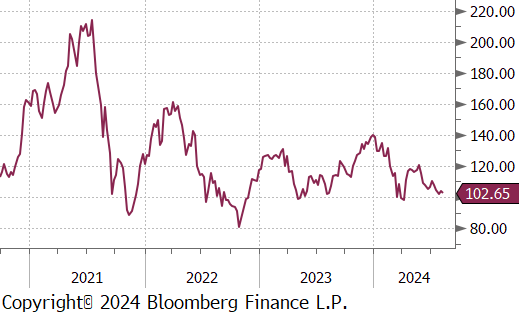
The 2nd month iron ore future climbed by $1.20 or 1.2% to $102.65, reversing the three consecutive weeks of price declines.
Dry Bulk / Freight
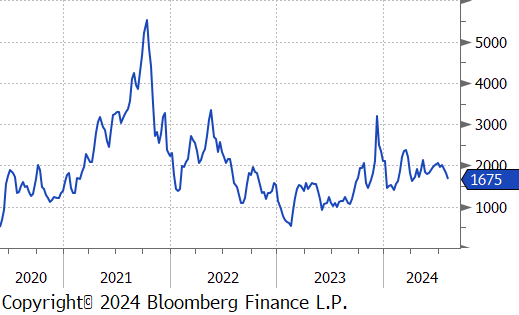
The Baltic Dry Index dropped by $159 or -8.7% to $1,675, marking the third consecutive week of price declines and reaching the lowest level since early April.
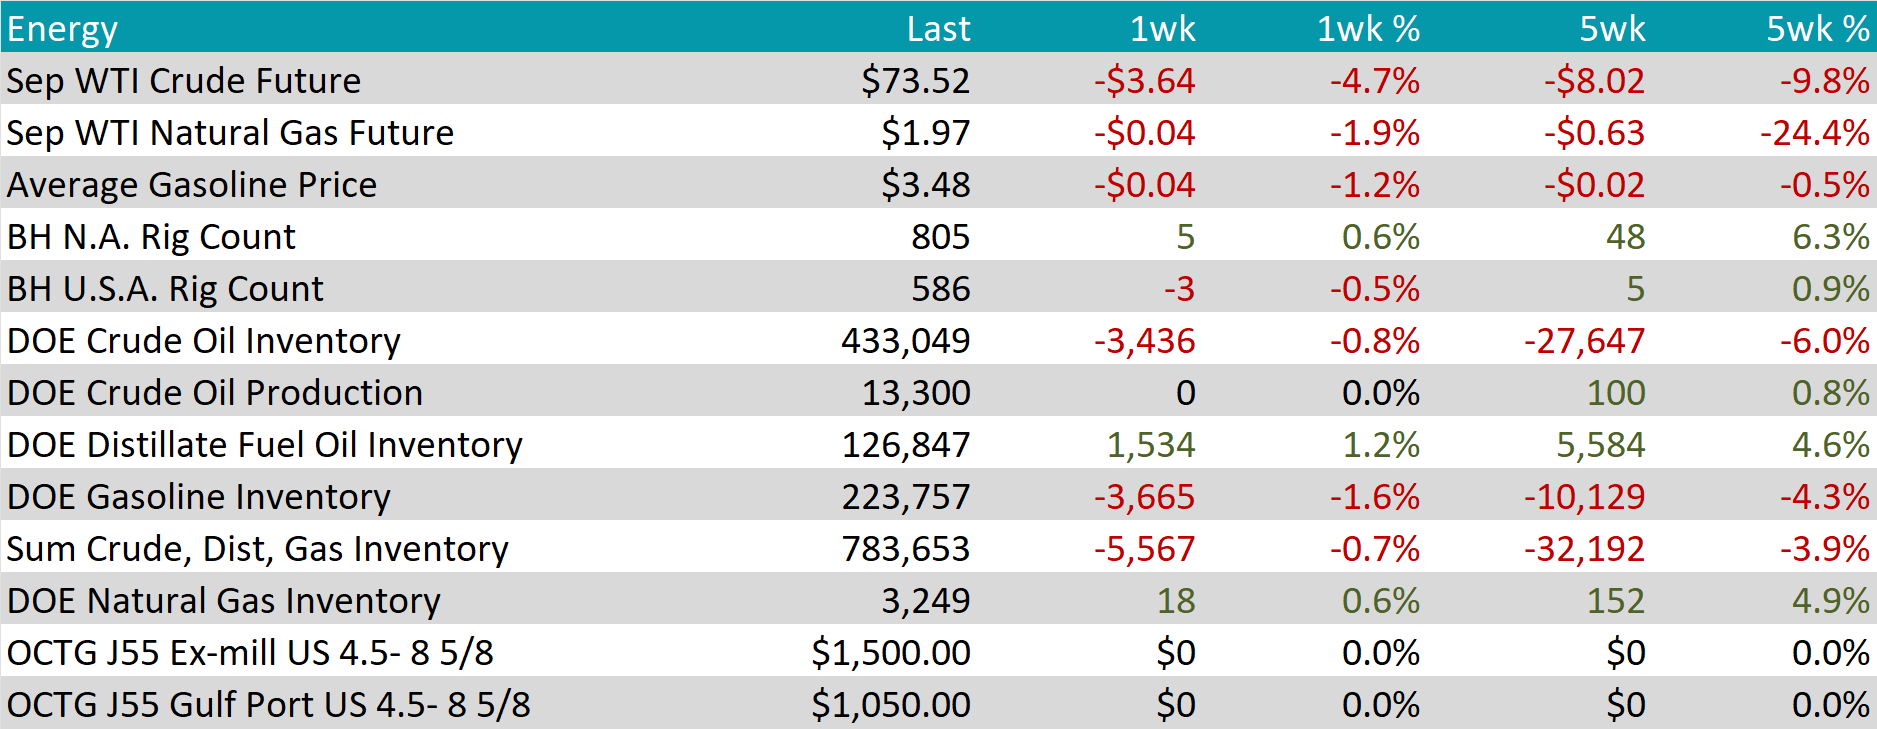
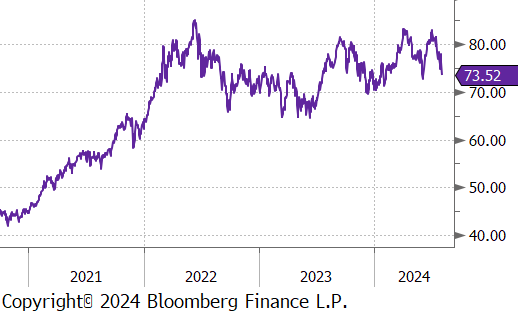
WTI crude oil future lost $3.64 or -4.7% to $73.52/bbl.
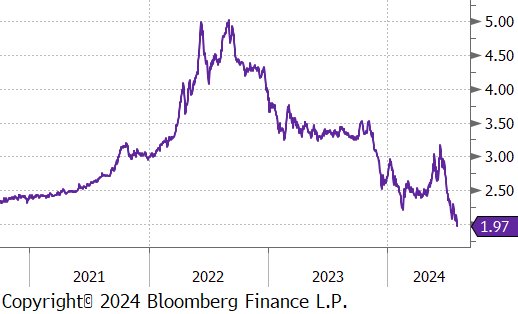
WTI natural gas future lost $0.04 or -1.9% to $1.97/bbl.
The aggregate inventory level experienced a further decline, falling by -0.7%.
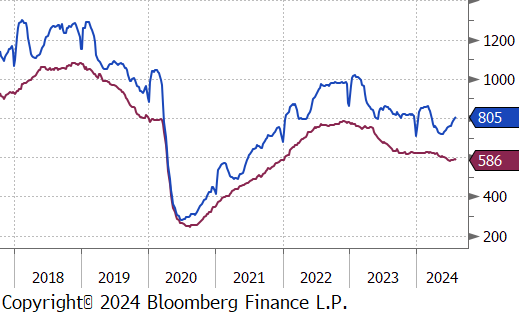
The Baker Hughes North American rig count added 5 rigs, bringing the total count to 805 rigs. Conversely, the US rig count reduced by 3 rigs, bringing the total count down to 586 rigs.
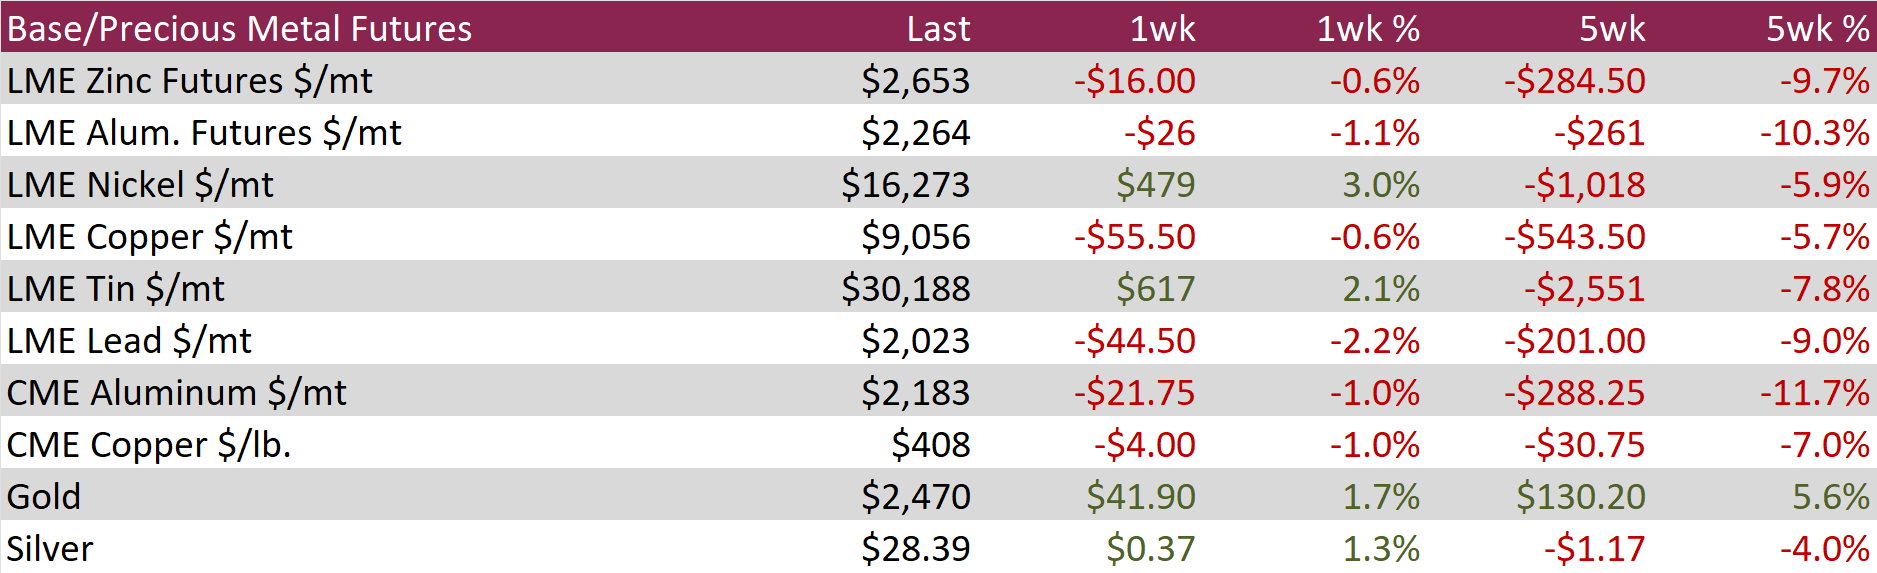
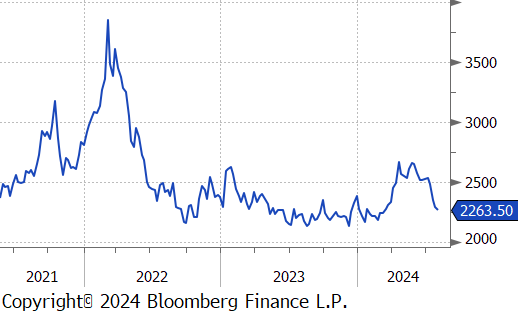
Aluminum futures fell by $26 or -1.1% to $2,264 , reaching their lowest level in nearly five months and erasing this year’s gains due to weak demand and ample supply. Increased rainfall in Yunnan, a key Chinese production hub, improved hydropower availability and allowed smelters to restart idled capacity. This alleviated previous concerns about dry weather disrupting production, resulting in a 6.2% annual increase in China’s primary aluminum output in June, reaching 3.76 million tonnes, the highest since November 2014. Despite this, economic data indicated that domestic demand for factory goods in China remained subdued. The NBS manufacturing PMI showed consecutive contractions in June, and customs data revealed a 109% surge in alumina exports, suggesting that manufacturers increasingly relied on export markets for sales.
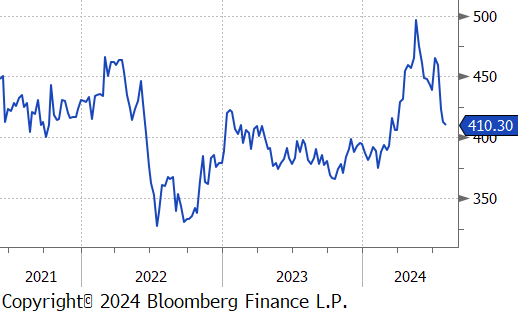
Copper futures slipped further by $4 or -1.0% to $408, hitting a five-month low amid a wave of risk aversion that triggered sharp selling across financial assets and commodities. Concerns about economic contraction in the US and slowing growth in China fueled this decline. Recent data highlighted a downturn in demand for industrial goods: both the NBS and Caixin manufacturing PMIs indicated contraction in July, while the ISM PMI reflected factory weakness in the US. Demand for base metals is expected to remain subdued in China, the top consumer, as the government refrained from implementing significant stimulus measures during the recent Third Plenum. Furthermore, reports that Chinese smelters are pursuing new projects to meet output mandates, contradicting earlier plans for joint production cuts to raise treatment charges, have eased supply concerns and added to the bearish sentiment.
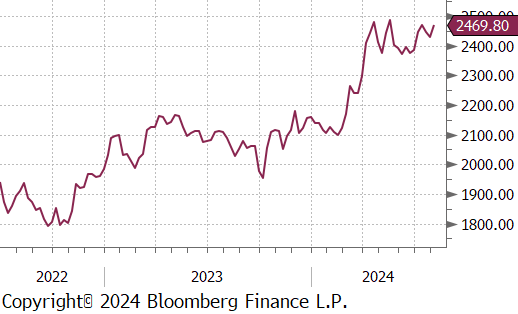
Gold climbed by $41.90 or 1.7% to $2,470 as gold continues to benefit from its safe-haven appeal amid a risk-averse market sentiment. Concerns about a US recession have intensified due to weak economic data and disappointing corporate earnings. On Friday, the US economy added only 114k jobs in July, significantly below the expected 175k. Additionally, the unemployment rate unexpectedly rose to its highest level since 2021, and wage growth slowed more than anticipated. This followed weak manufacturing data earlier in the week. As a result, markets now see over a 70% chance of a 50-basis point rate cut by the Fed in September, with approximately 155 basis points of total easing expected this year and next.
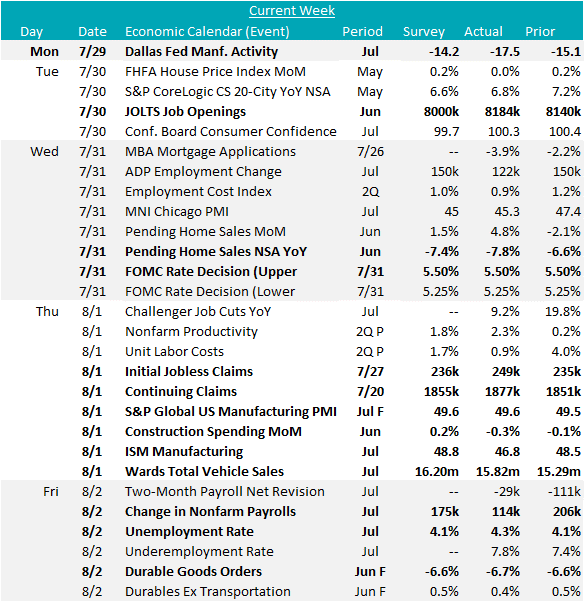
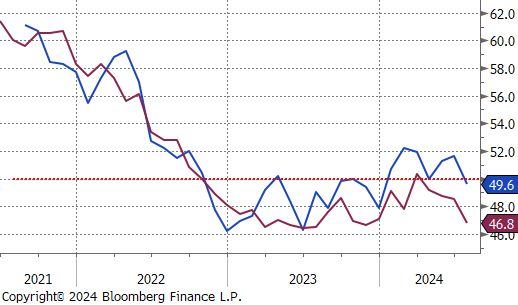
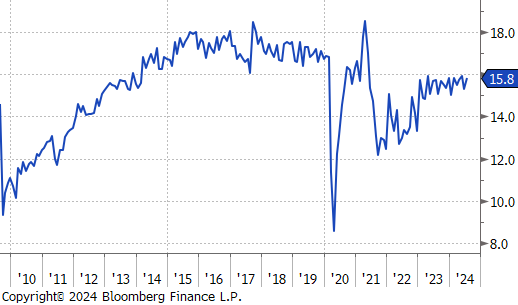
This week’s most notable data release was the unexpected drop in the ISM Manufacturing PMI, which fell to 46.8 against a forecasted improvement to 48.8. This decline followed another surprise in manufacturing, with the Dallas Fed Manufacturing Survey worsening to -17.5 instead of the anticipated rise to -14.2. On a slightly positive note, the final results for the S&P Global US Manufacturing PMI saw a minor uptick, reaching 49.6 from the preliminary 49.5. In other steel-specific sectors, Construction Spending disappointed, declining by -0.3%, missing the expected 0.2% increase. Wards Total Vehicle Sales rose to 15.82m from 15.29m, although was below the projected 16.20m sales. Additionally, the final data for June’s Durable Goods Orders aligned with preliminary results, showing a -6.6% decline.
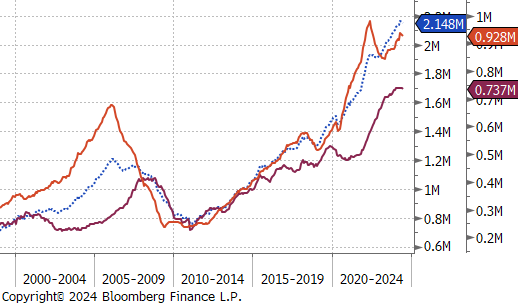
The batch of labor market data reported this week indicated a further cooling to the recent trend. The Unemployment Rate rose to 4.3%, surpassing expectations of holding steady at 4.1%, marking the fourth consecutive month of increases and the highest rate since October 2021 (officially triggering the Sham rule). Change in Nonfarm Payrolls added 114k jobs, notably below June’s 206k and the forecasted 175k and the lowest level in three months. Conversely, JOLTS Job Openings increased slightly in June, rising to 8184k from 8140k, exceeding the anticipated 8000k, continuing to trend towards 2019 levels. Additionally, both Initial and Continuing Jobless Claims came in above projections, 249k vs 236k and 1,877k vs 1,855k, respectively.
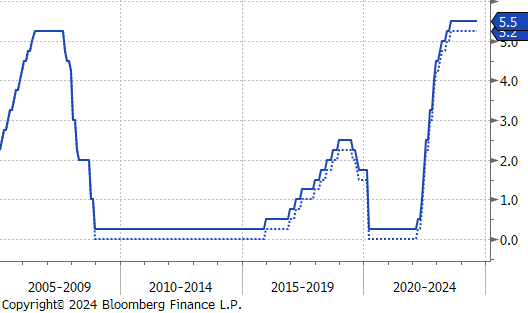
The FOMC Rate Decision was to hold FED Funds at 5.25-5.5% but opened the door for interest rate cuts in September (all as the market expected) the subsequent weak data over the last two days all but locked in the fact that long awaited cutting cycle is about to begin.