Flack Capital Markets | Ferrous Financial Insider
August 23, 2024 – Issue #446
August 23, 2024 – Issue #446
Overview:
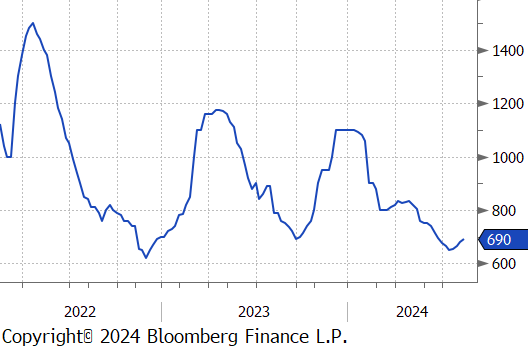
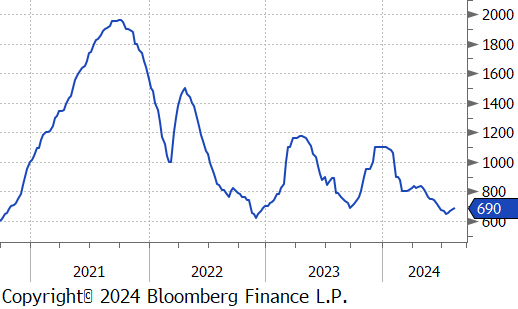
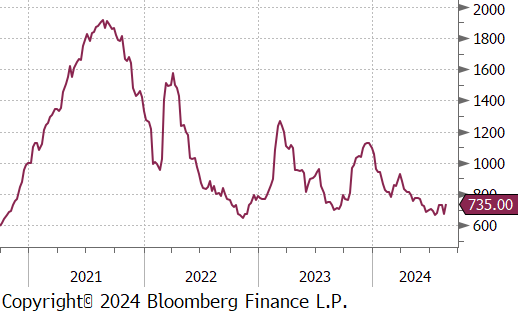
The HRC spot price rose by $10 or 1.5% to $690, continuing the upward trend after being stagnant last week. At the same time, the HRC 2nd month future jumped up by $64 or 9.5% to $735, rebounding from last weeks drop.
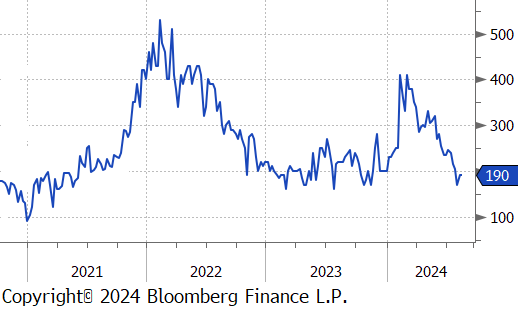
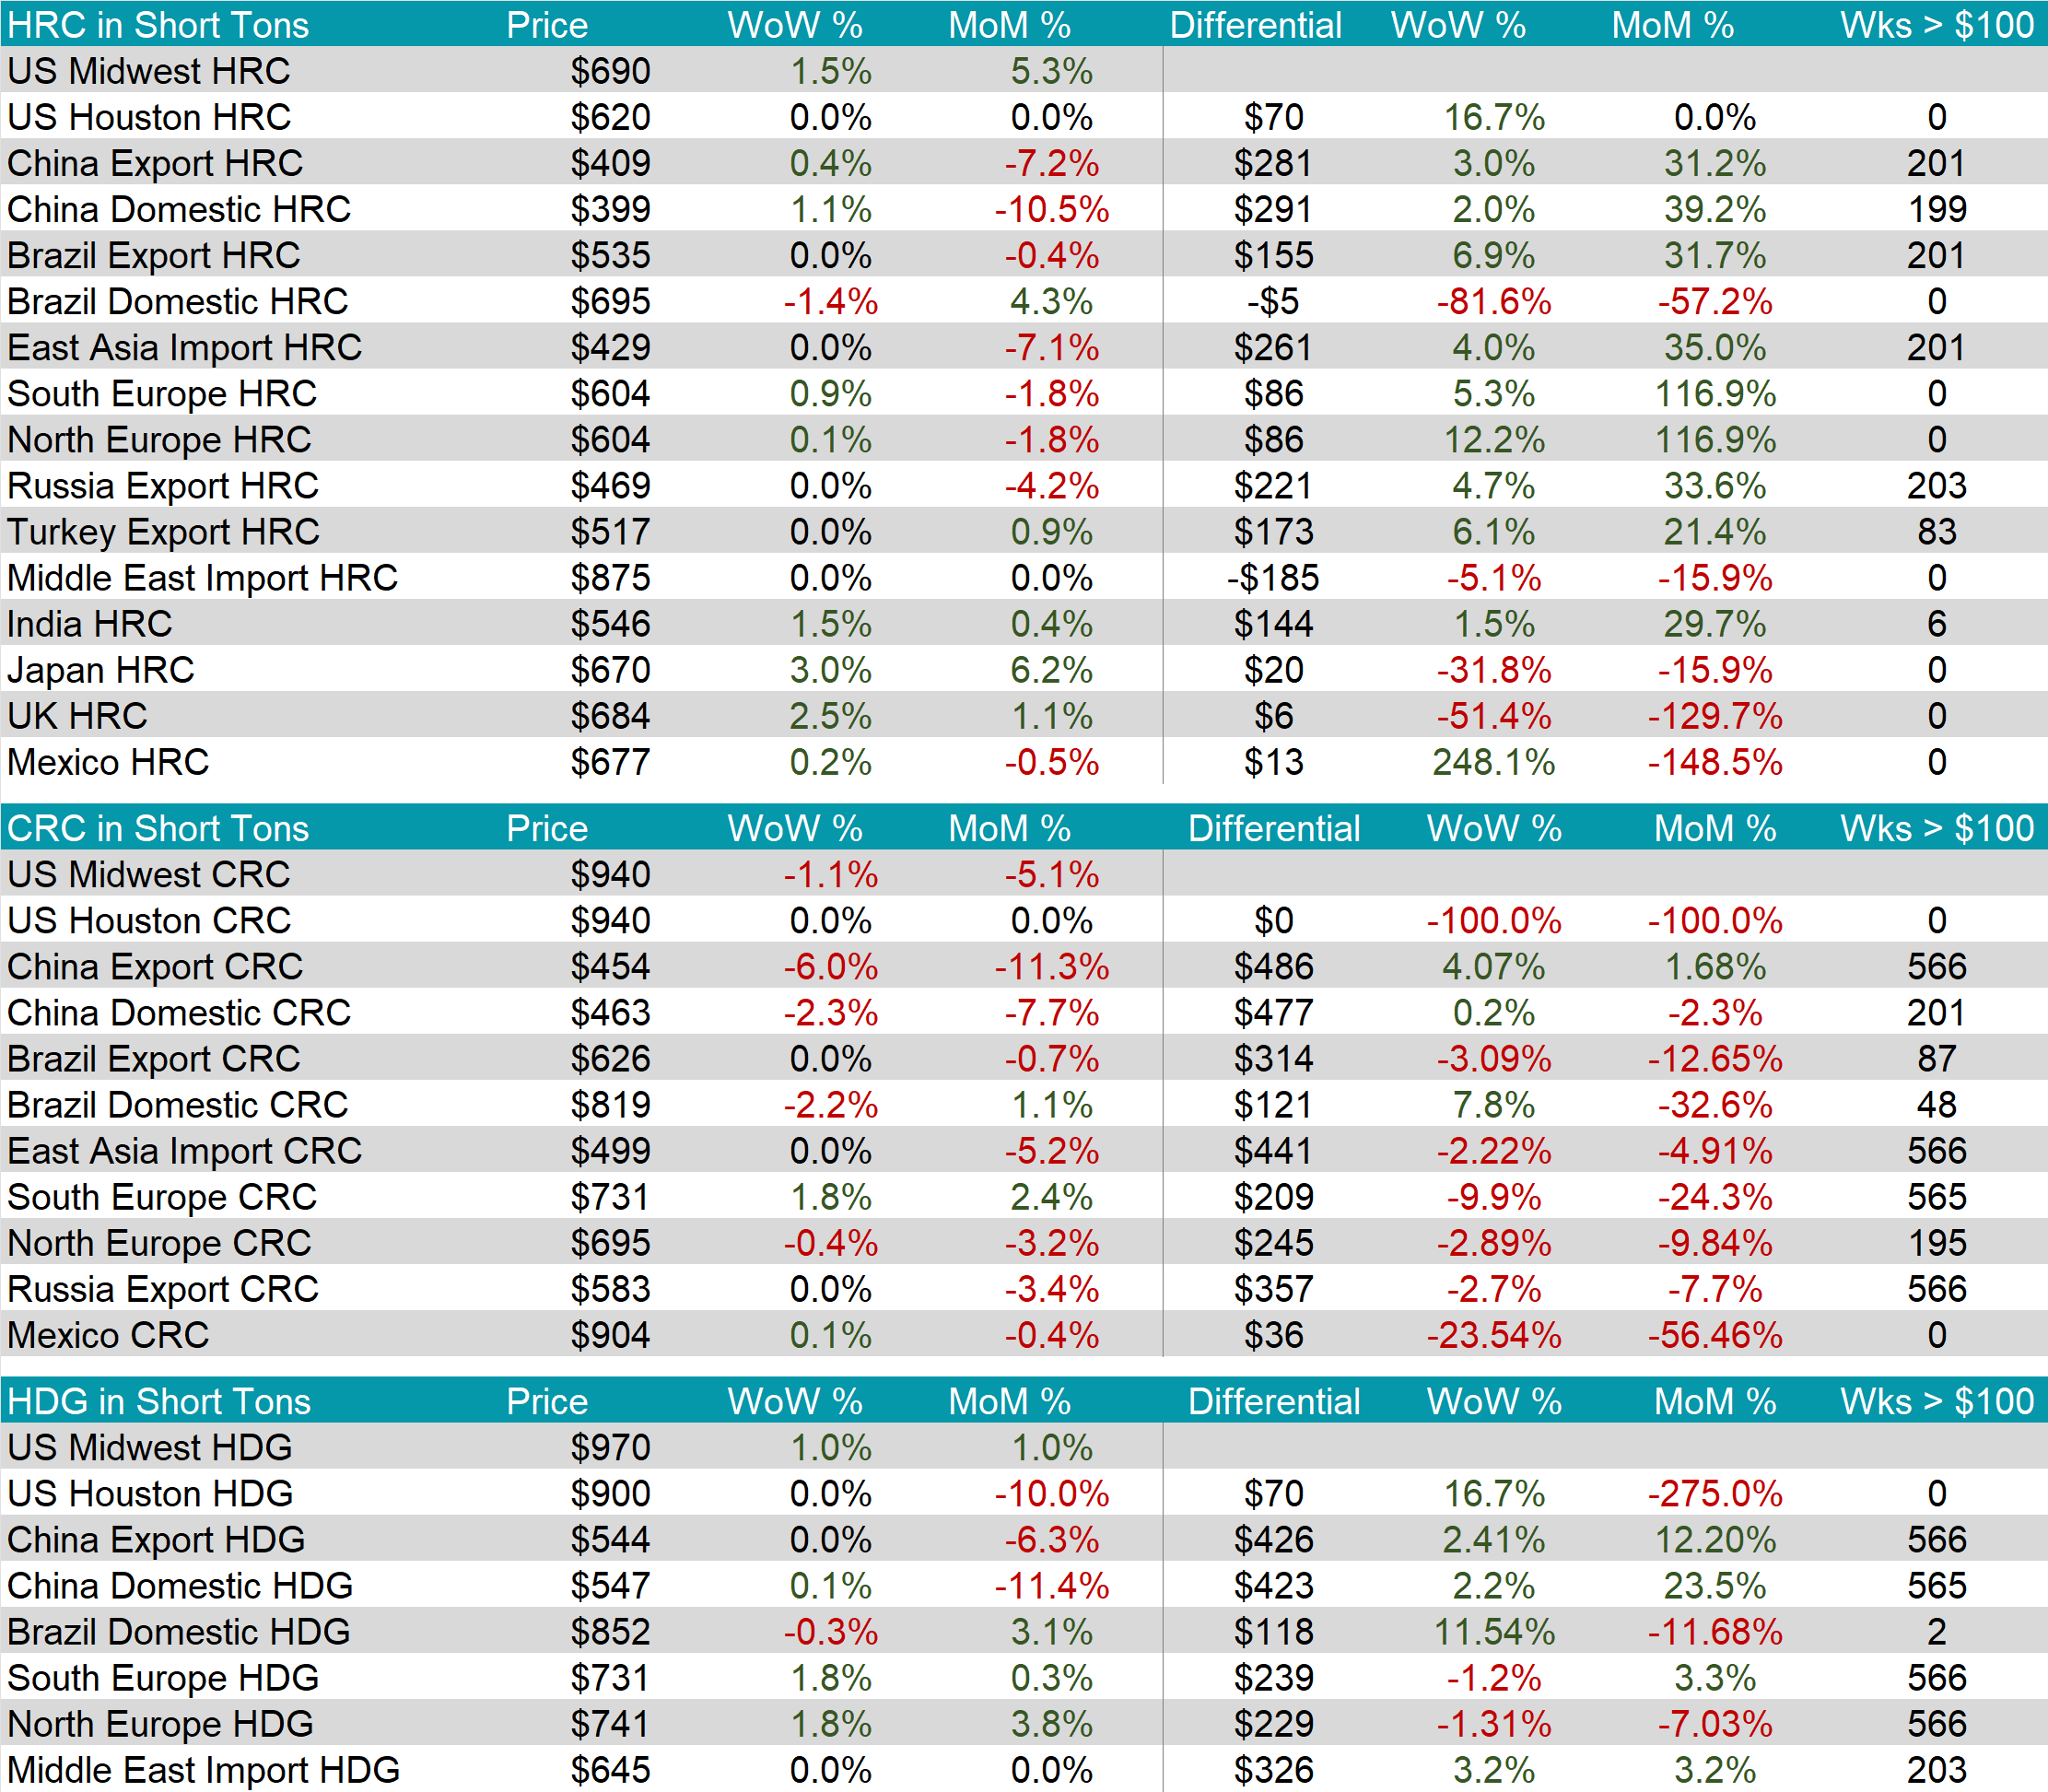
Tandem products were mixed, with CRC declining by $30 while HDG increased by $10, resulting in the HDG – HRC differential remaining unchanged at $190.
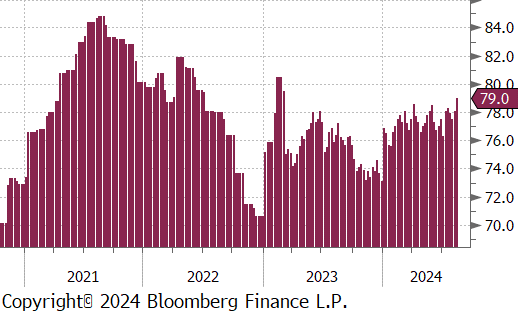
Mill production notably shot up, with capacity utilization ticking up by 0.9% to 79.0%, bringing raw steel production up to 1.754m net tons – the highest level in over a year.
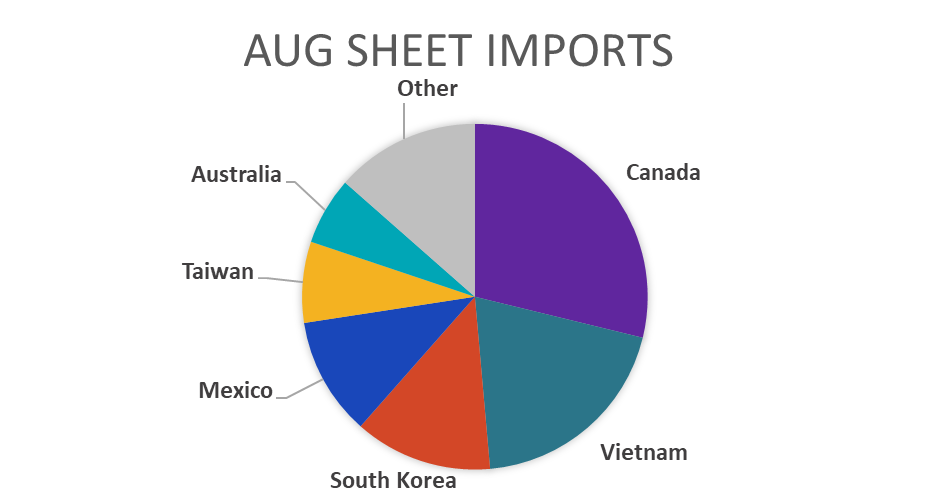
August Projection – Sheet 956k (up 67k MoM); Tube 414k (up 58k MoM)
July Projection – Sheet 888k (up 63k MoM); Tube 356k (down 57k MoM)
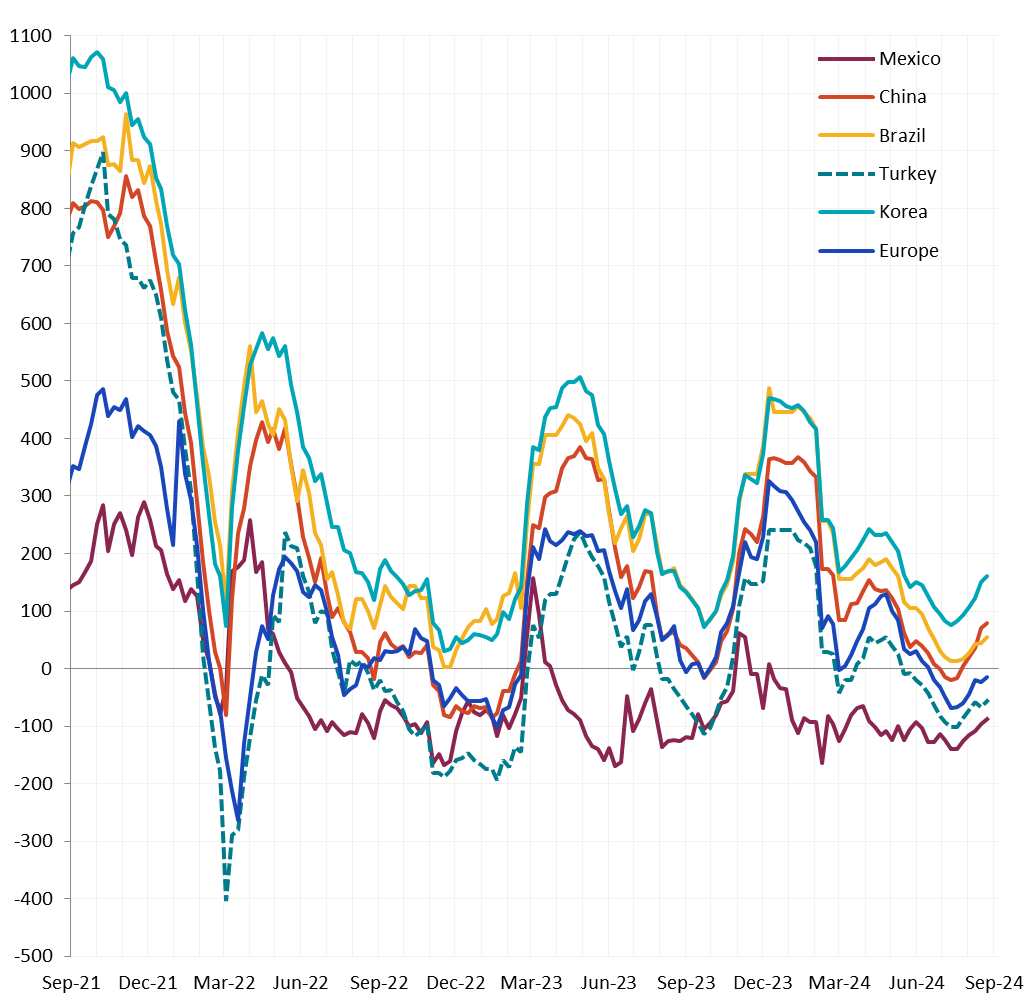
All watched global differentials expanded this week, with their prices rising or staying the same. Other notable countries that saw increases were Japan, rising by 3.0%, and the UK HRC, up by 2.5%.
Scrap
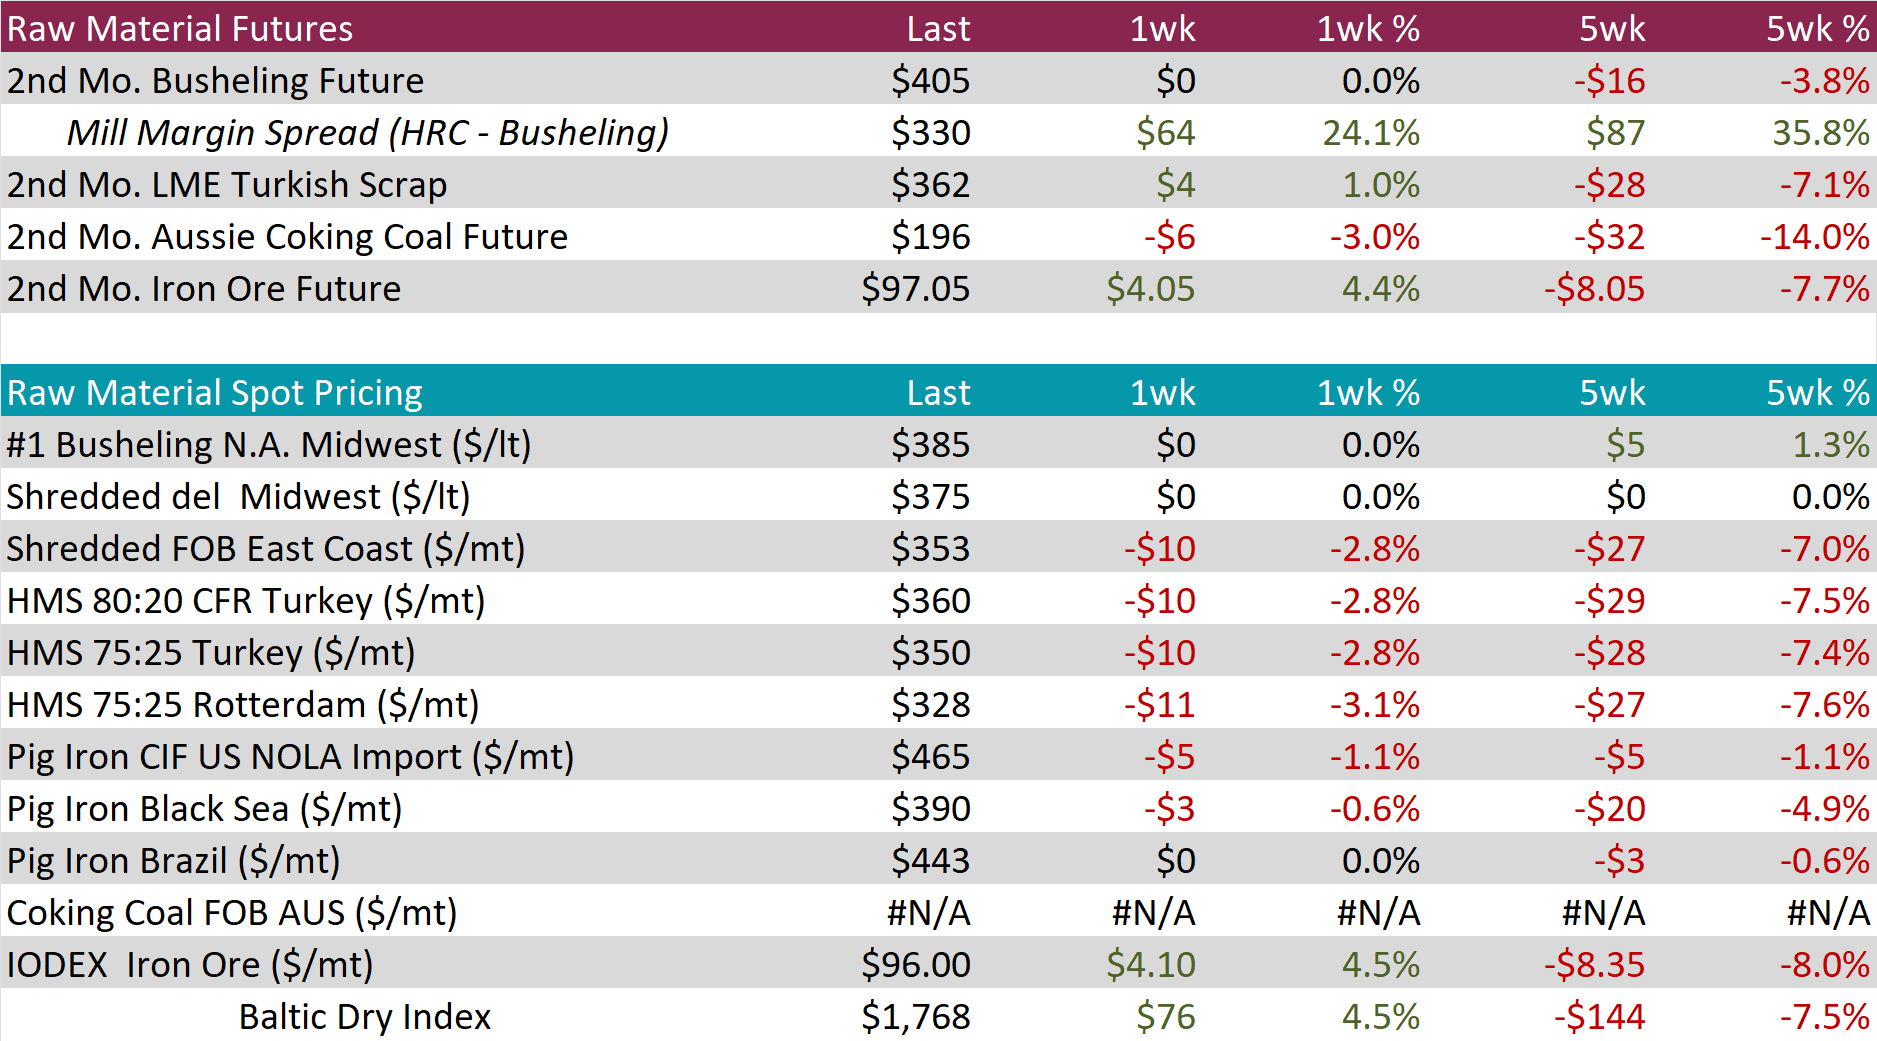
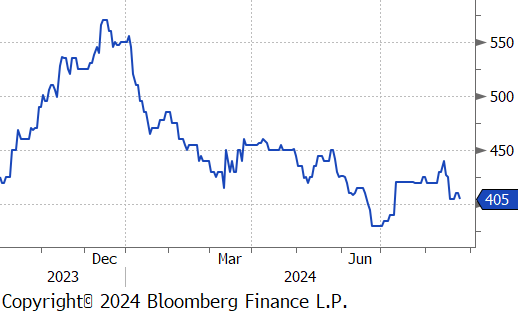
The busheling 2nd month future held steady at $405, resulting in the five-week price change to be down by $16 or -3.8%.
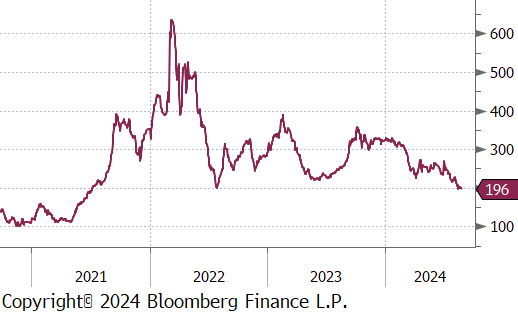
The Aussie coking coal 2nd month future fell by $6 or -3.0% to $196, marking the first time below the $200 level since July 2021.
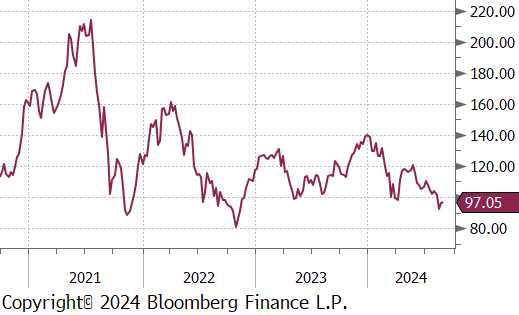
The iron ore 2nd month future inched up by $4.05 or 4.4% to $97.05, marking the first price increase after three consecutive weeks of declining.
Dry Bulk / Freight
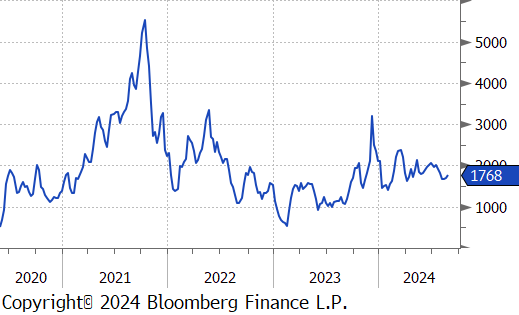
The Baltic Dry Index climbed by $76 or 4.5% to $1,768, marking the third straight week of price increases.
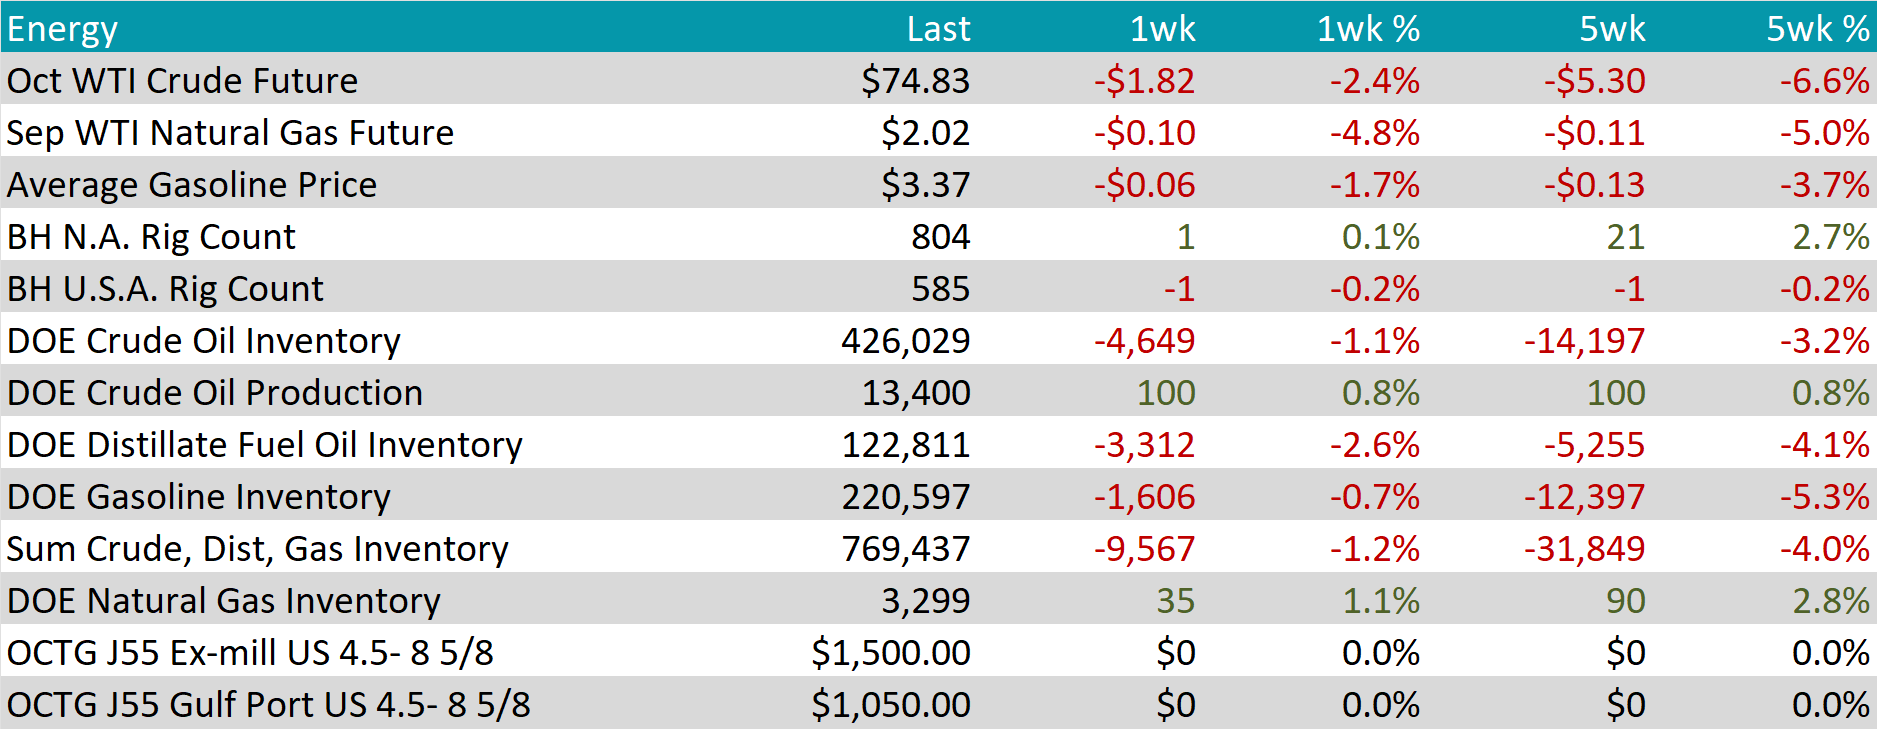
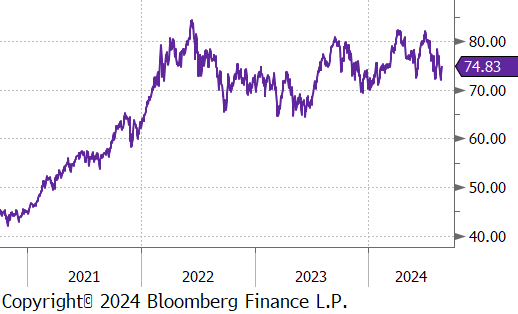
WTI crude oil future lost $1.82 or -2.4% to $74.83/bbl.
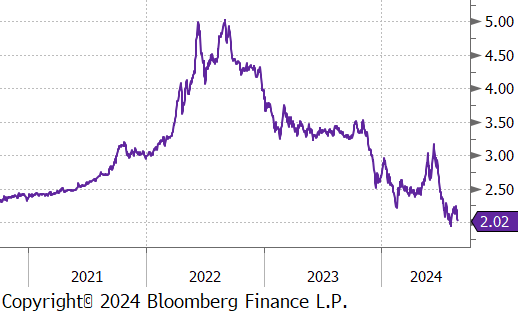
WTI natural gas future lost $0.10 or -4.8% to $2.02/bbl.
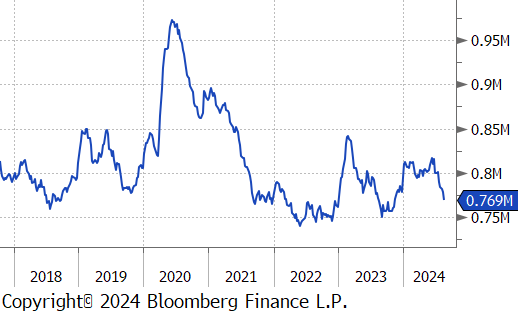
The aggregate inventory level continued to slip, experiencing a -1.2% drop this week, marking the fifth consecutive week of decreases.
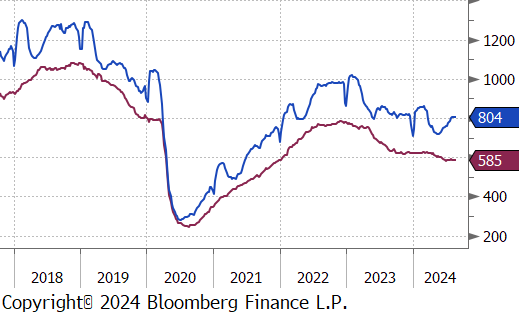
The Baker Hughes North American rig count added 1 rig, bringing the total count to 804 rigs. Meanwhile, the US rig count reduced by 1 rig, bringing the total count to 585 rigs.
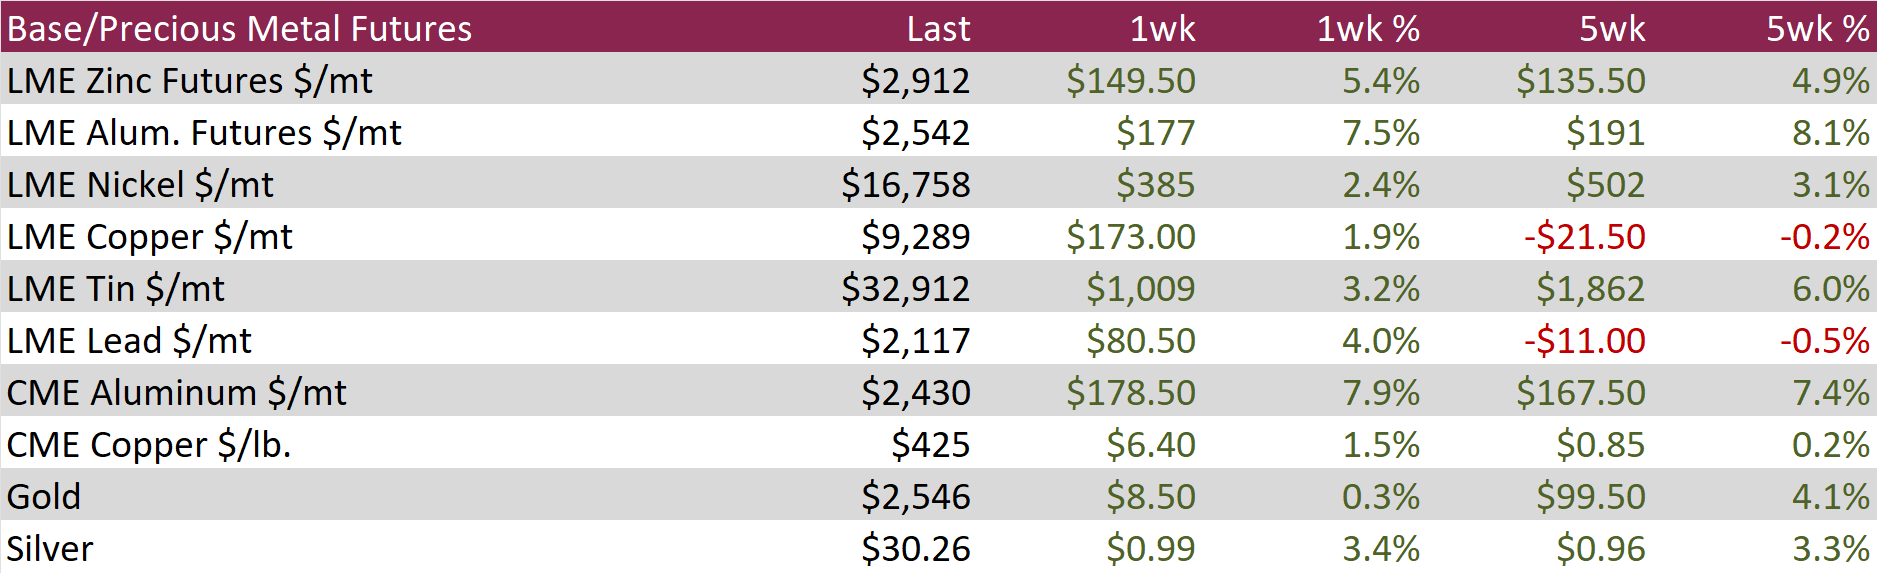
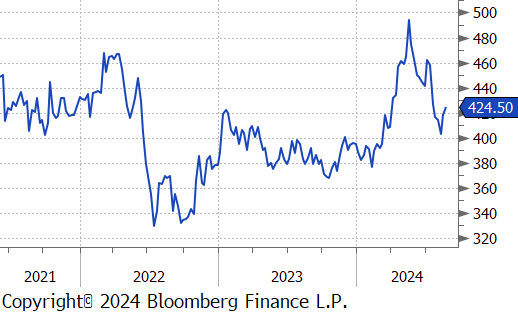
Aluminum futures surged by $177 or 7.5% to $2,542, reaching a six-week high as increased fund buying signaled a shift towards a more optimistic market outlook. This rise is viewed as a correction to fair value following last month’s sharp decline. Adding to the momentum, China’s aluminum imports unexpectedly increased by 11.5% year-on-year in July, despite robust domestic production. The market is also feeling pressure from the rising cost of alumina, a key raw material in aluminum production, as supply cuts in Australian refineries have tightened availability. This shortage has led to a significant drawdown in alumina inventories, further fueling the aluminum price rally.
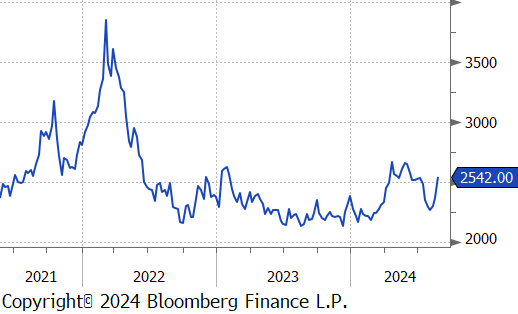
Copper futures soared by $6.40 or 1.5% to $425, reaching a five-week high driven by signs of stronger Chinese demand and growing expectations for US interest rate cuts this year. In China, copper wire rod makers capitalized on lower prices by ramping up orders, while grid companies increased output to meet their annual production targets. Investors are now closely watching the upcoming Chinese manufacturing PMI data for insights into demand trends in the world’s largest copper consumer.
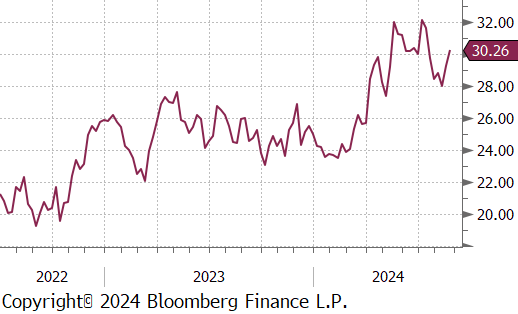
Silver rose by $0.99 or 3.4% to $30.26, nearing a five-week high as Federal Reserve Chair Jerome Powell fueled expectations for a rate cut in September. In his Jackson Hole address, Powell signaled that it might be time to adjust monetary policy due to rising risks in the labor market, while also expressing confidence that inflation would return to the Fed’s 2% target. While the market widely anticipates a policy easing next month, there is still uncertainty about the size of the initial rate cut. Traders are currently pricing in a total of 100 basis points of reductions across the Fed’s remaining three meetings this year. Additionally, safe-haven demand for precious metals has increased following Hezbollah’s missile attacks on Israel over the weekend, in retaliation for the assassination of a senior commander in Beirut last month.
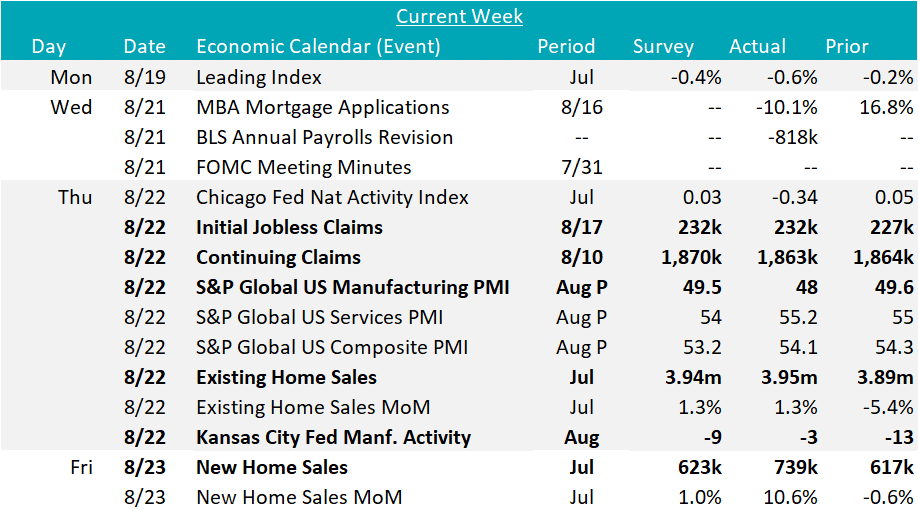
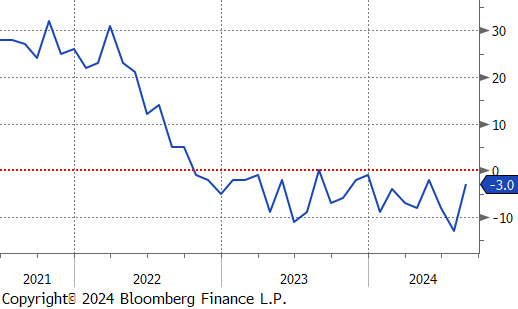
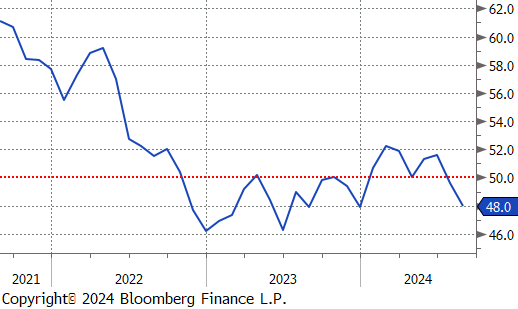
The August Kansas City Fed Manufacturing Survey printed up to -3, from July’s -13 level, also above expectations of a -9 print. Furthermore, August’s preliminary S&P Global US Manufacturing PMI dropped to 48 in August, down from 49.5 in July and the expected flat print at 49.5. This marks the second straight month in contraction territory, while the Services PMI edged up to 55.2, above last month’s 55 print and expectations of a decline to 54. As has been the case for more than a year – services continue to drive overall economic growth, as industrials face strong headwinds.
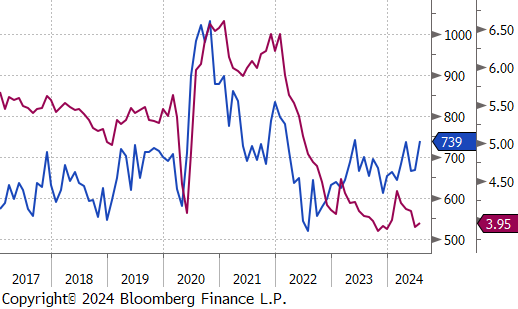
The next batch of housing data signaled signs of life, as falling mortgage rates work their way through the system. Existing and New home sales both increased in July, existing sales were in line with the expected 1.3% monthly increase, while new sales rose 10.6% vs. expected 1%. Given the fact that mortgage rates only started to fall at the very end of July, this is an encouraging signal for underlying demand.
Another notable data point from this week was the BLS preliminary annual payrolls benchmark revision which suggested that payroll growth was overstated by -818k in the March 2023 to March 2024 period. For months, this was anticipated, with forecasts for the revision coming in at a wide range of 400k-1.1m. This tells us that the labor market grew at a monthly pace of 174k versus the previously assumed 242k. Given the fact that the replacement rate for hiring is ~100k given U.S. demographics, this simply provides that context that the labor market was “strong” rather than “on fire” over the period. Additional labor market data show initial and continuing jobless claims remain at elevated but healthy levels. Initial claims were up slightly to 232k from 227k, while continuing claims decreased to 1,863k from 1,864k. Overall, the labor market should continue cooling in the coming months and the rate at which it does will be instrumental for how the FED determines the pace of the interest rate cutting cycle.