Flack Capital Markets | Ferrous Financial Insider
August 30, 2024 – Issue #447
August 30, 2024 – Issue #447
Overview:
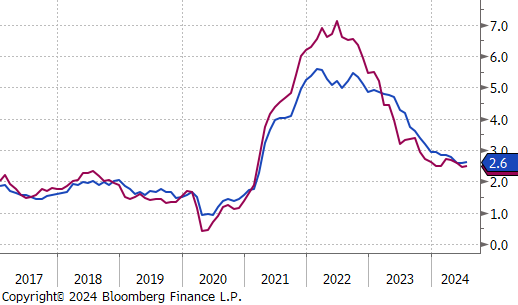
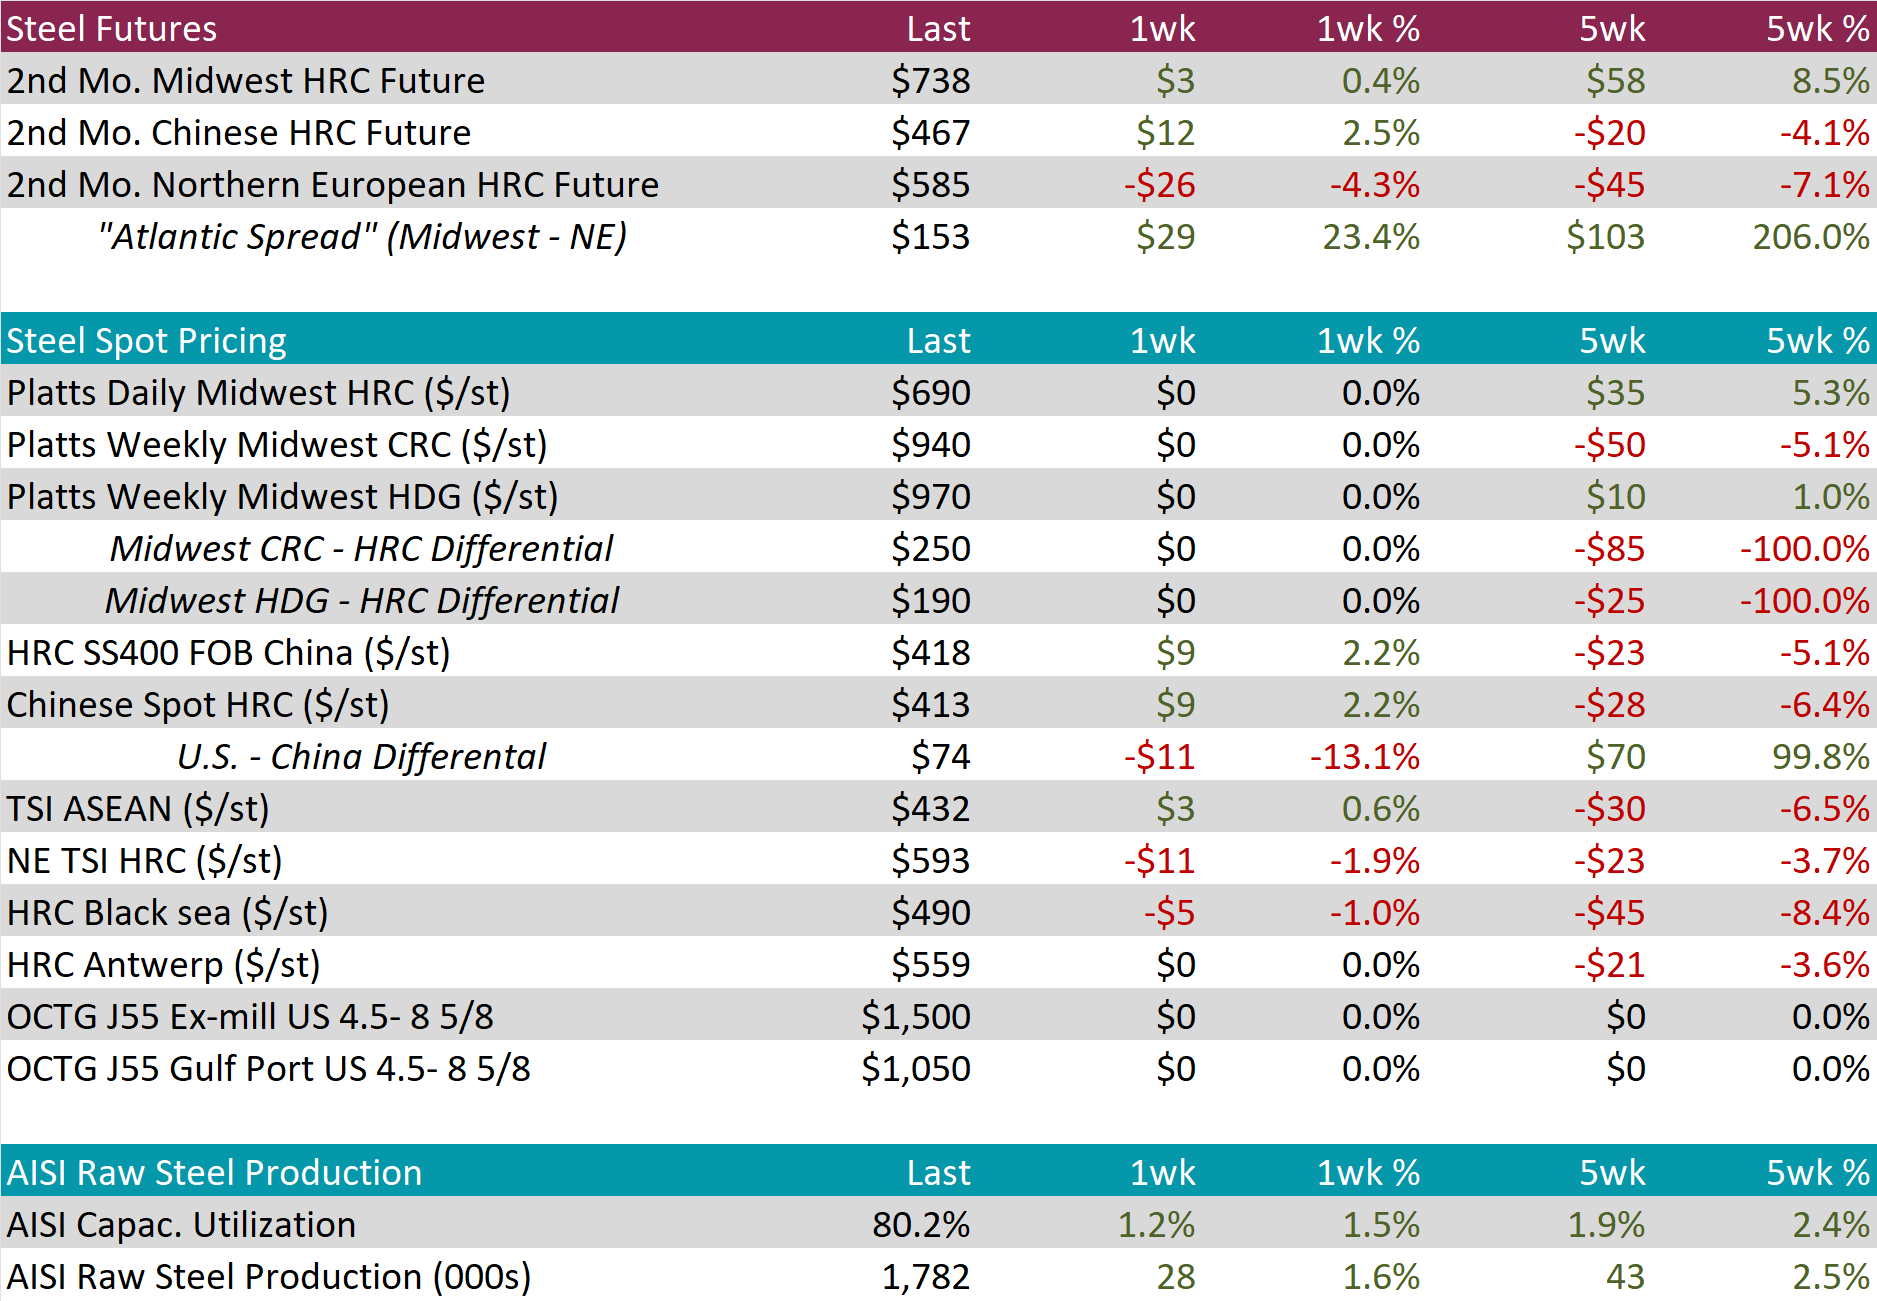
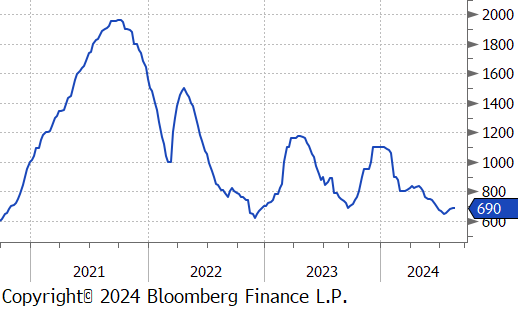
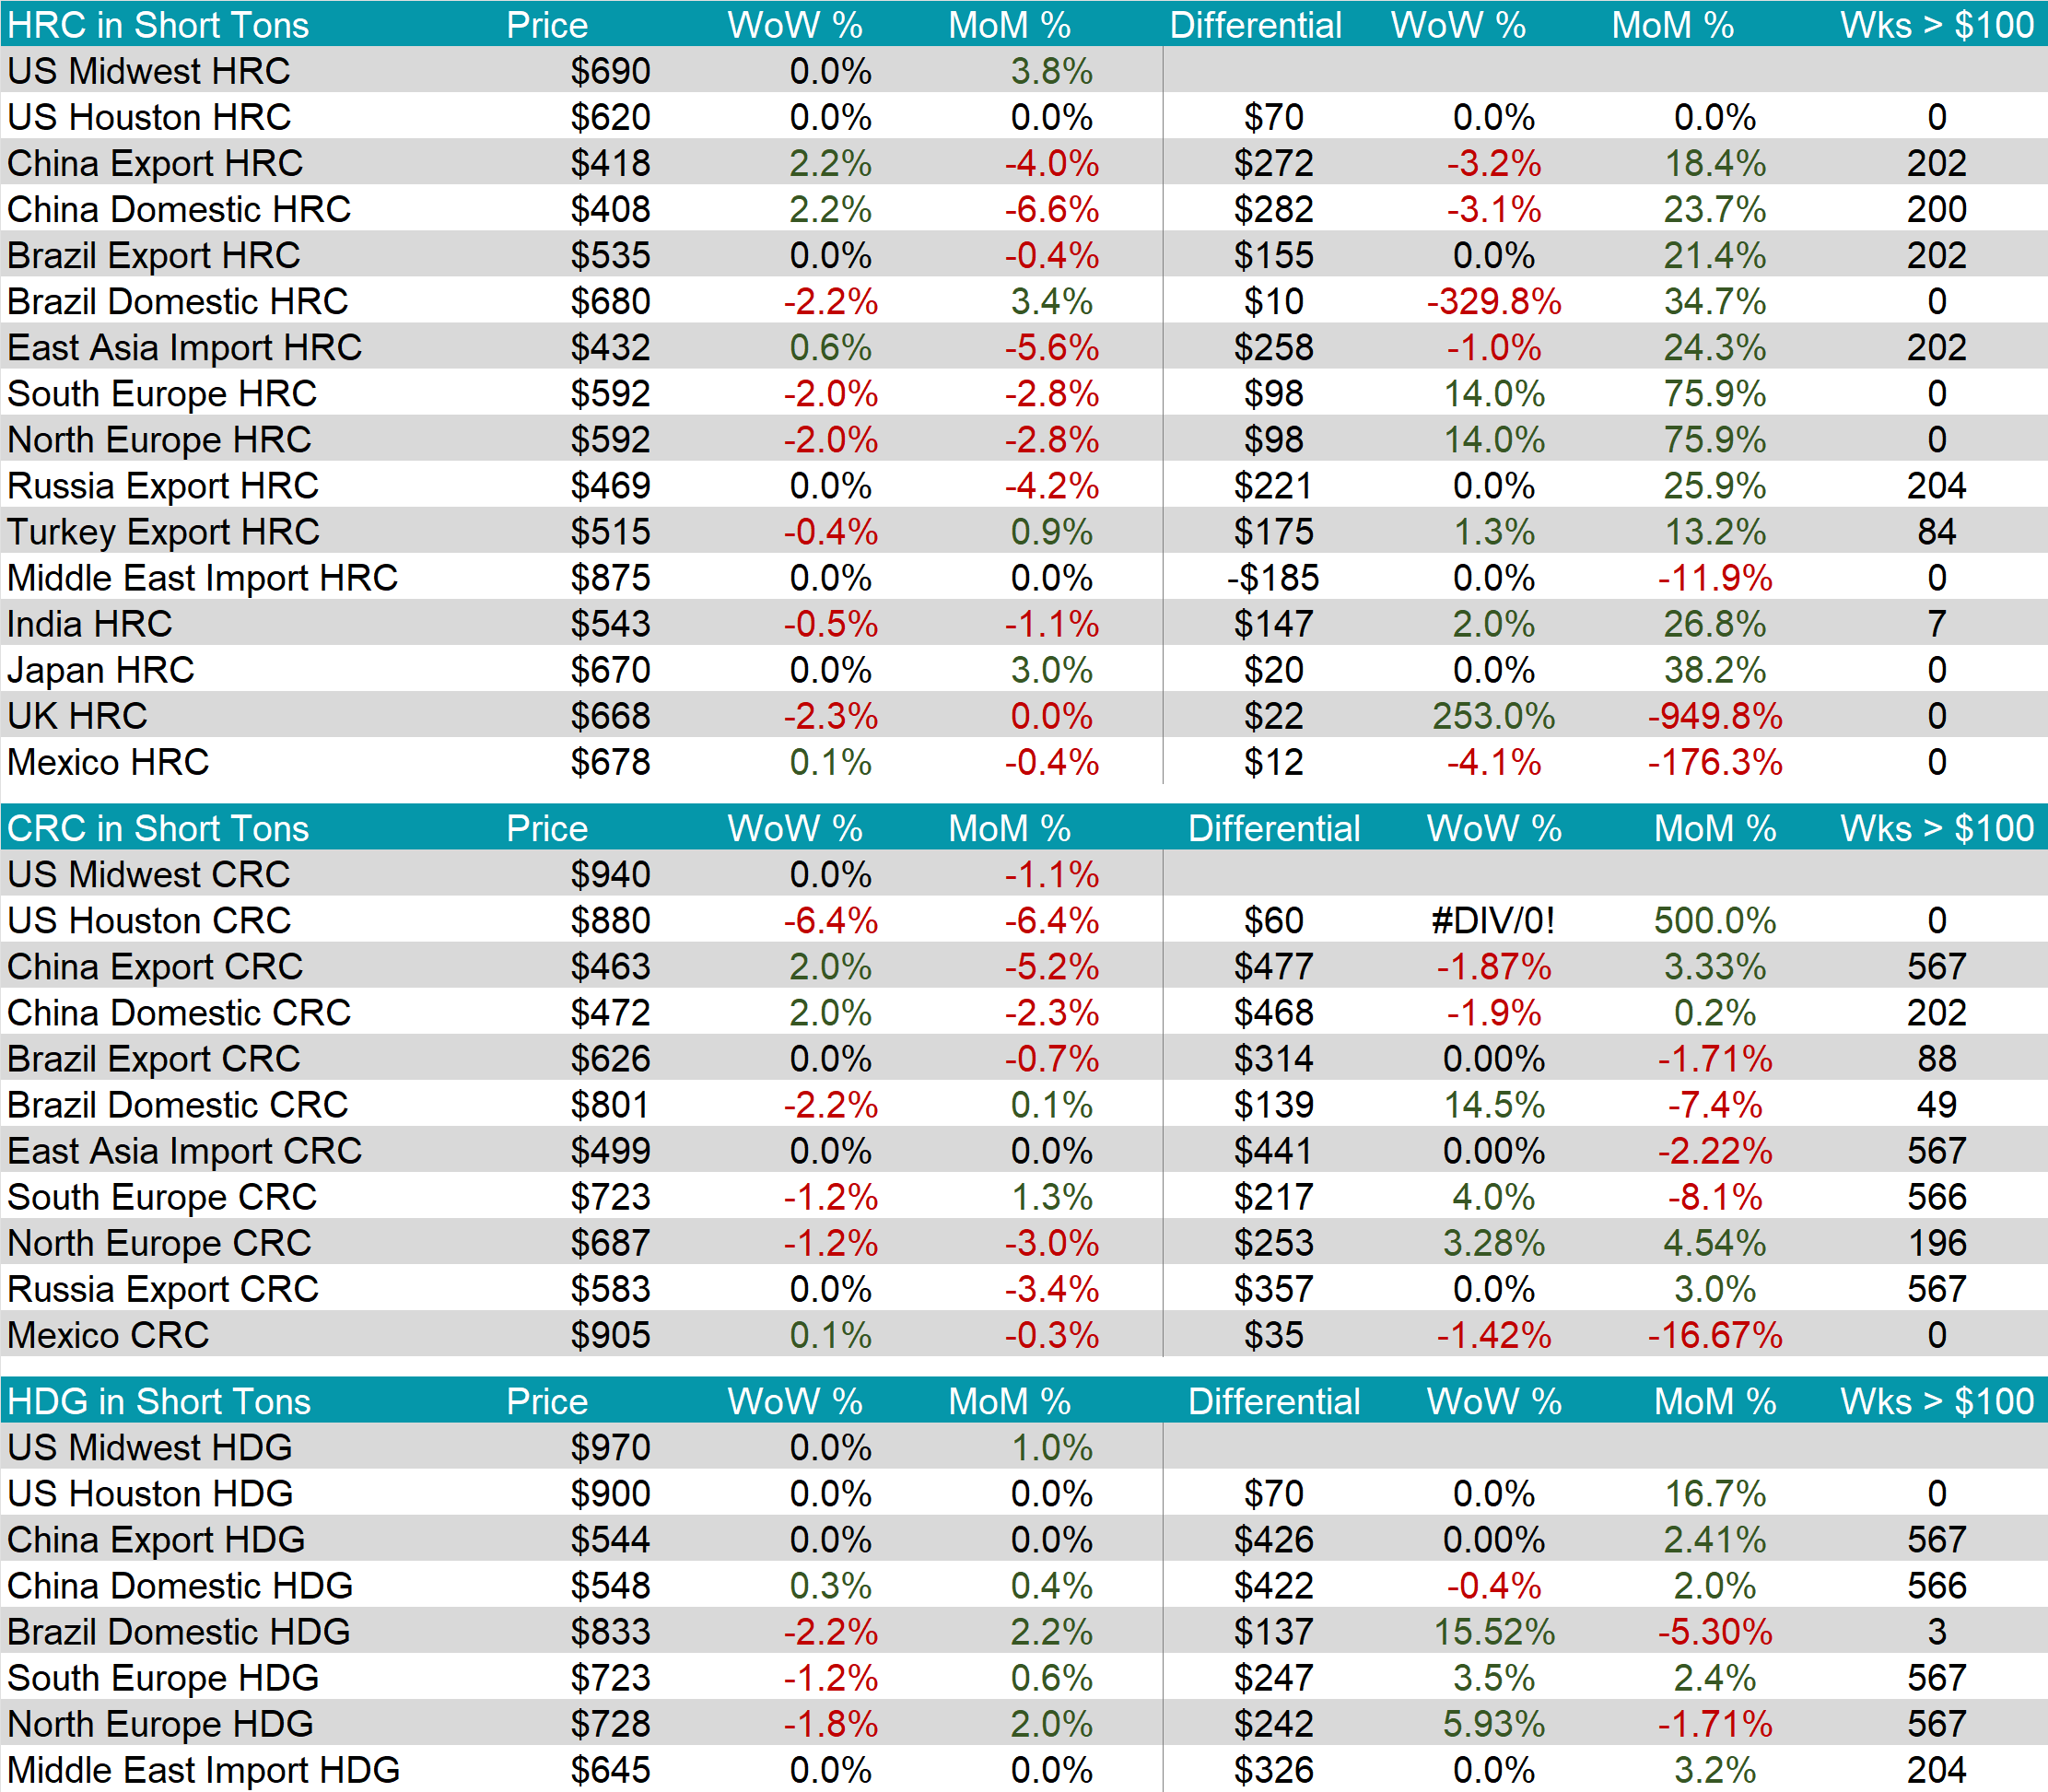
The HRC spot price remained unchanged at $690. At the same time, the HRC 2nd month future inched up by $3 or 0.4% to $738, marking the second consecutive week of increases and the highest price reached since May.
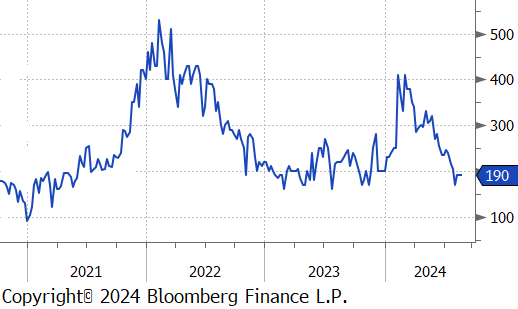
Tandem products both held steady, resulting in the HDG – HRC differential to also remain unchanged at $190.
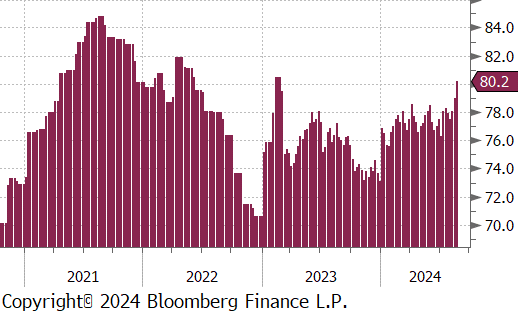
Mill production soared, with capacity utilization ticking up by 1.2% to 80.2%, bringing raw steel production up to 1.782m net tons – the highest level since April 2022.
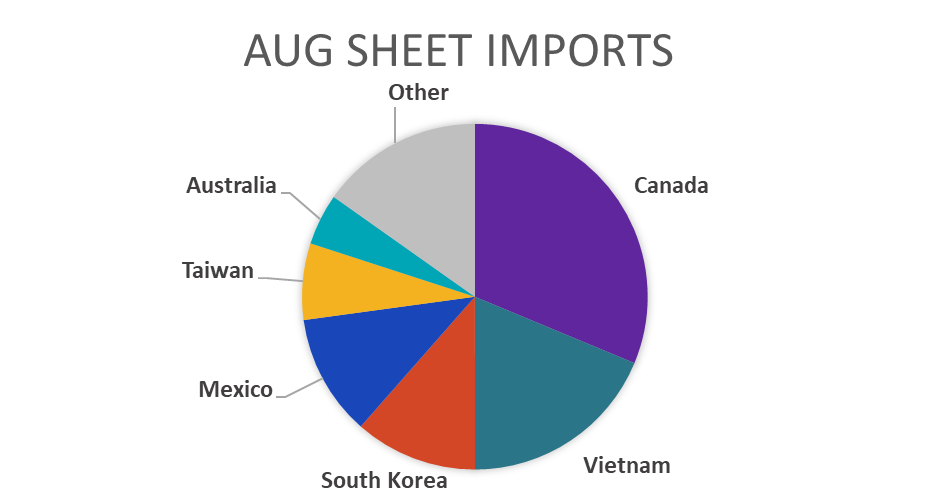
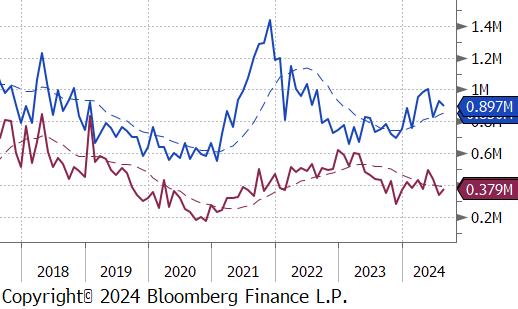
August Projection – Sheet 897k (down 34k MoM); Tube 379k (up 42k MoM)
July Census – Sheet 931k (up 105k MoM); Tube 337k (down 76k MoM)
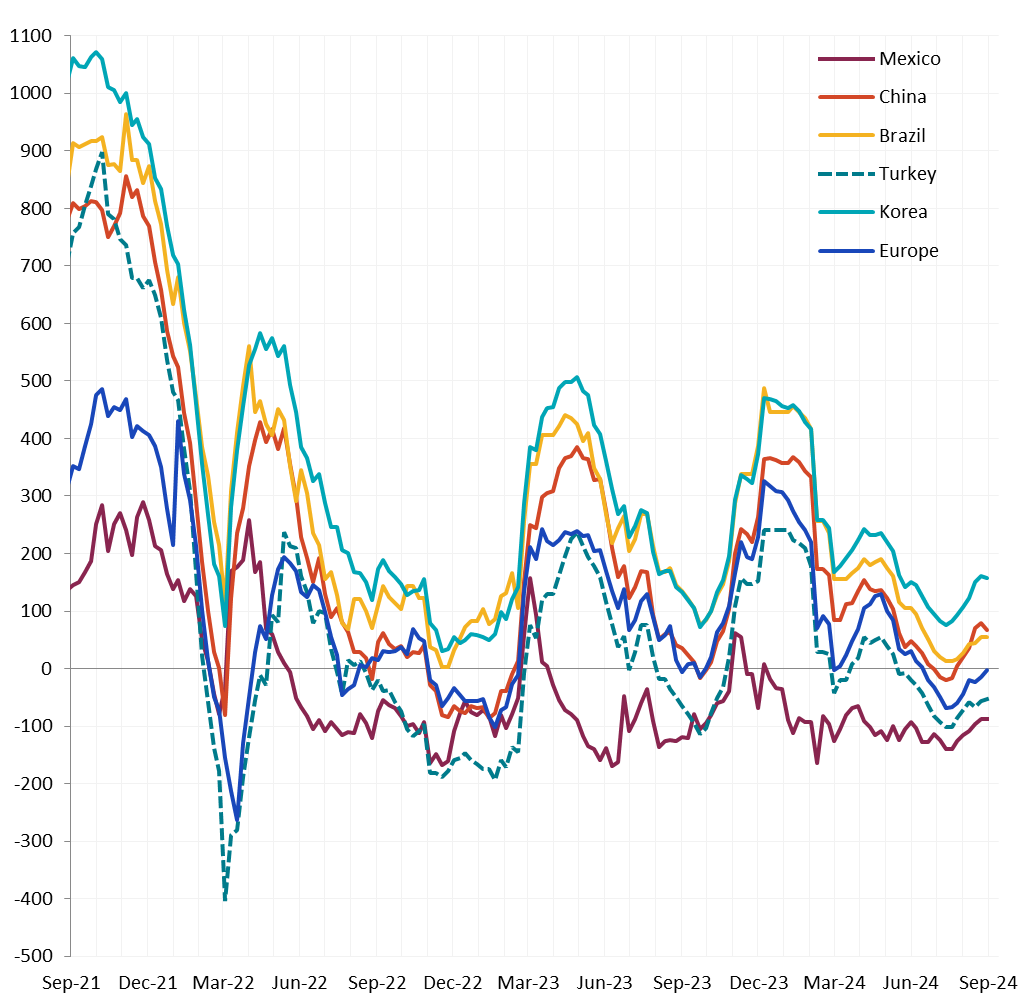
Watched global differentials varied this week, this China Export HRC rising by 2.2%. North Europe HRC falling by -2.0%, and Turkey Export HRC declining by -0.4%.
Scrap
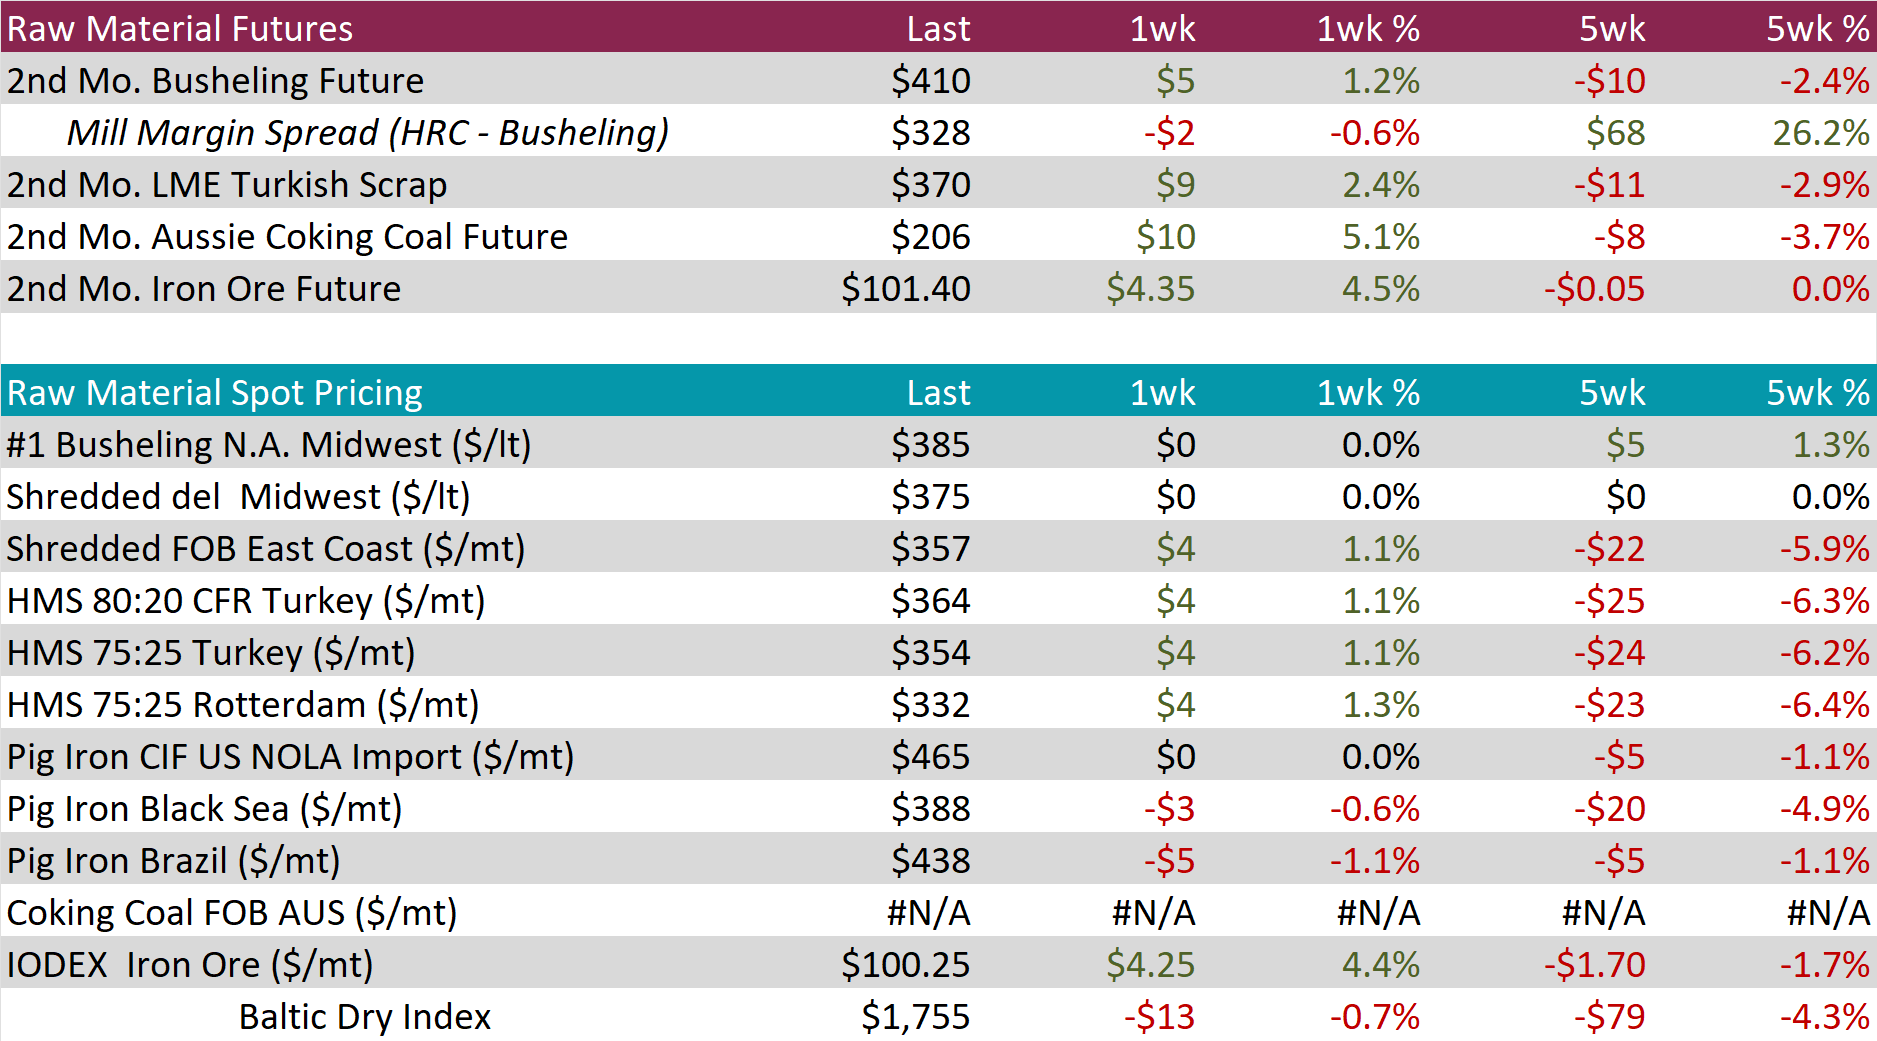
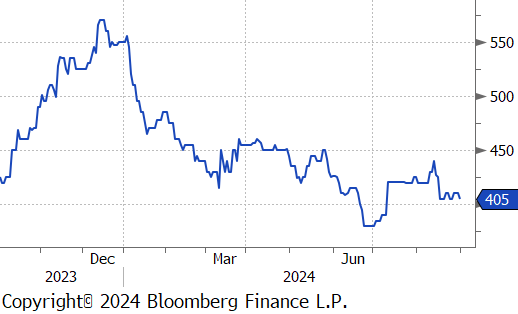
The busheling 2nd month future climbed by $5 or 1.2% to $410, bringing the five-week price change to be down by $10 or -2.4%.
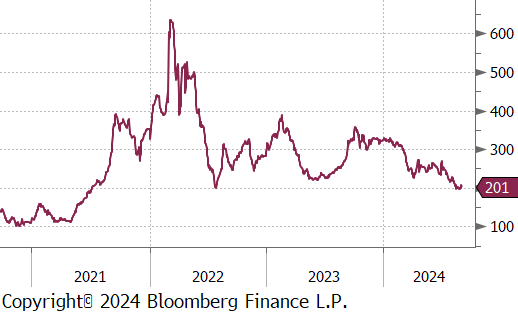
The 2nd month Aussie coking coal future rose by $10 or 5.1% to $206, rebounding from last week’s price drop.
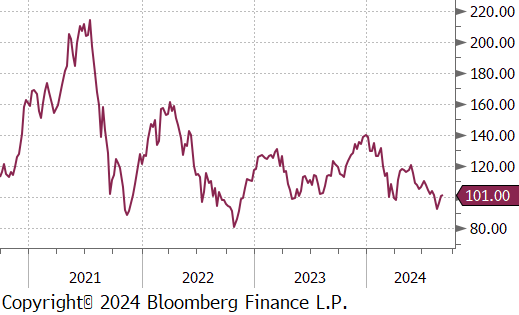
The iron ore 2nd month future increased by $4.35 or 4.5% to $101.40, marking the second consecutive week of price increases.
Dry Bulk / Freight
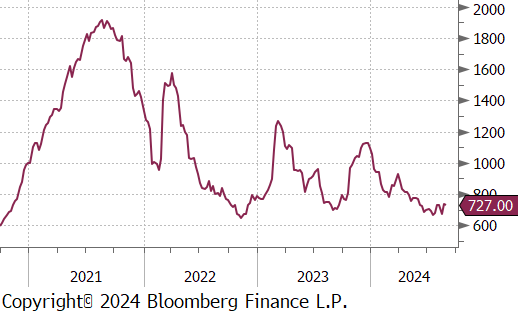
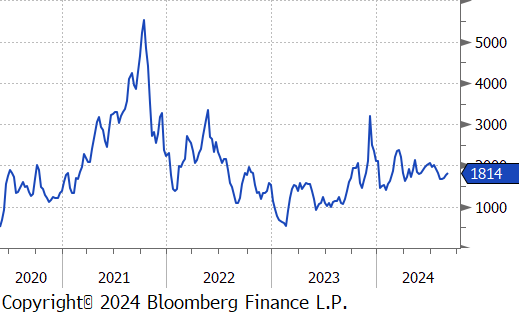
The Baltic Dry Index fell by $13 or -0.7% to $1,755, reversing the three consecutive weeks of increases.
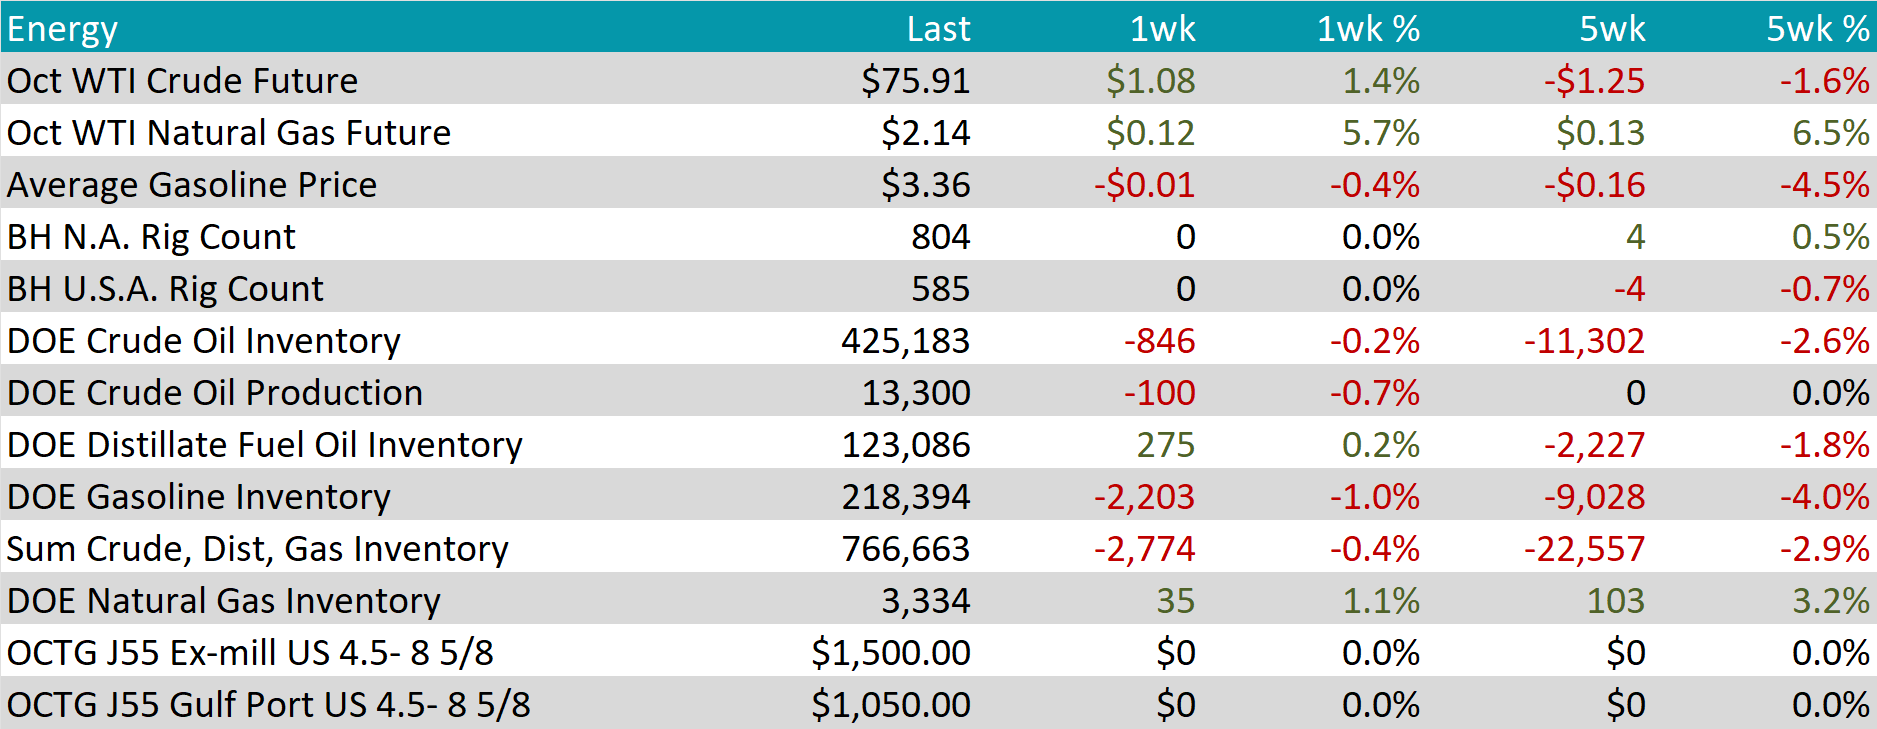
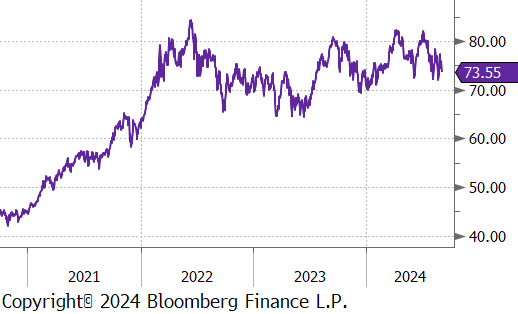
WTI crude oil future gained $1.08 or 1.4% to $75.91/bbl.
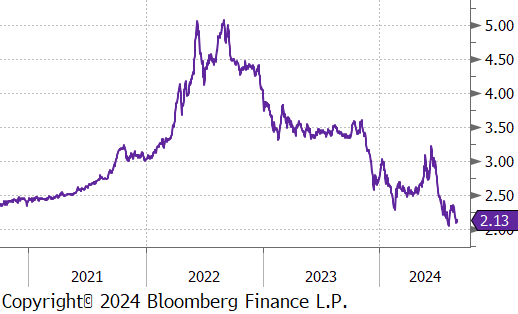
WTI natural gas future gained $0.12 or 5.7% to $2.14/bbl.
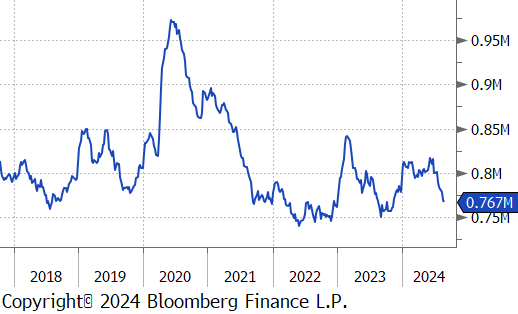
The aggregate inventory level continued to decline, this time declining by -0.4%.
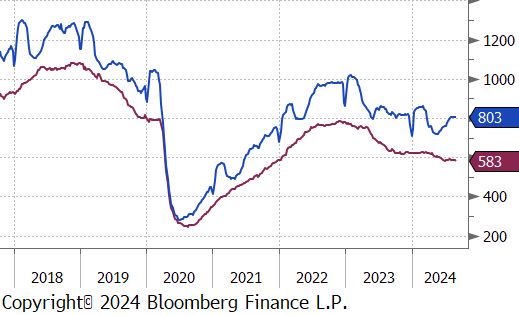
The Baker Hughes North American rig count remained unchanged at 804, and, similarly, the US rig count held steady at 585.
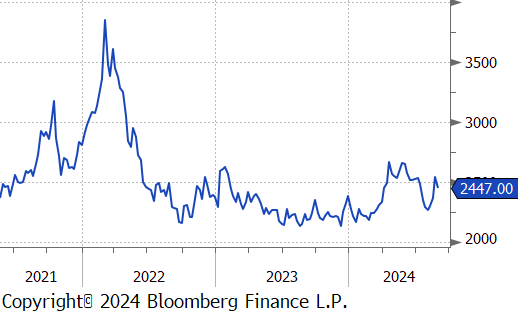
Aluminum futures declined by $85 or -3.3% to $2,458. This decline mirrors a broader weakness in base metals, primarily driven by diminishing demand from China. The downturn is underscored by China’s official manufacturing PMI, which unexpectedly fell to 49.1 in August, marking the year’s most significant contraction in factory activity and dimming the demand outlook. Adding to the negative sentiment, Beijing has been reluctant to provide fiscal support to traditional manufacturing sectors, choosing instead to invest in emerging technologies. Concurrently, aluminum supply in China has increased, fueled by a boost in hydroelectric power availability in Yunnan following improved rainfall, which has added further pressure on prices.
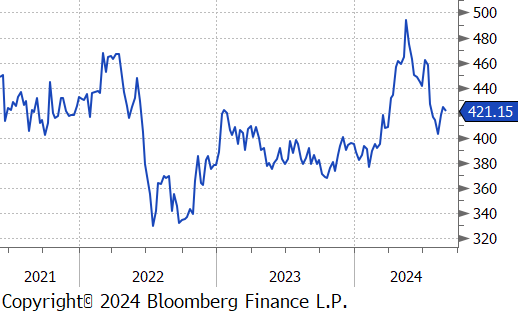
Copper futures fell by $2.25 or -0.5% to $422, pressured by increasing inventories and weak demand from China. Inventories in LME warehouses rose by 8,700 tons, reflecting subdued market conditions. On the demand front, the Australian mining giant BHP Group revised its forecast downward for China’s copper demand, citing concerns over the country’s economic recovery. Additionally, official data indicated further contraction in China’s manufacturing activity in August, though a private survey suggested that the sector had returned to growth, expanding more than expected last month. Meanwhile, a stronger U.S. dollar, bolstered by steady US PCE inflation readings, also weighed on copper prices as traders reduced expectations for aggressive Federal Reserve rate cuts.
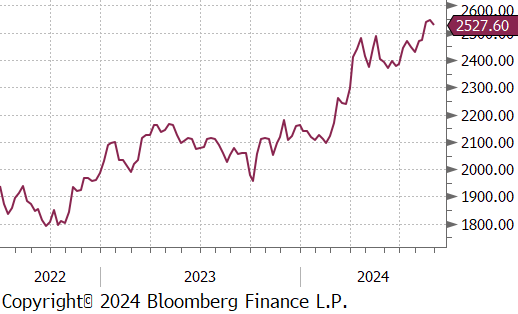
Gold rose by $14 or 0.5% to $2,560. Key data releases this week, such as the ISM surveys, JOLTS job openings, ADP employment report, and non-farm payrolls, are being closely watched, especially after several Fed officials recently underscored growing risks to the labor market. Recent U.S. inflation figures, with both headline and core PCE prices rising by 0.2% in July, have moderated expectations for a substantial 50 basis point rate cut by the Fed in September. However, markets still anticipate a total of 100 basis points in rate cuts from the Fed across its three remaining meetings this year, which would reduce the opportunity cost of holding non-yielding assets like gold. In Europe, the ECB is also expected to lower rates, following a significant deceleration in inflation according to August’s preliminary data.
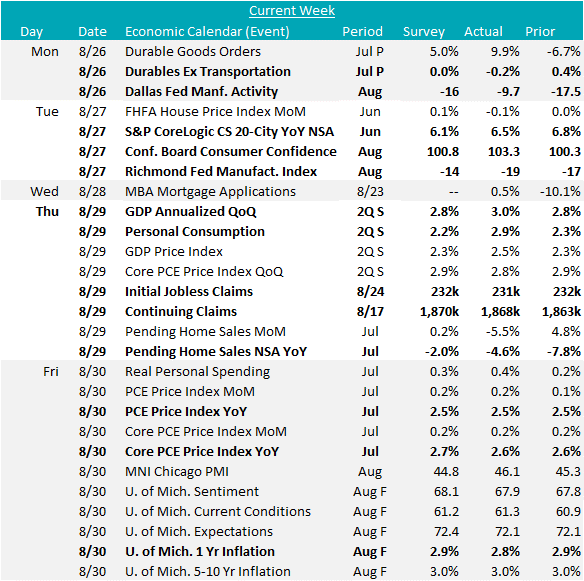
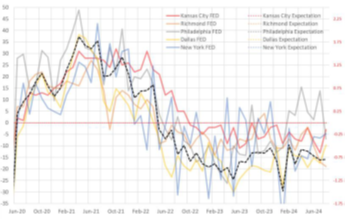
The August FED Manufacturing Surveys paint a picture of suppressed activity overall and suggest that we will not see a rebound into expansion for ISM Manufacturing PMI. The individual readings are: Empire (NY) rose to -4.7, from -6.6 in July, above expectations of -6; Philadelphia fell sharply to -7 from July’s 13.9, below the anticipated 7; Kansas City rose to -3, up from -13 in July, above expected -9; Dallas improved to -9.7, from -17.5 in July, above expected -16; Richmond fell to -19, from -17 in July, below expected -14. While some survey regions improved, all of them are in contraction territory for the first time since February.
July Durable Goods New Orders show a rebound in transportation with topline orders increasing by 9.9%, after a revised -6.9% decline in June. The Ex. Transportation data declined by -0.2%, a shift from the 0.1% growth seen in June and missing the forecasted flat reading.
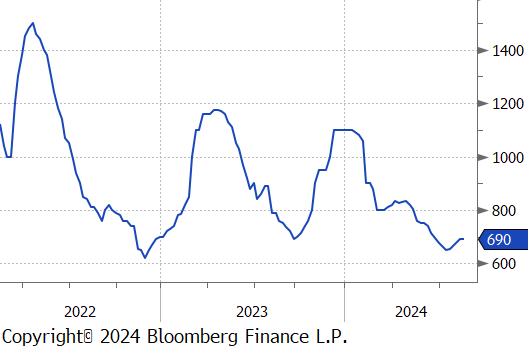
Pending Home Sales NSA YoY fell -4.6%, below expectations of -2%, to 70.2 in July, the lowest data on record, going back to 2001. The index has been grinding lower since January 2023, with affordability and low inventory as serious hurdles for the housing since the hiking cycle began. In the coming months underlying dynamics in the housing sector are poised to change, with mortgage rates already starting to decline ahead of FED cuts.
The second revision for Q2 2024 GDP increased to 3%, from 2.8%, and underscores stable consumption (up to 2.9%, from 2.3%) as the primary driver of economic growth, while all other components were revised lower. Topline & Core PCE (Personal Consumption Expenditures) came in line with expectations, with YoY readings for both unchanged compared to June, at 2.5% and 2.6%, respectively. Additionally, the U. of Michigan 1yr Inflation Expectations down to 2.8%, the lowest level since December 2020.