Flack Capital Markets | Ferrous Financial Insider
August 4, 2023 – Issue #391
August 4, 2023 – Issue #391
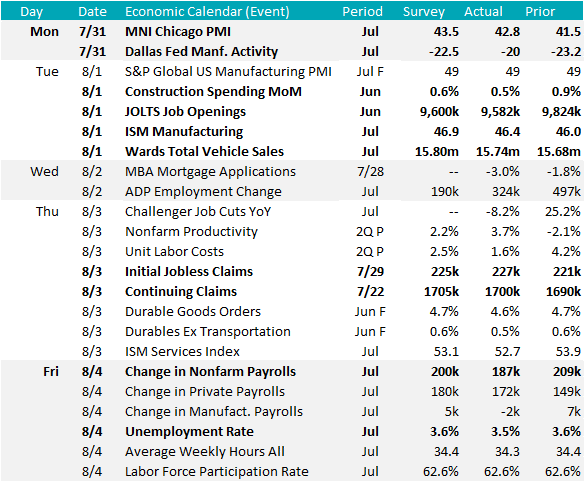
This month’s round of economic data further supports the recent trend of economic stability and supports the likelihood of the Goldilocks “soft landing” scenario playing out. The labor market continued cooling, construction spending remains resilient, and auto sales saw a moderate increase. Manufacturing, represented by the ISM Manufacturing PMI, remains the exception to this stable outlook in the steel-consuming sectors, as marked by its ninth consecutive month of contraction. That said, a closer look at the subcomponents within the report provides meaningful insight into the direction we may be headed.
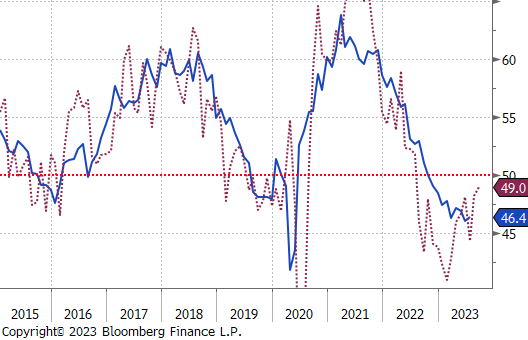
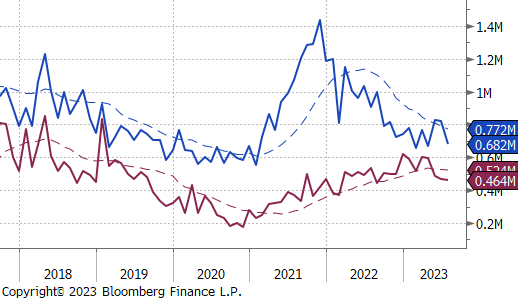
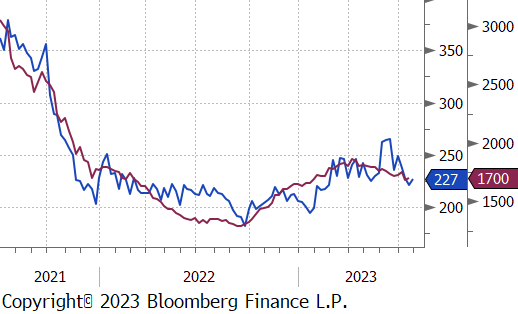
The top chart on the right shows the July PMI (blue), which printed slightly higher in July at 46.4 compared to 46 in June. The dotted line represents a 2-month forward look, displaying a strong correlation with the eventual topline print. This month’s print is the highest in 13 months, and while it is not expansionary, the trend clearly indicates a further deceleration of the contractionary trend. This movement is driven by demand-related factors surpassing inventory increases, implying a more promising development than if the roles were reversed and inventories were falling more significantly than demand.
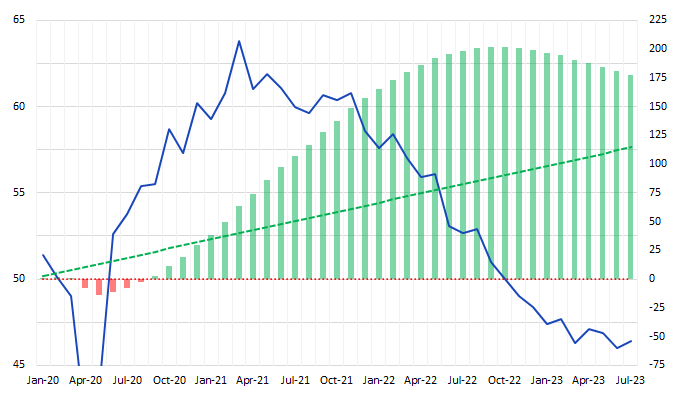
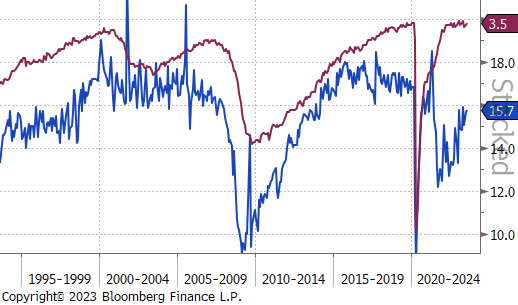
Stepping back, it is important to recognize that while the data do not suggest a meaningful expansion cycle is around the corner, stability at current or slightly lower levels for an extended period still signifies a stronger manufacturing sector than the long-term sustained trend would have projected at the beginning of 2020. The second chart displays the same ISM Manufacturing PMI in blue, while the dashed line represents the historical growth trend for manufacturing. This trend should be compared to the bars which represent the actual cumulative expansion/contraction of the index. The takeaway is clear: once the dust settles in this downturn, the U.S. manufacturing sector will prove to be stronger and broader than anyone anticipated.
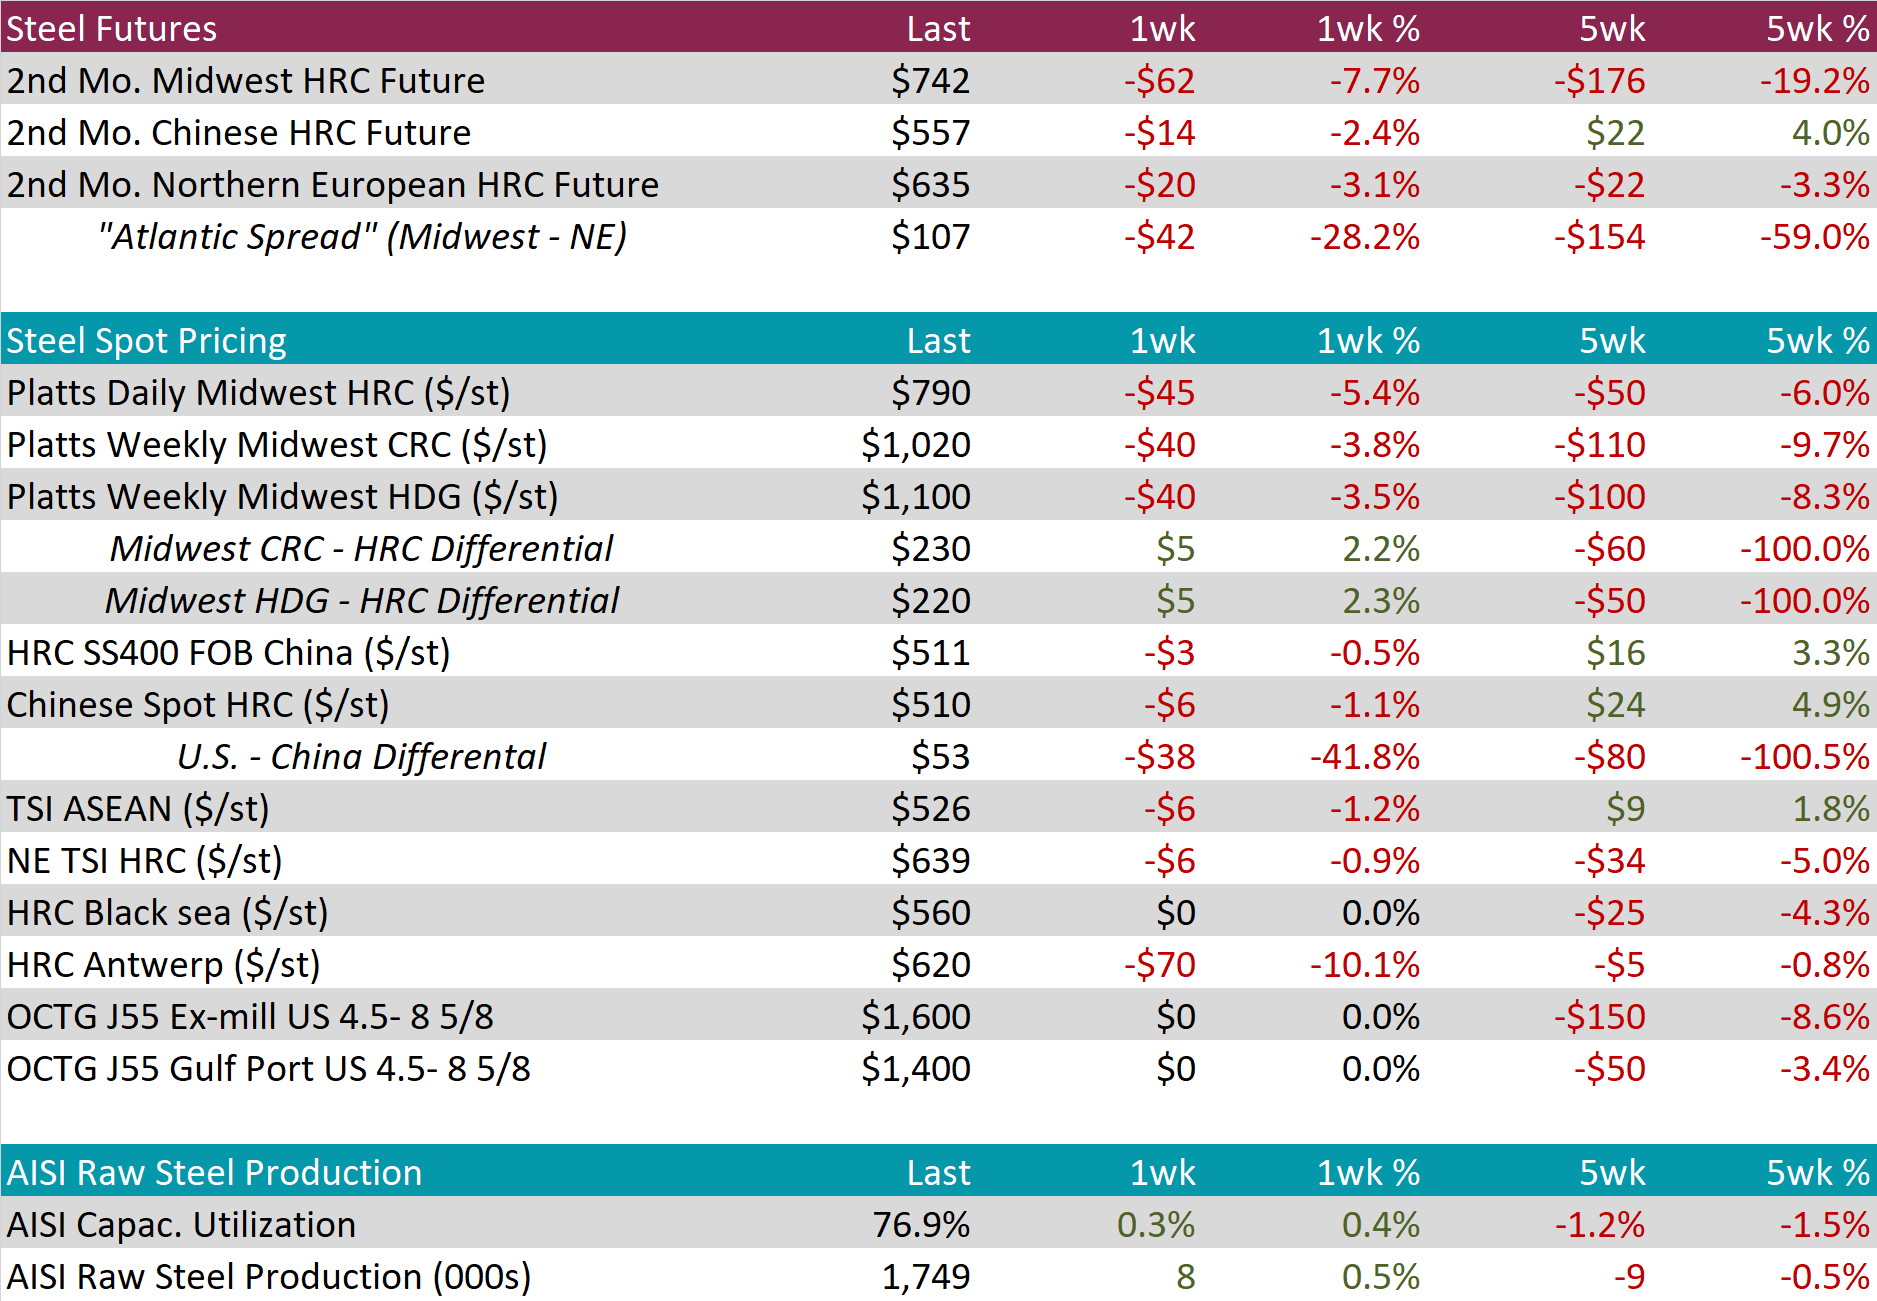
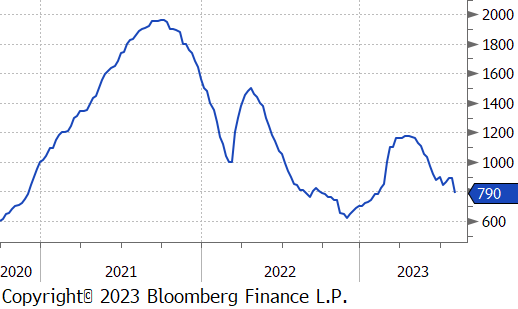
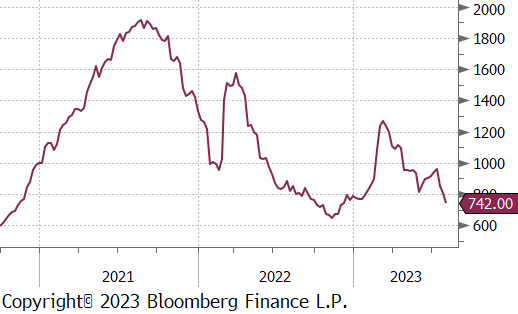
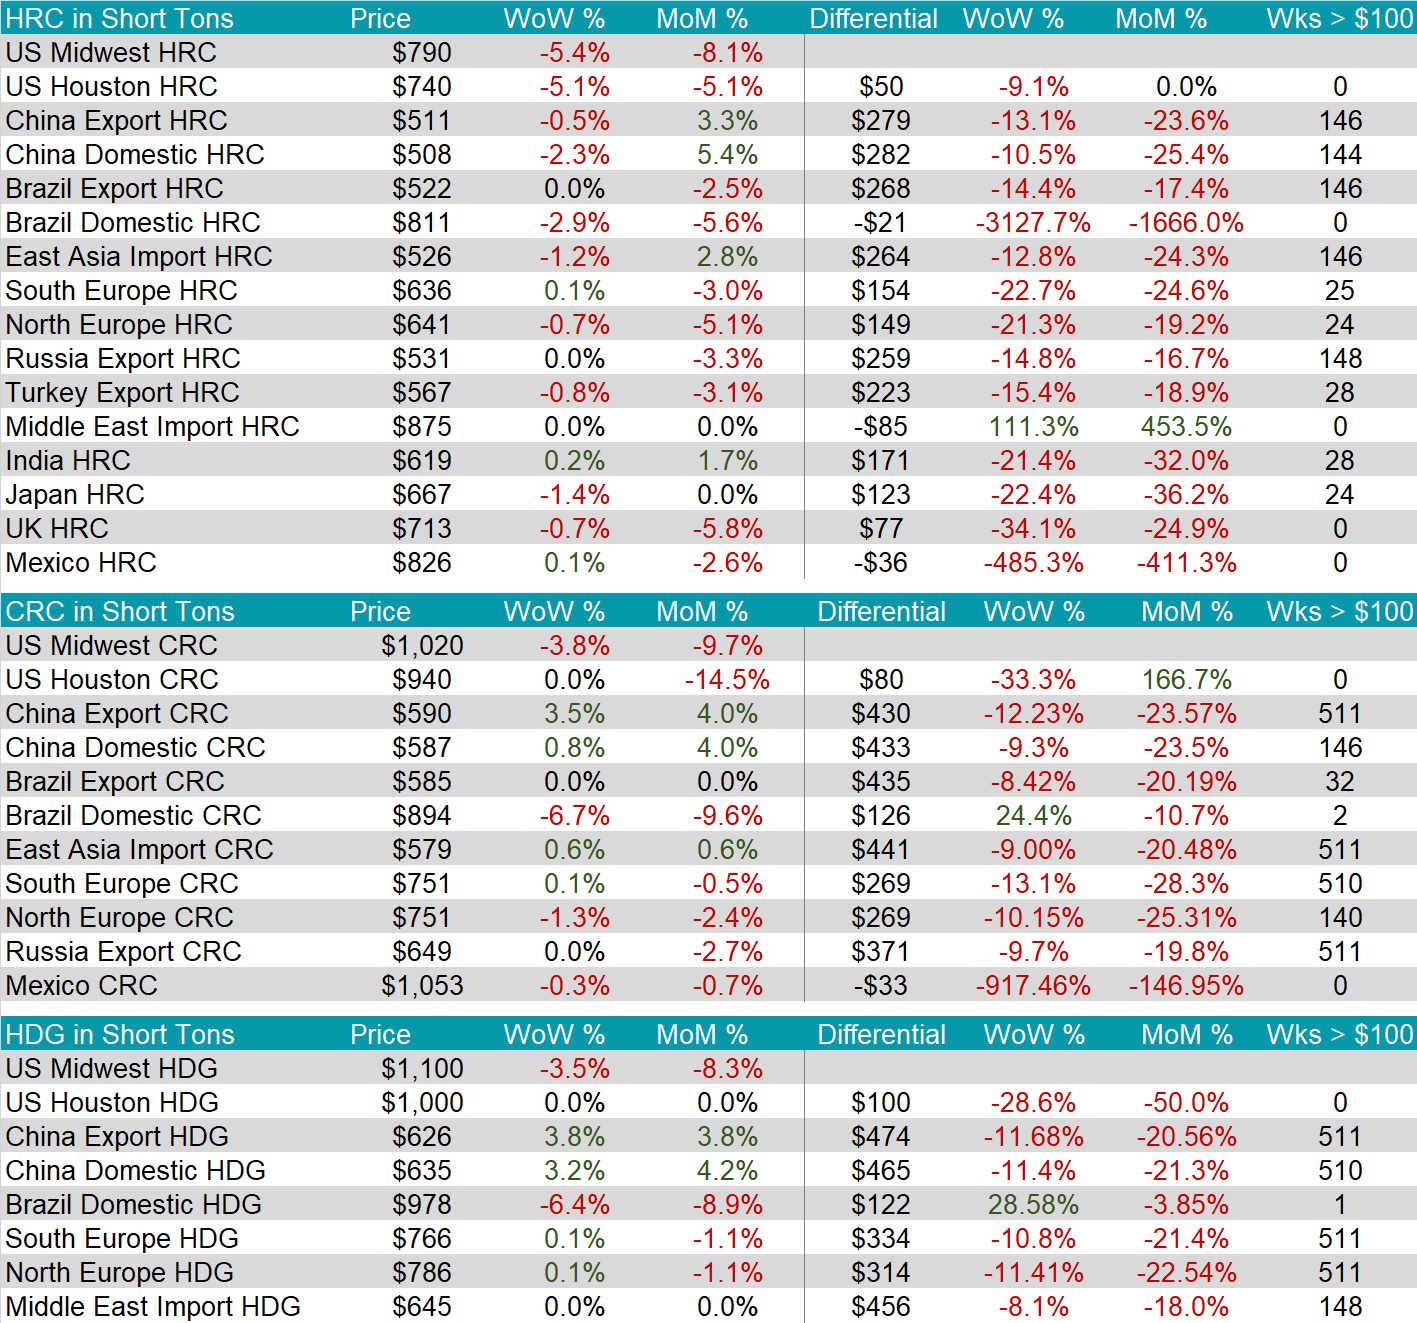
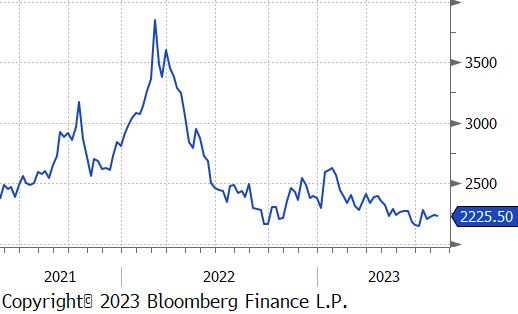
The HRC spot price and 2nd month future both fell further this week, down $45 or 5.4%, and $62 or 7.7%, respectively. This is the first time the spot price is below $800 since the beginning of February.
Tandem products fell further this week, as well, both down $40, resulting in a $5 expansion of the HDG-HRC differential. We anticipate further pressure on this spread.
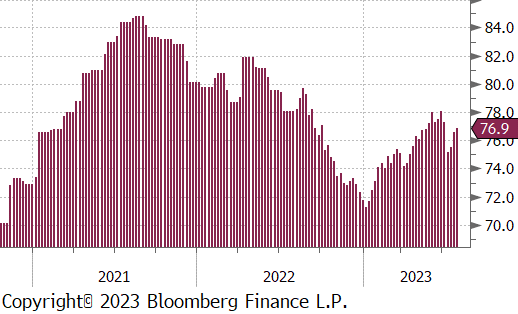
Mill production was slightly higher, for the 4th week in a row. Capacity utilization increased 0.3%, up to 76.9%. Given the low level of imports, we do not view the recent trend as a significant risk for mass over supply
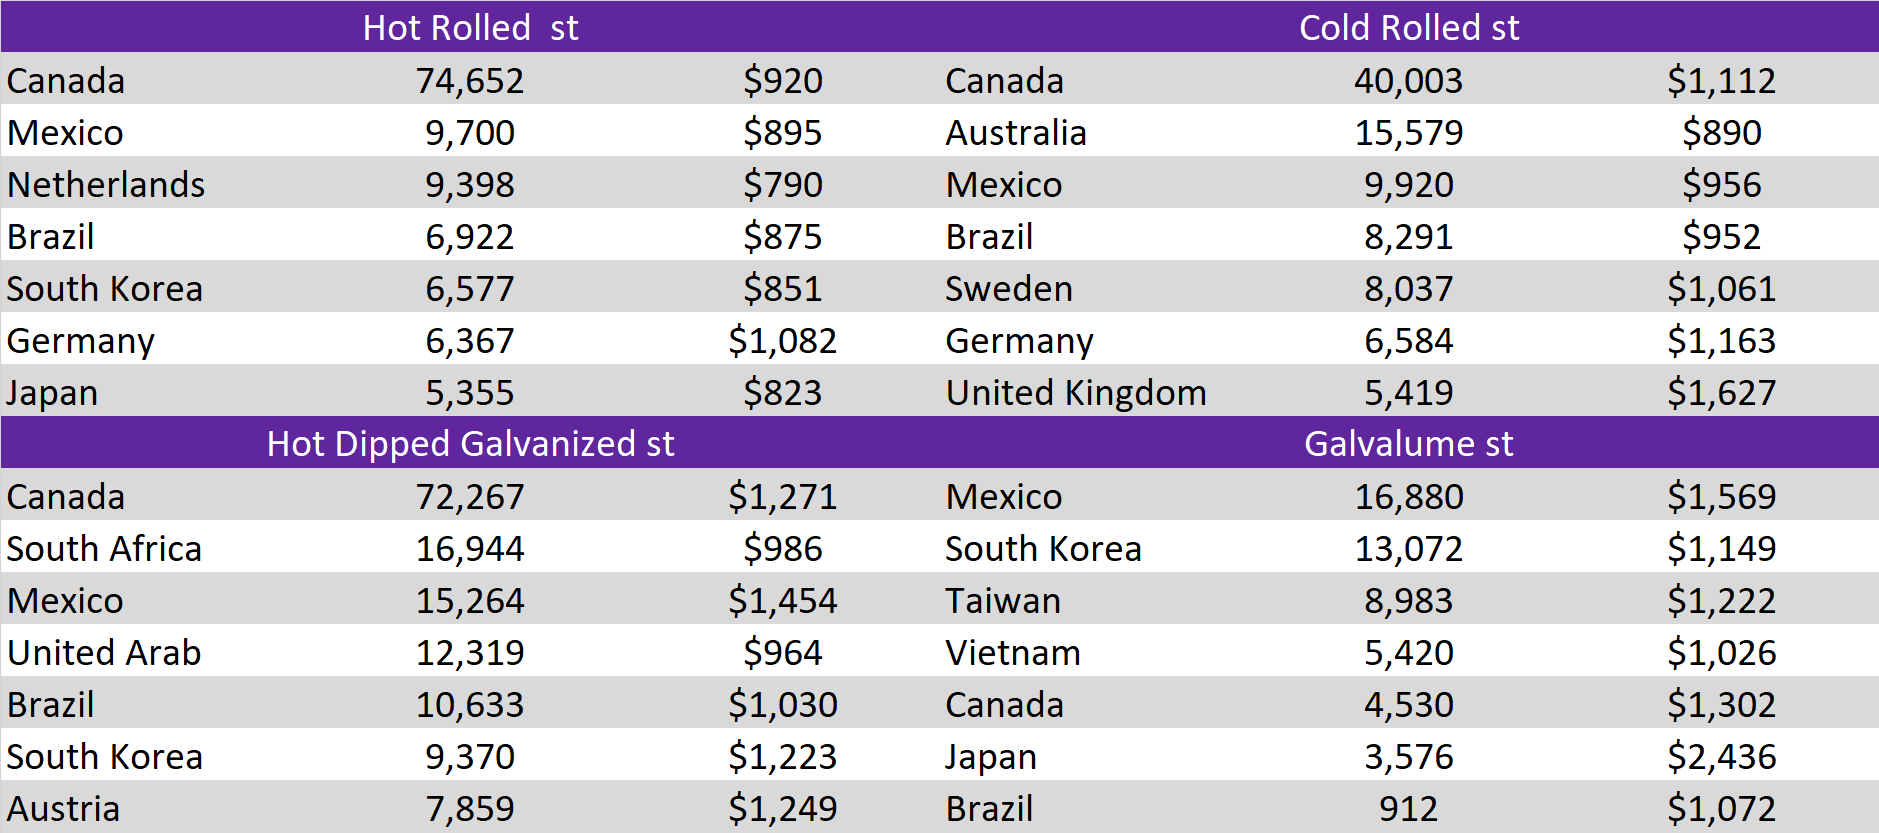
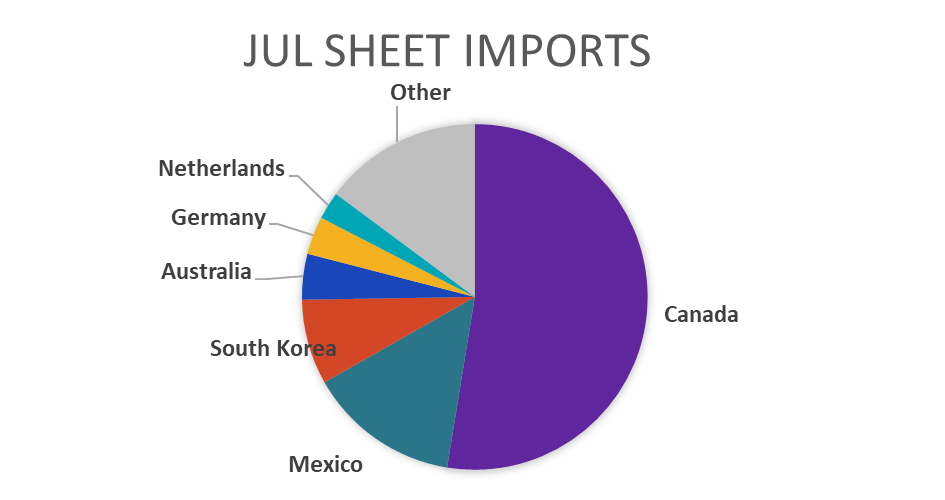
July projection – Sheet 663k (down 160k MoM); Tube 421k (down 44k MoM)
June census data – Sheet 822k (down 35k MoM); Tube 465k (up 13k MoM)
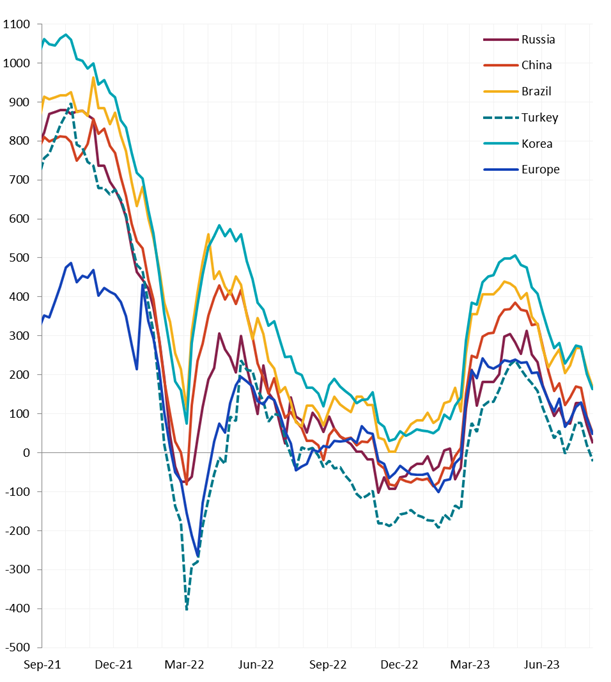
Global differentials fell further this week, as the U.S. domestic price leads global pricing lower. The Turkish price differential is the first to turn negative.
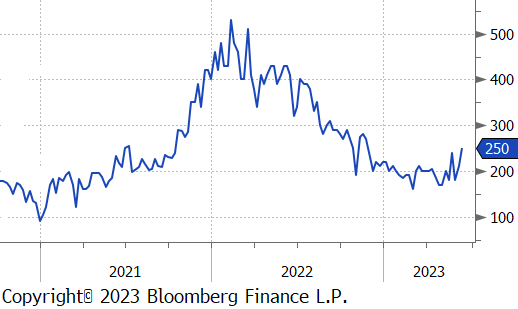
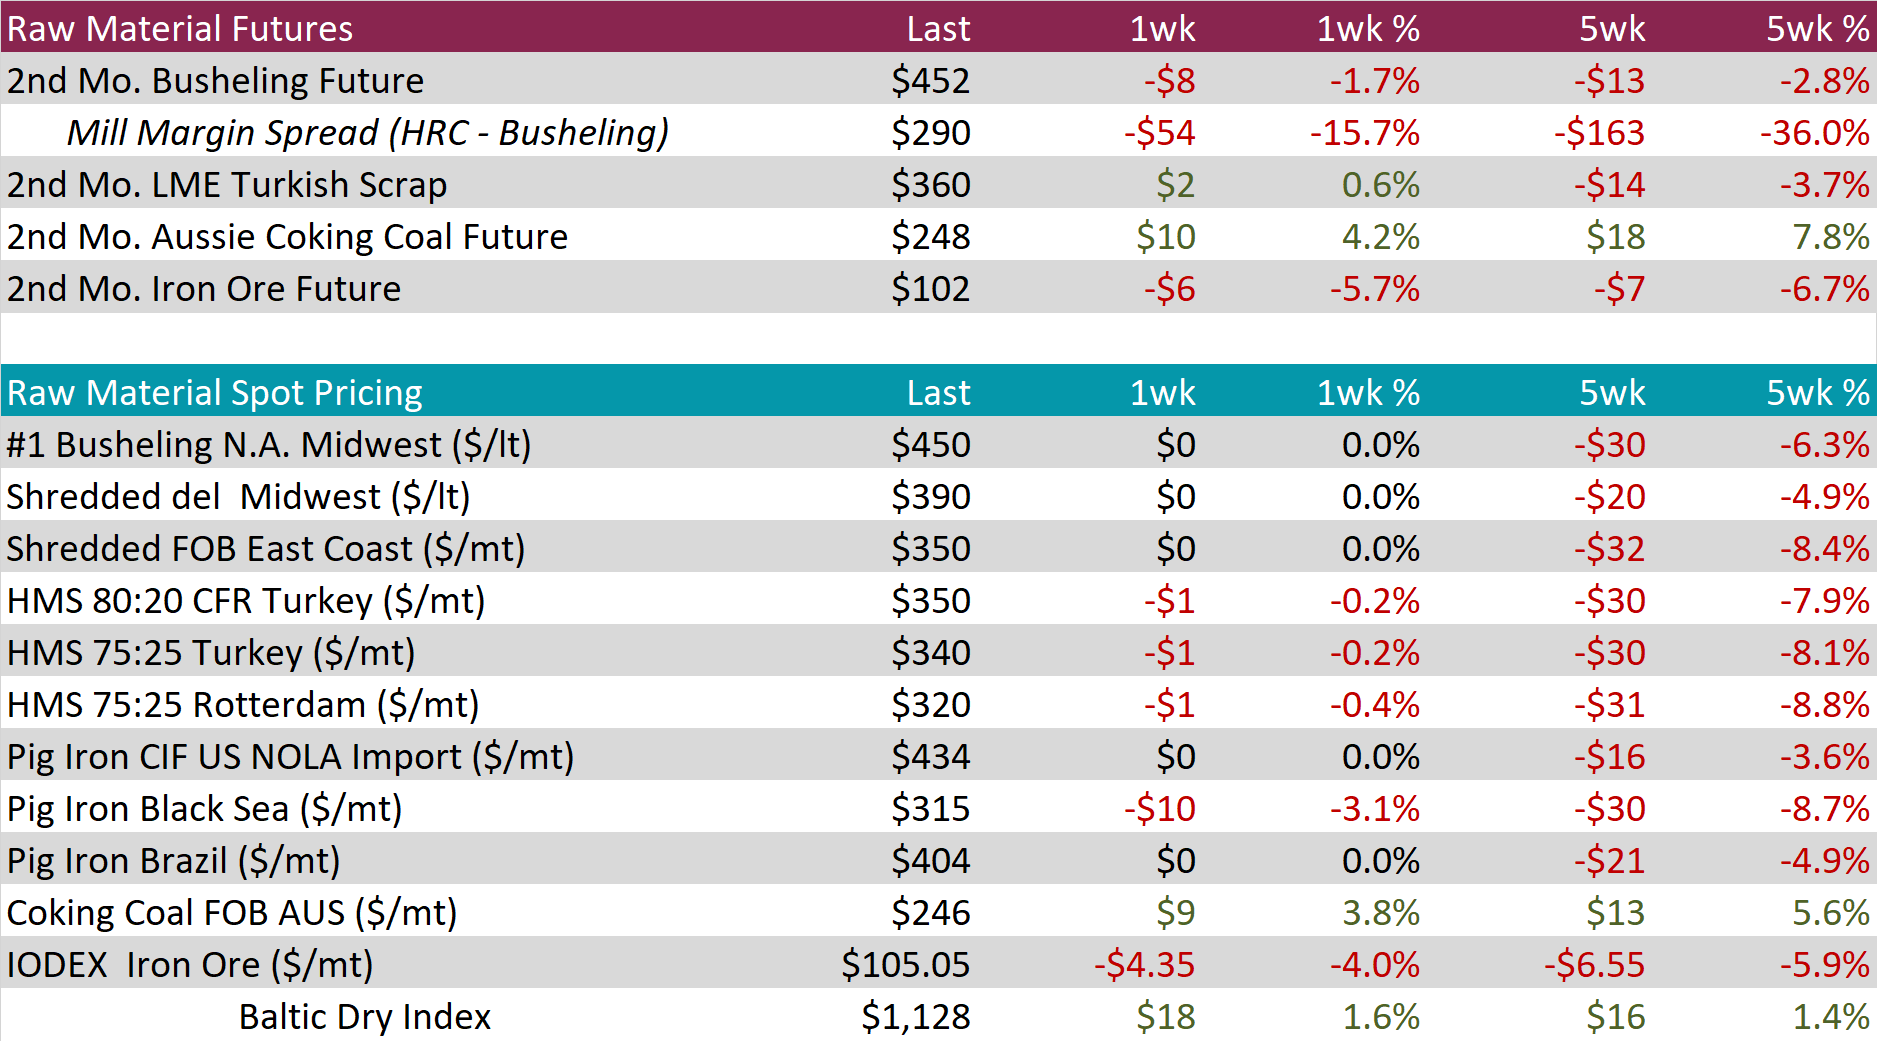
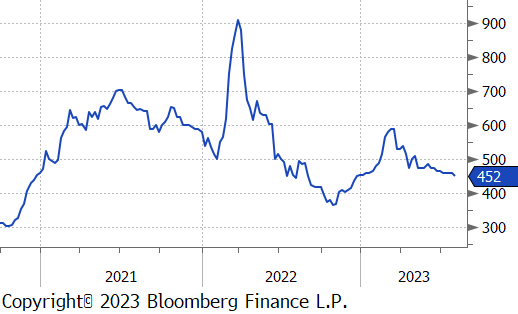
This was another somewhat subdued week in scrap markets, as we await next week’s monthly domestic settlements. The 2nd month busheling future was down $8, or 1.7% to $452, it’s lowest level since mid-December 2022. Over the last couple of months, prices have been on a slow grind lower, however, sentiment is starting to turn around and a bottom appears to be forming. One risk to the upside is the looming auto strike, which would result in a temporary timing mismatch between supply and demand.
The 2nd month iron ore future lost $6, this week. This is the third straight week of losses for iron ore.
Dry Bulk / Freight
The Baltic dry index was only up slightly compared to recent weekly volatility, increasing $18 or 1.6%. The index continues to trade within a remarkably tight range since the end of May.
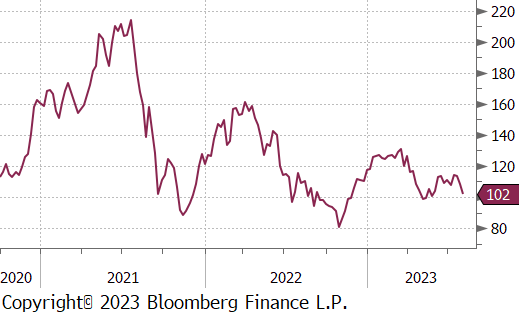
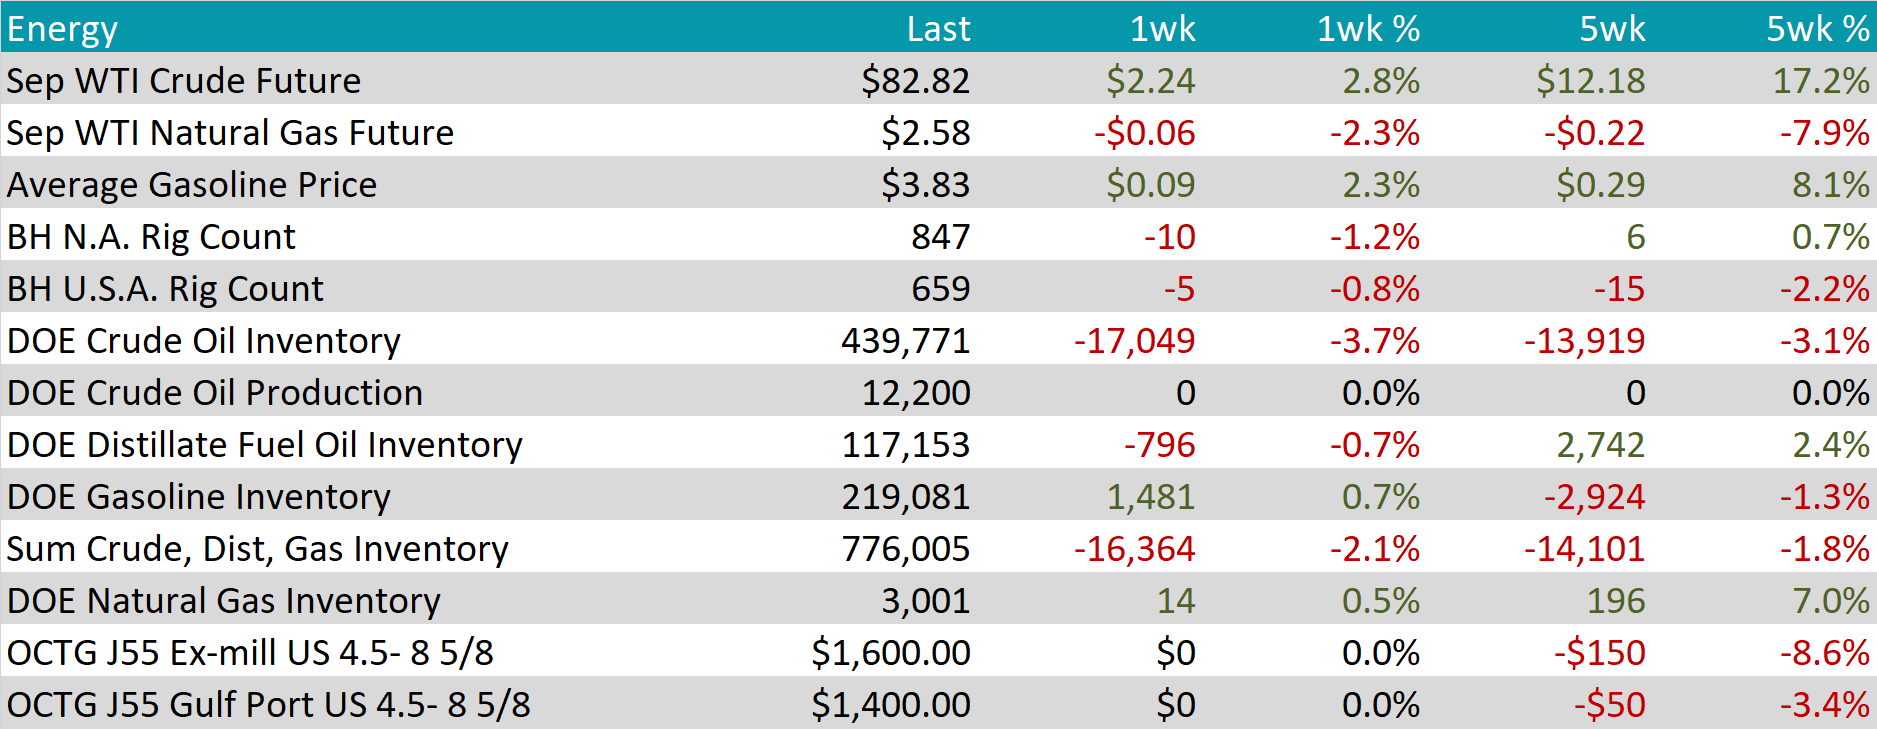
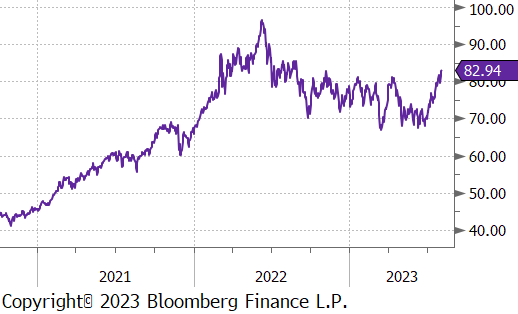
WTI crude oil future gained $2.24 or 2.8% to $82.82/bbl.
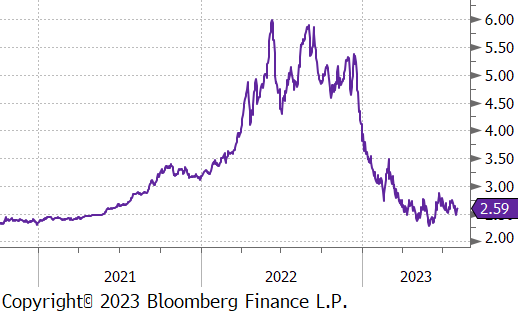
WTI natural gas future lost $0.06 or 2.3% to $2.58/bbl.
The aggregate inventory level was down 2.1% and is now at its lowest level since December 2022.
The Baker Hughes North American rig count was down 10 rigs, and the U.S. count was down 5 rigs.
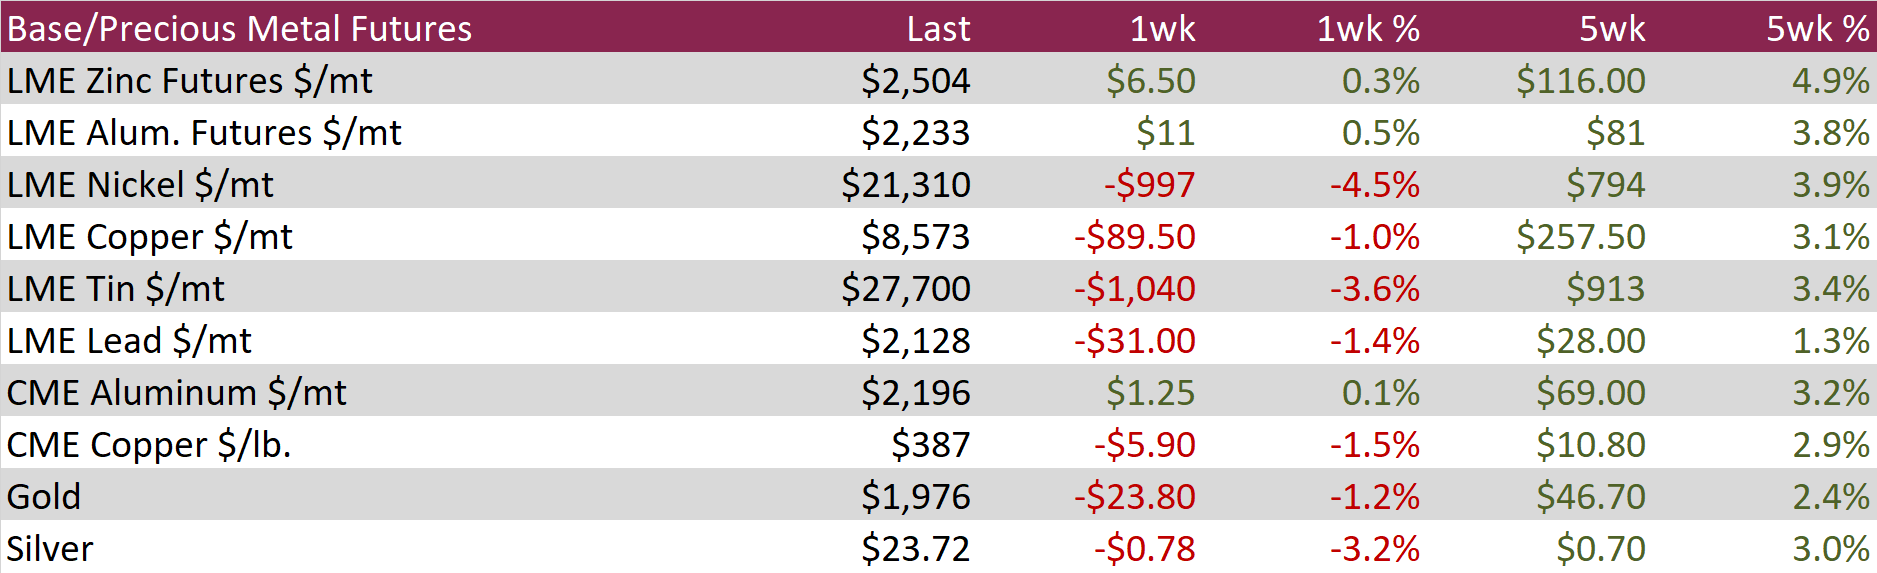
Aluminum futures remained relatively stable throughout the week, maintaining their position after a 1% rally the previous week and a 3.8% surge over the last five weeks. The week’s focus was on pivotal US payrolls data anticipated towards the week’s end, while China’s central bank indicated an intention to increase its monetary support for the economy. Notably, the aluminum curve is gradually shifting into a steeper contango, influenced by elevated interest rates and indications of a well-balanced physical market.
Copper futures relinquished a portion of the robust gains from the prior week, contracting by 1%. This decline was fueled by concerns about China’s economy, contributing to the overall volatility in base metals. Additionally, the US July ISM Services index fell short of expectations. Interestingly, money managers amplified their bullish COMEX Copper positions to the most bullish stance in the past six weeks.
Silver futures faced intensified selling pressure for the second consecutive week, experiencing a 3.2% decline after a 1.4% drop in the previous week. This downward trend persisted despite a weakened dollar, which typically lends support to precious metals. Remarkably, money managers reduced their bullish positions to a three-week low, while short-only positions surged to their highest level in eleven weeks.
As referenced on the first page, the labor market showed promising signs of cooling to a more sustainable level. Initial jobless claims were up slightly but remained well below their recent peak, while continuing claims remained subdued. JOLTS job openings also printed lower at 9.58 million openings, reaching their lowest level since April 2021. Most importantly, the unemployment rate remains incredibly low despite the headwinds from elevated interest rates. While we anticipate that this will increase, the overall stability displayed in the labor market is among the strongest signals that a recession could be avoided.
Auto sales increased in July, reaching an annualized rate of 15.74 million. Although slightly below expectations, the increasing cost of financing is becoming more of a burden. However, the backlog of demand resulting from supply chain problems should offset some of these headwinds.
Total construction spending continued its impressive growth trend, as referenced in last month’s report, with another 0.5% increase in June. Private residential spending improved again this month, outweighing the monthly decline in nonresidential spending. While the year-over-year residential figures have been negative for seven straight months, the July print is the best since February.

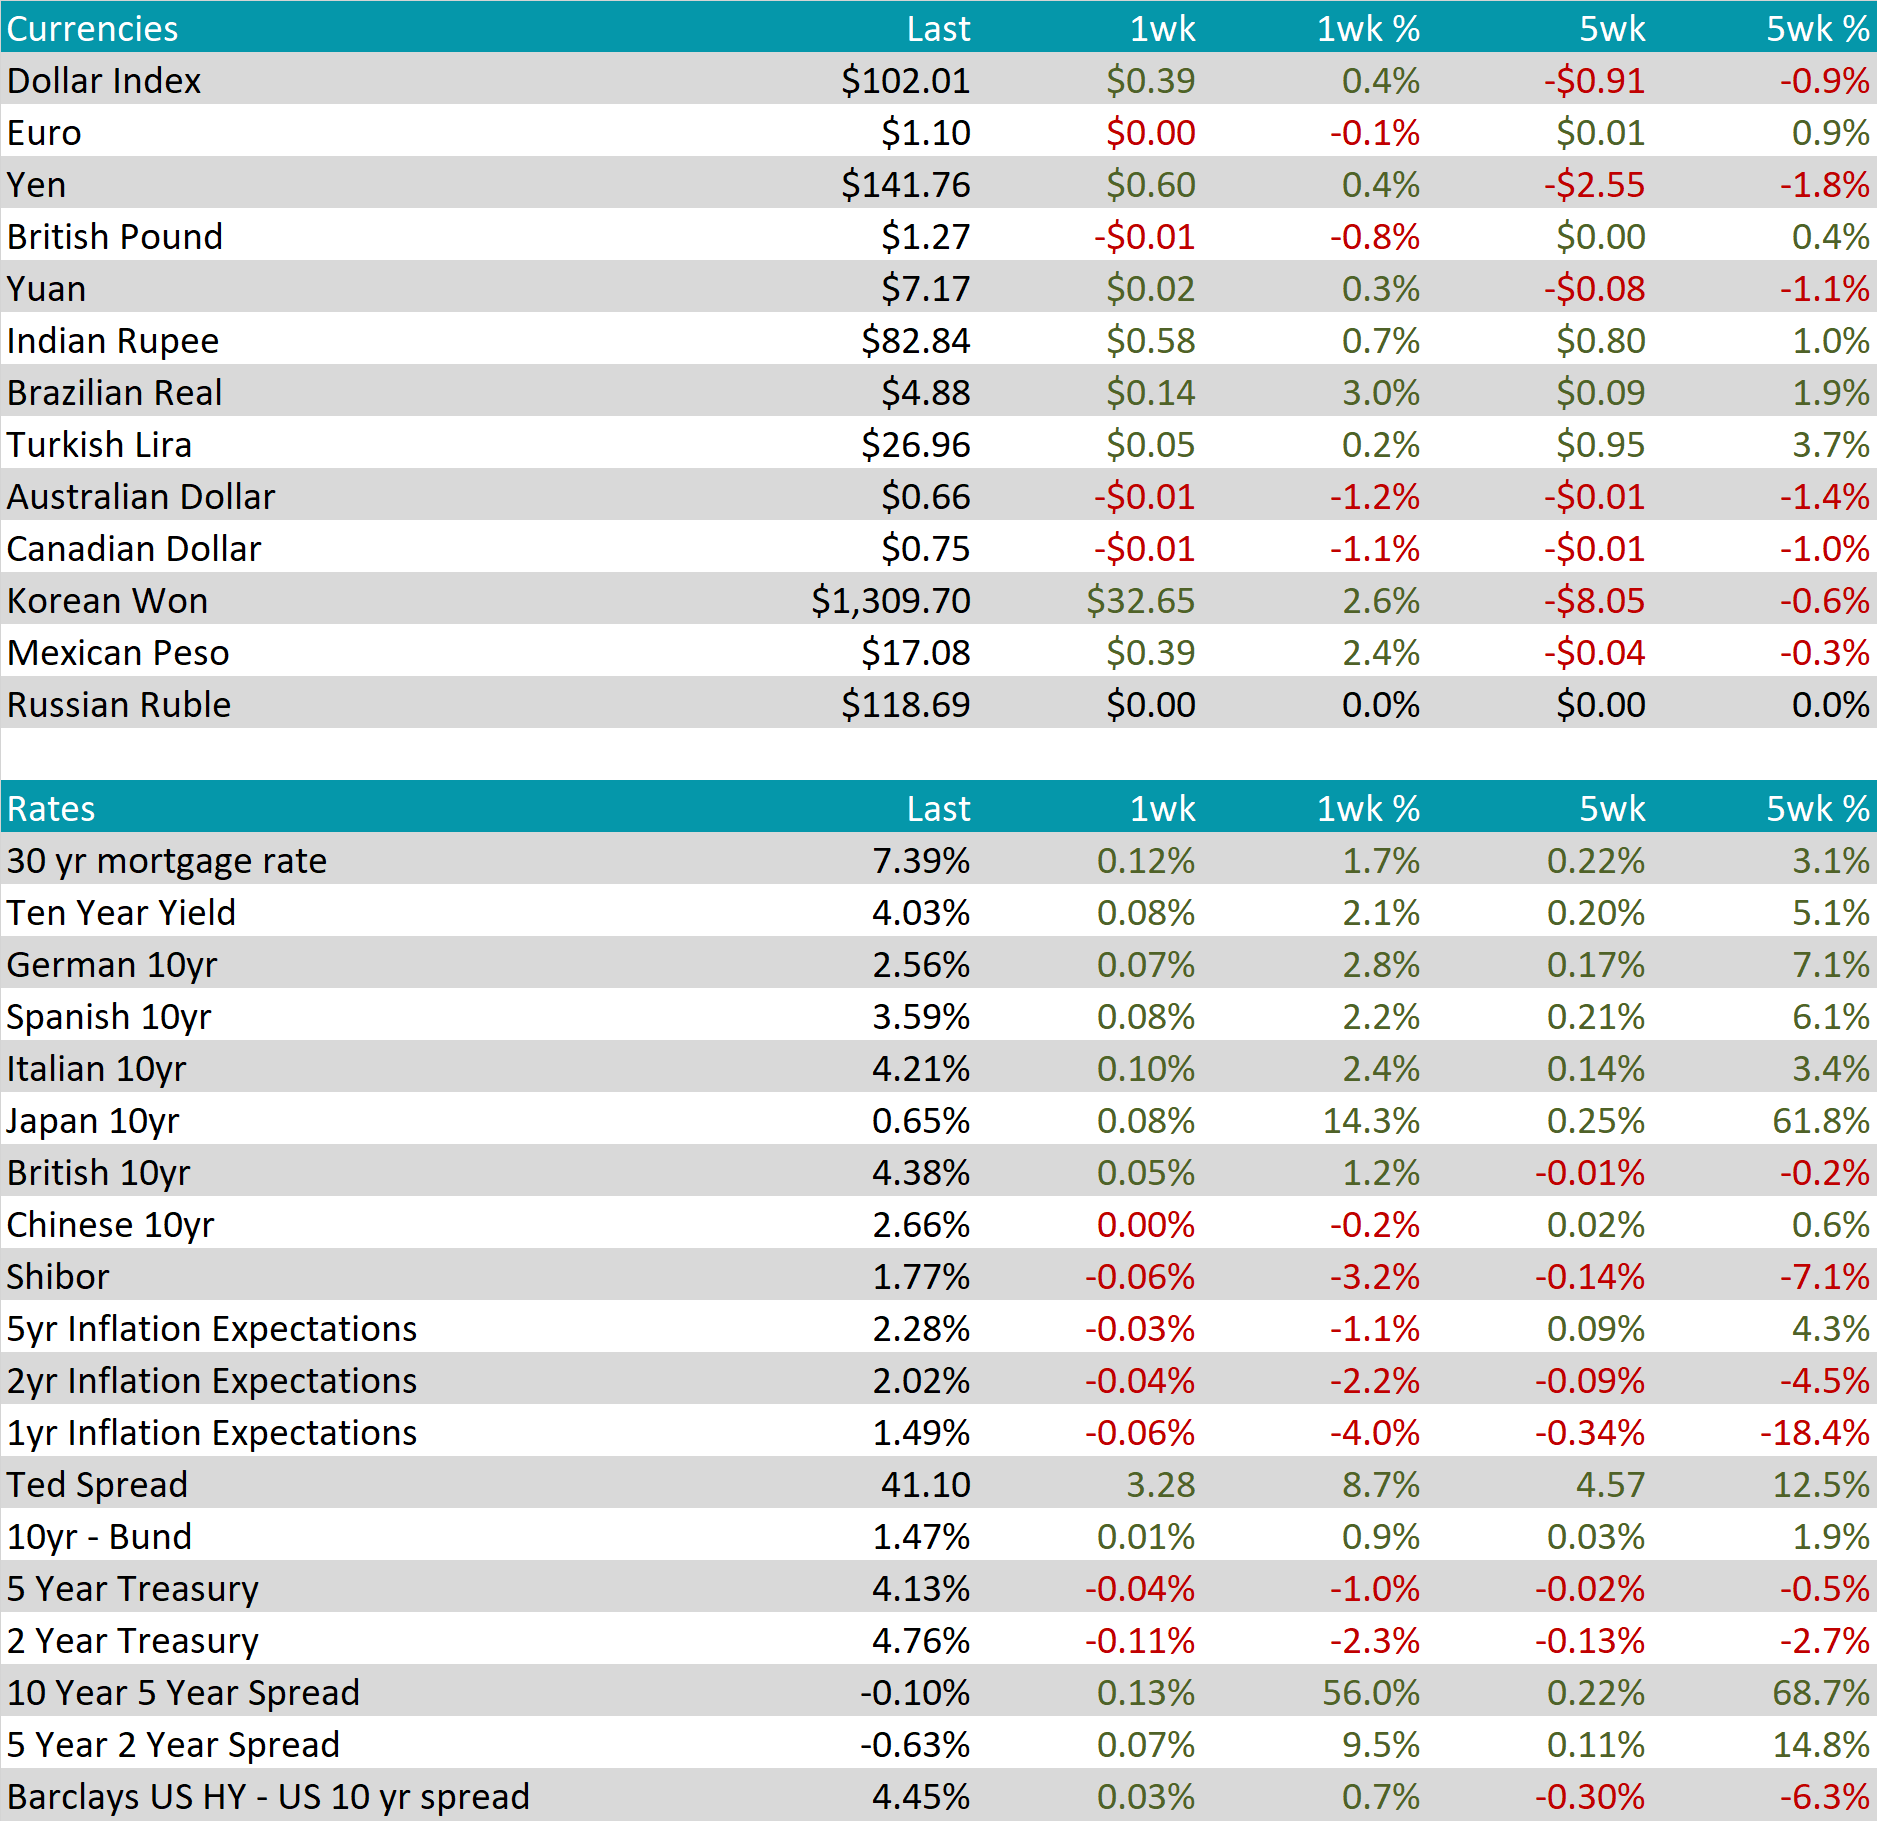
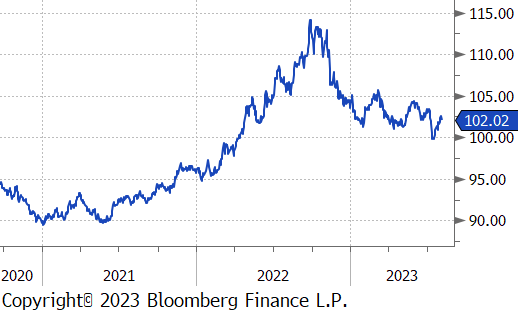
The US dollar gained $0.39 or 0.4%, to $102.01 as investors sought safety after weak data from China and European soured global sentiment. The Aussie dollar was the biggest loser among major currencies, down 1.2% on the week, the move largely represents the potential impact from a weak Chinese economy.
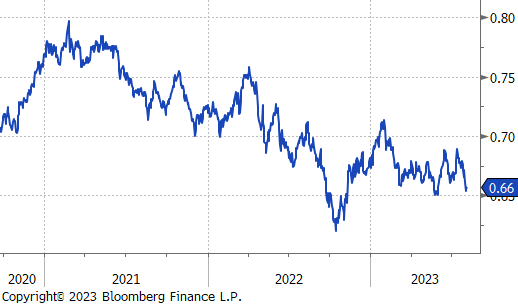
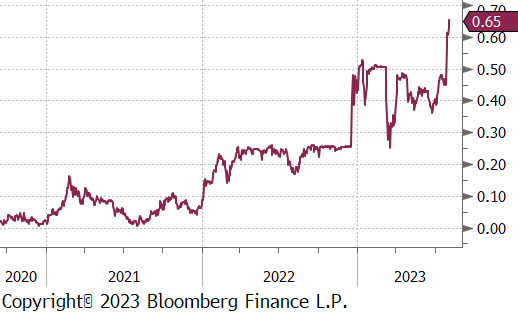
The US 10-year Treasury yield has exhibited considerable volatility in recent weeks, ranging between 3.75% and nearly 4.2% since early June. This week it was up 8 bps to 4.03%. Looking to next week, market participants eagerly anticipated the release of the US CPI report to gauge ongoing economic price pressures. Furthermore, the Treasury Department’s plan to sell $103 billion in coupon-bearing debt added to the market’s focus on yields. More notably, this week the Japanese 10-year government bond yield surged past 0.6%, ending the week at 0.65%, marking its highest level in nine years as the Bank of Japan allowed greater movement in interest rates. The central bank’s decision to let the 10-year yield exceed its previous 0.5% upper limit indicated a potential shift in policy normalization. This somewhat unexpected move comes amidst rising global interest rates and inflationary pressures that have been challenging Japan’s bond yields and currency.