Flack Capital Markets | Ferrous Financial Insider
December 8, 2023 – Issue #409
December 8, 2023 – Issue #409
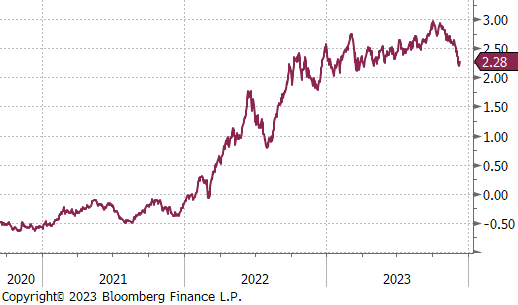
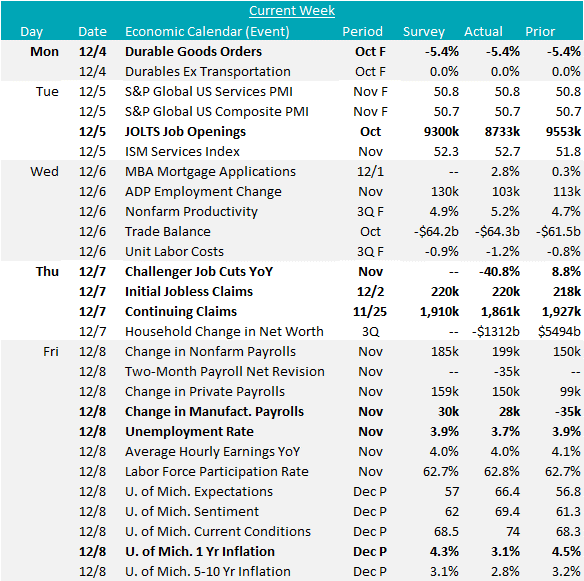
The most important question for the economy going into next year is whether we will have a soft landing. Where inflation cools back to the FED target of 2% without major damage to growth and the labor market. The latest tranche of labor market data releases provided further evidence that a soft-landing is in view. Early in the week, the Jolts Job Openings, dipped to 8.7M for October, representing the lowest level since March 2021. This was well below expectations of 9.3M, however, taking a step back, job openings remain well above levels seen prior to the pandemic and continue to indicate that the labor market is tight. The red dotted line is the 5-year average leading up to March 2020. If this can continue to quickly retrace and stabilize, the risk of a wage/price spiral is minimized.
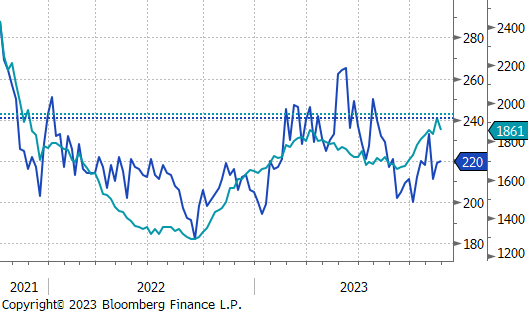
Later in the week, we saw initial jobless claims registered a modest uptick of 2,000, reaching 220k, while continuing claims rolled over, slipping to 1,861k from 1,927k. Both datapoints remain under their corresponding pre-pandemic 5yr averages after initial claims spent much of the spring and summer around those levels.
This led to the most anticipated data release of the week. On Friday, the Nonfarm payrolls increased by 150k for November, up from 99k in the month prior and slightly below expectations. Specifically for our sector, the change in manufacturing payrolls showed an increase to 28k, up from -35k. On top of that, the unemployment rate for November saw a decline to 3.7% from the prior month’s 3.9% and defied expectations of remaining static.
The summation of these findings underscore the positive trend that a soft landing requires – a discernible cooling from the tight conditions observed during the pandemic and over its recovery, while still maintaining strength from a historical perspective. If this cooling can continue while price pressure recedes, rate cuts and all the industrial demand that would come with them will come sooner than the market thinks.

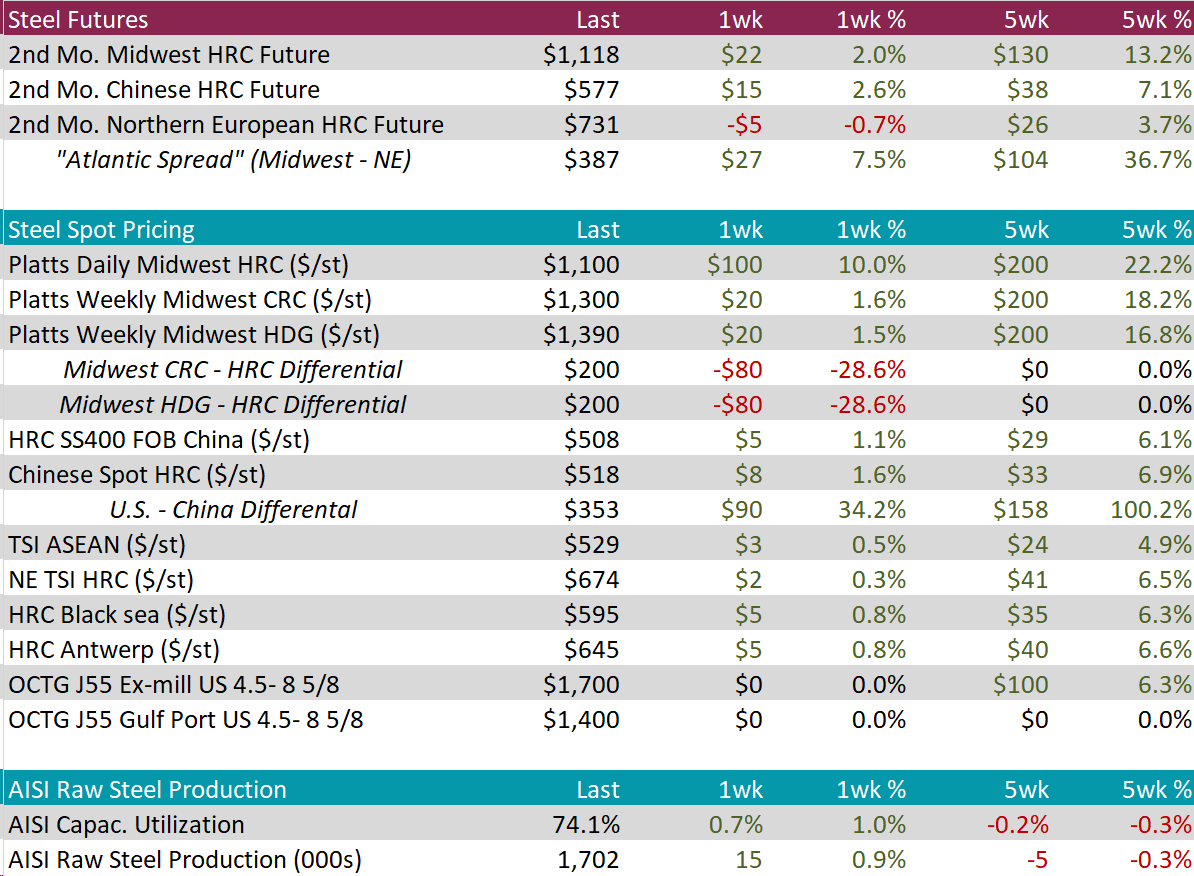
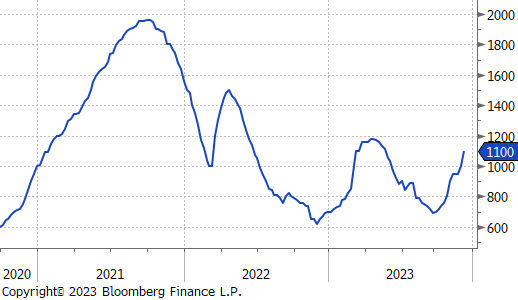
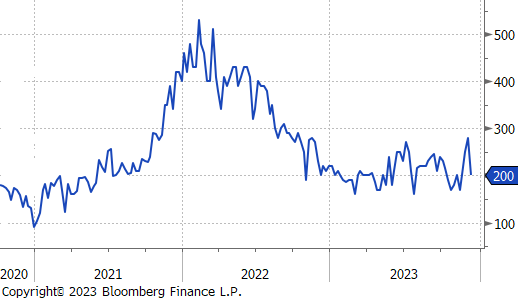
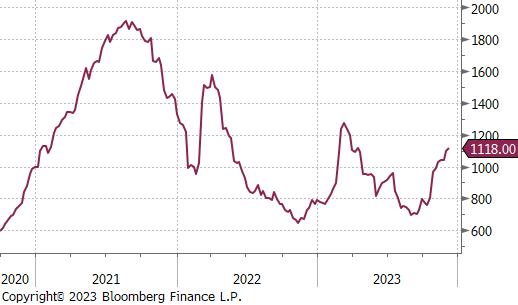
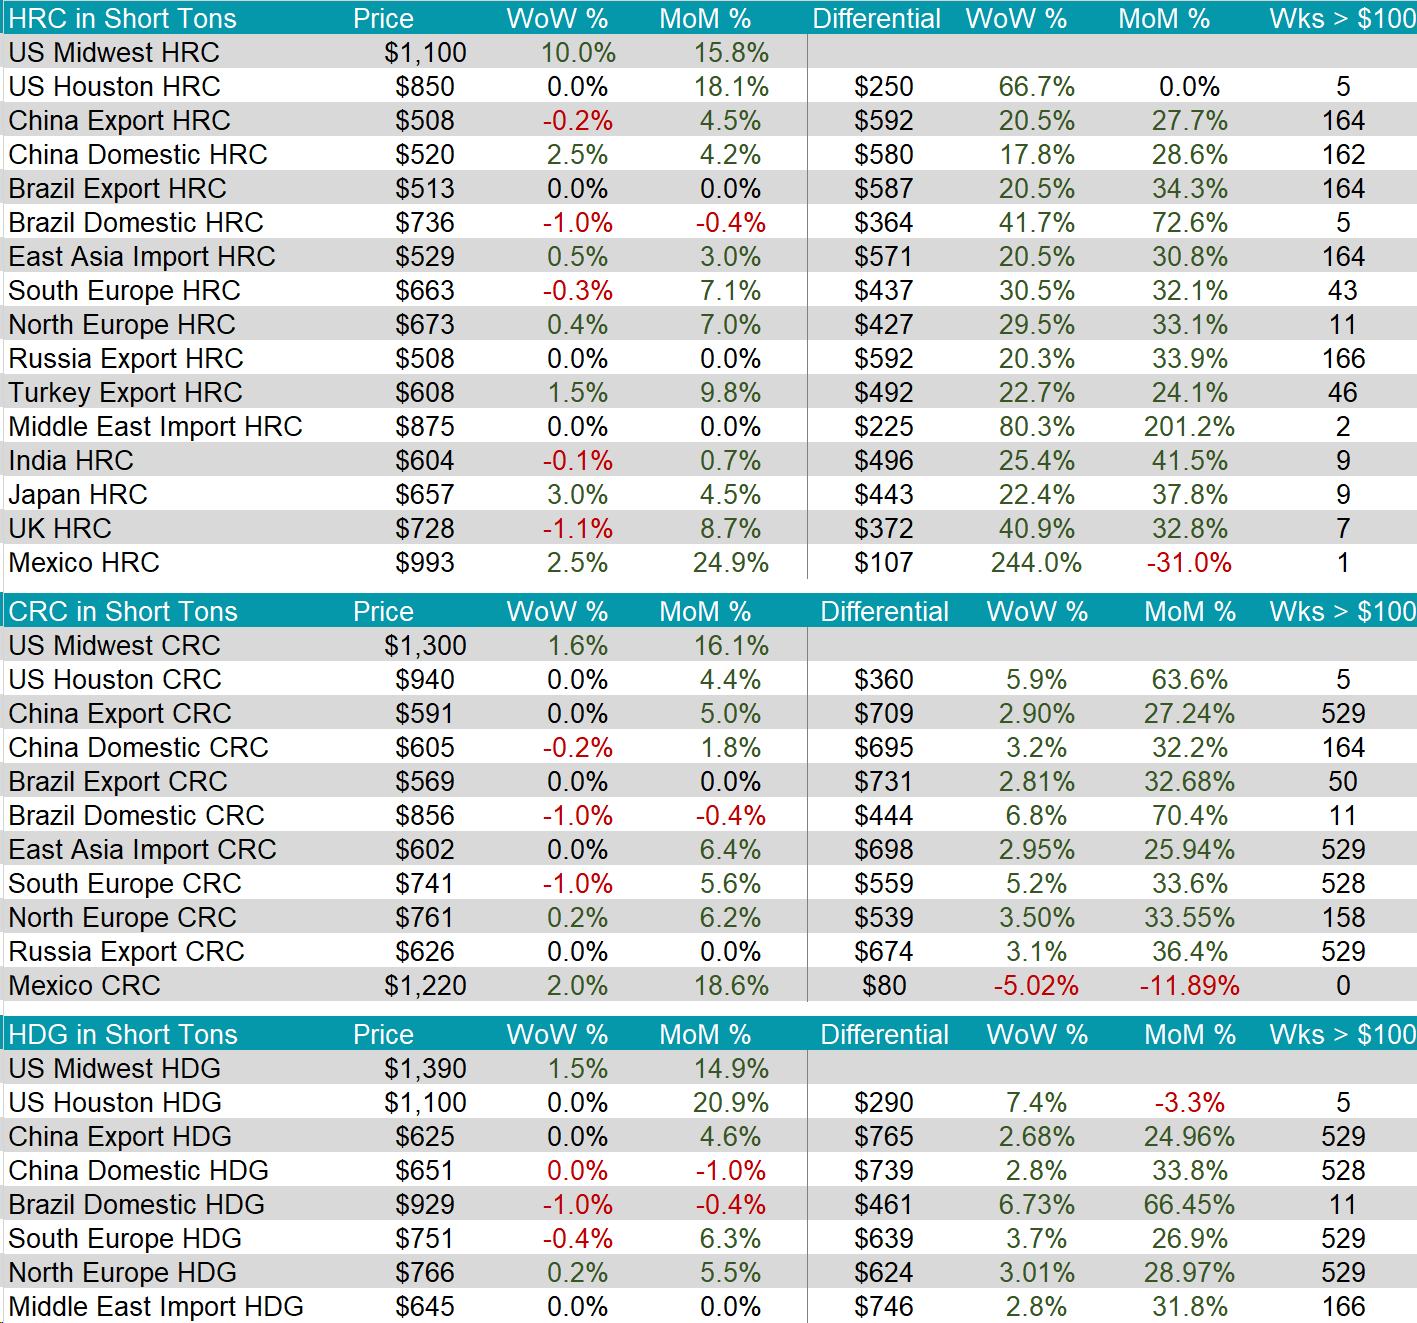
The HRC spot price surged to $1,100, increasing by $100, or 10.0%. Since hitting it’s most recent low of $690 in September, the price has gained $410 over the eleven-week rally. At the same time, the 2nd month future increased by $22, or 2.0%, to $1,118, which has gained $421 over fourteen-weeks when it hit its most recent price low of $697 in September.
Tandem products both rose by $20, bringing the CRC up to $1,300 and the HDG up to $1,390, resulting in both the CRC – HRC and HDG – CRC differentials falling by $80 to $200.
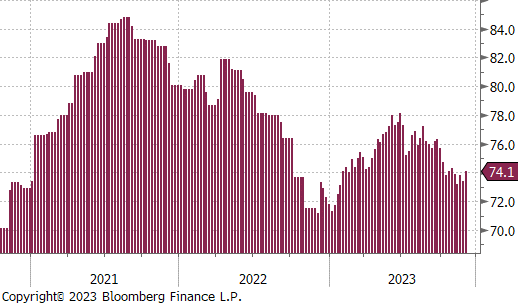
Mill production continues to remain at relatively low levels, despite capacity utilization ticking up by 0.7% to 74.1%, bringing raw steel production up to 1.702m net tons.
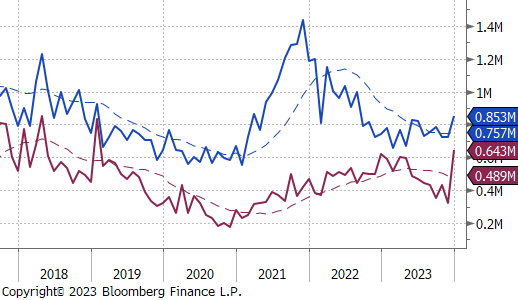
December Projection – Sheet 853k (up 130k MoM); Tube 643k (up 318k MoM)
November Projection – Sheet 723k (up 0k MoM); Tube 325k (down 104k MoM)
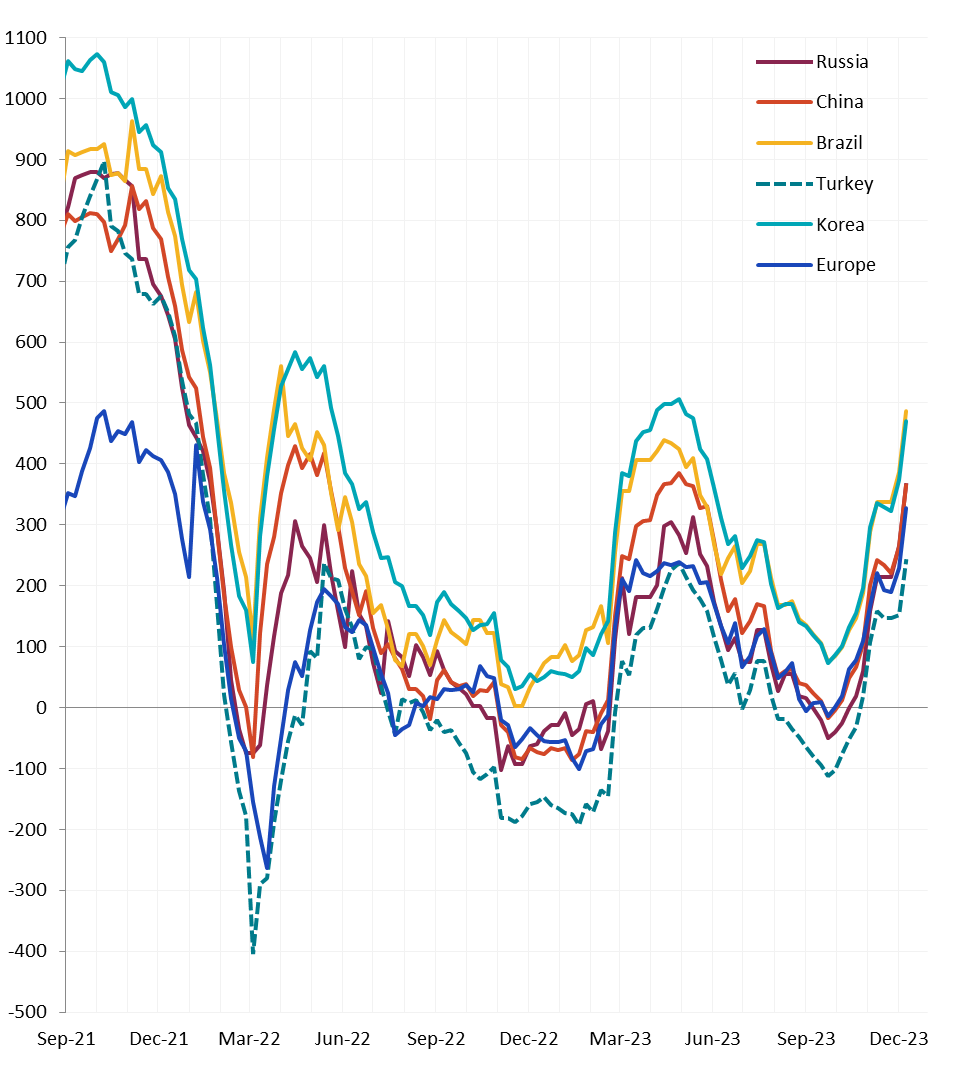
All watched global differentials jumped up, with China’s HRC increasing by 2.5% and Turkey’s HRC increasing by 1.5%, leading the way. Other notable countries were Japan, seeing a price increase of 3.0%, and Mexico, with an increase of 2.5%.
Scrap
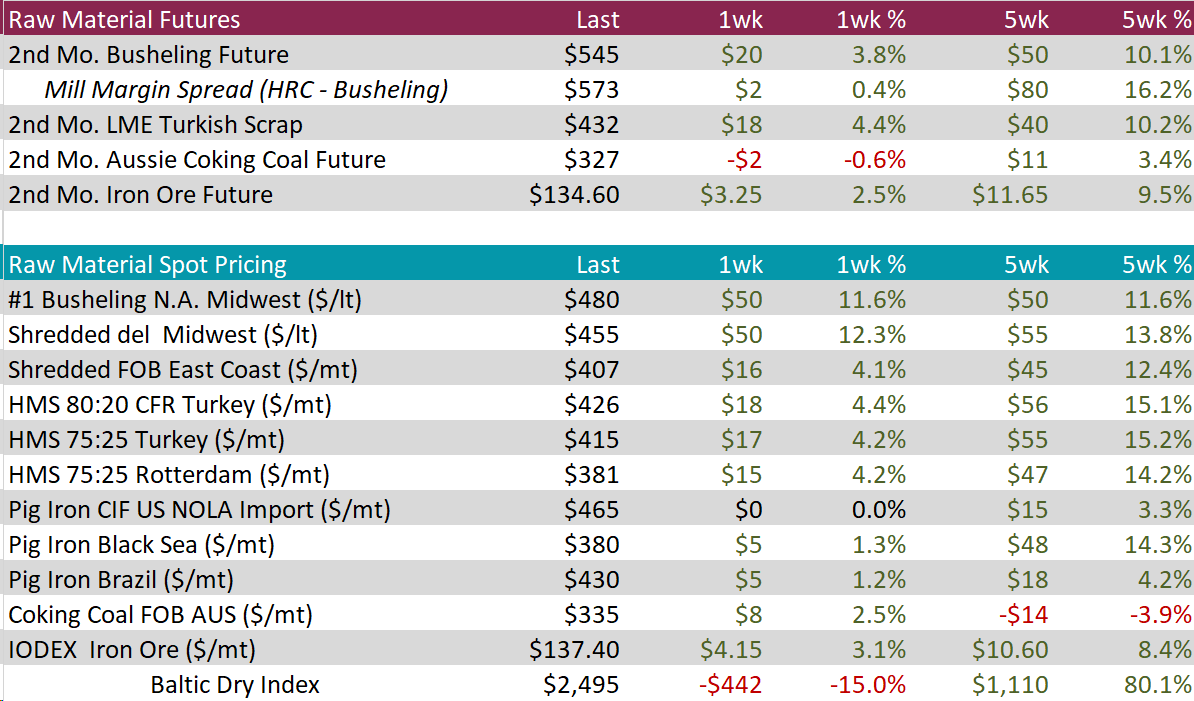
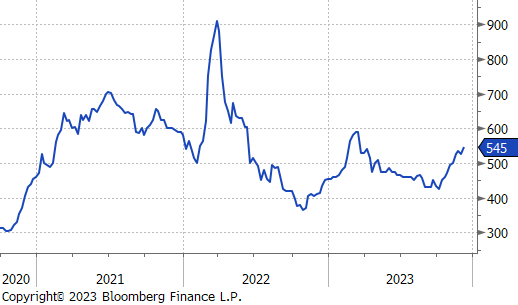
The busheling spot price shot up by $50, or 11.6%, to $480, returning to the price level seen in June. At the same time, the 2nd month busheling future rose by $20, or 3.8%, to $545, rebounding from last weeks price decrease of $10 to $525, nearing the price highs seen in March.
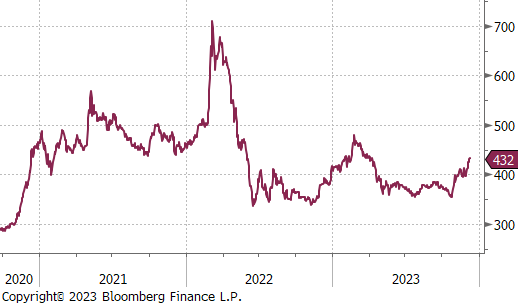
The 2nd month LME Turkish scrap future jumped up by $18, or 4.4%, to $432. This is the highest price reached since March and bringing the total gained up to $76 since hitting its recent price low of $356 seven-weeks ago.
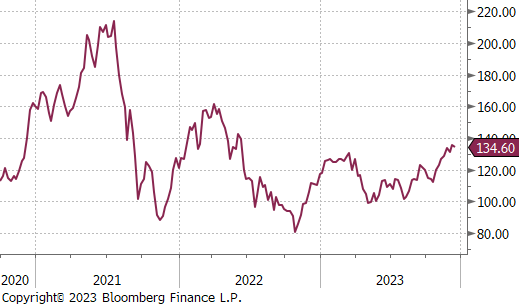
The 2nd month iron ore future increased by $3.25, or 2.5%, bringing the price up to $134.60, hitting a new price high for the year and a level not realized since June 2022. Furthermore, the price has gained $21.50 since reaching its most recent price low of $113.10 seven-weeks ago.
Dry Bulk / Freight
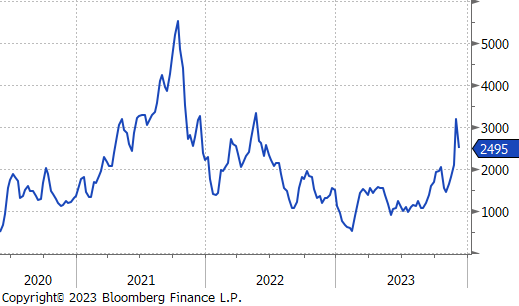
The Baltic Dry Index dropped by 442 points, or -15.0%, to $2,495. This movement comes right after breaking into the $3,000, which has not occurred since May 2022, reversing those gains.
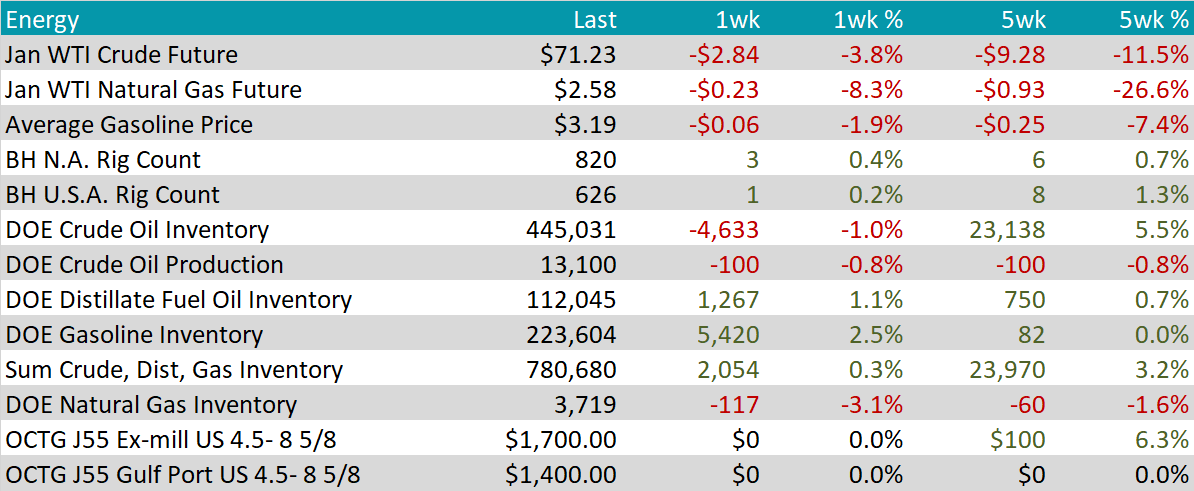
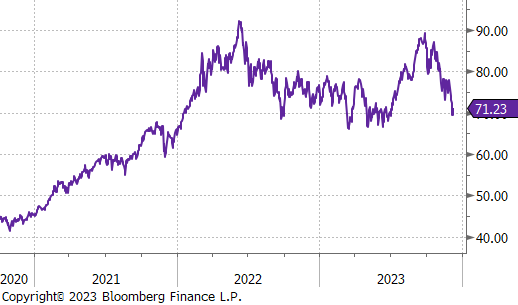
WTI crude oil future lost $2.84 or -3.8% to $71.23/bbl.
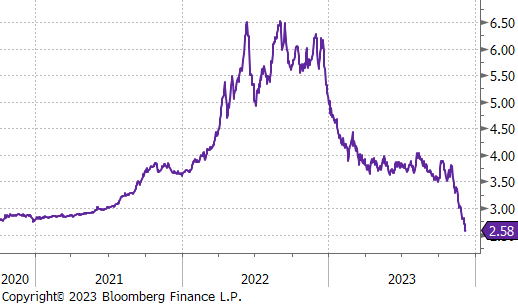
WTI natural gas future lost $0.23 or -8.3% to $2.58/bbl.
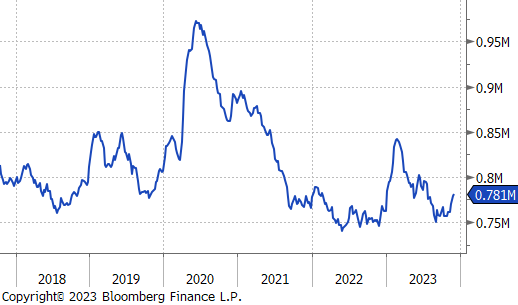
The aggregate inventory level continues to climb, this time rising by 0.3%, bringing the total up to 0.781M.
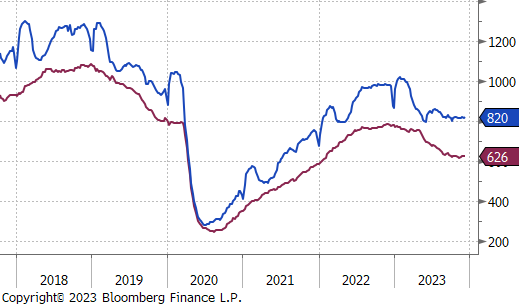
The Baker Hughes North American rig count gained 3, bringing the total count of rigs up to 820. The US rig count also had an increase, gaining 1 rig, bringing the total count to 626 rigs.
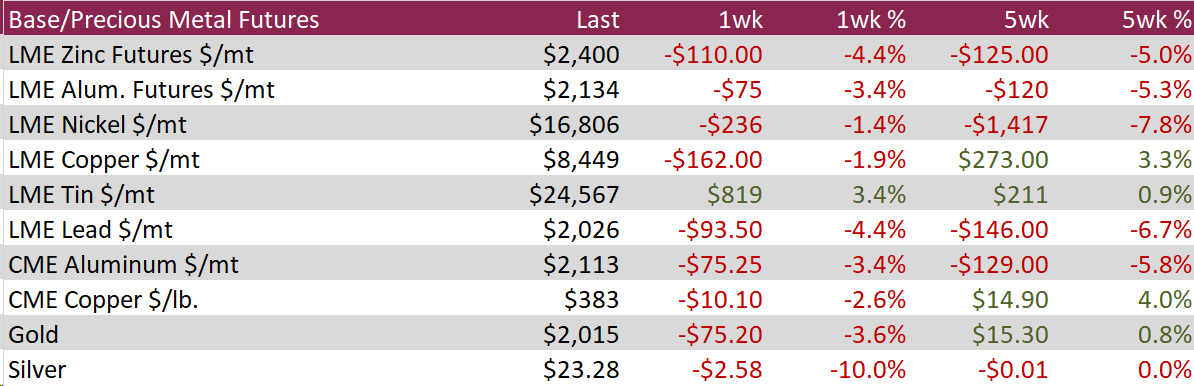
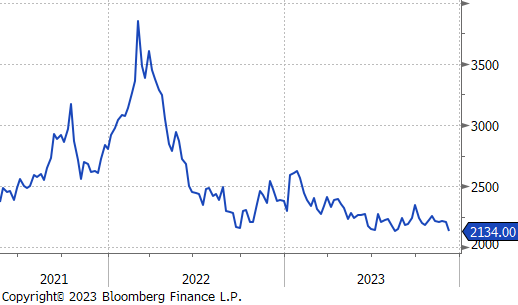
Aluminum fell by $75, or -3.4%, to $2,134, marking the lowest price since February 2021, due to diminishing demand that outpaced prior supply reductions. The downturn was fueled by a global economic slowdown, influenced by high interest rates and China’s property market crisis, negatively impacting aluminum-dependent industries. Norway’s leading aluminum company, Norsk Hydro, experienced a 57% drop in third-quarter sales, citing weaker global industrial and real estate markets, as well as reduced Chinese electric vehicle demand. Similarly, Alcoa faced substantial losses, exacerbated by fluctuating energy costs affecting industrial operations.
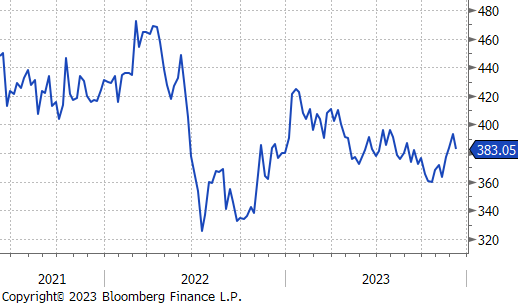
Copper fell by $10.10, or -2.6%, to $383, after hitting a recent price high of $393, driven by investor attention of manufacturing in China and the US. China saw copper imports jump 10.1% to 550.6k tonnes in November, the highest in nearly two years, indicating a tightening of inventories and some positive trends in consumption. Reflecting this demand surge, the Yangshan copper premium hit a one-year peak. This aligns with strong buying patterns, driven by various stimulus efforts and financial boosts from Beijing, aimed at bolstering China’s infrastructure. In another development, Panama intends to cease operations at First Quantum’s Cobre mine, a major global copper source, potentially impacting supply.
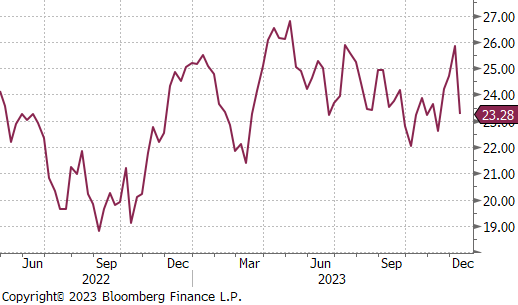
Silver dropped by $2.58, or -10.0%, to $23.28, after reaching a December high of $25.86. The decline was influenced by a strong US jobs report, suggesting the Fed may not reduce interest rates as soon as expected in 2024. Increased job growth and wages, along with a decrease in unemployment, have led to higher silver holding costs and concerns about sustained high interest rates affecting industrial demand. Despite these factors, a market deficit is anticipated, with The Silver Institute expecting lower silver production in Peru and Mexico, while Chile’s Chochilco predicts a 9.4% fall in 2024 demand due to decreased investments.
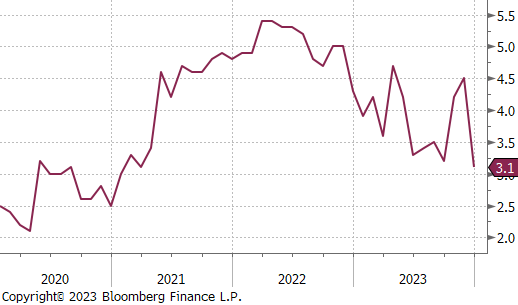
Other than the tranche of labor market data and volatility represented in durable goods new orders (auto strike related). The University of Michigan 1-year Inflation expectations showed a noteworthy decline, plummeting to 3.1% in the preliminary data for December, the lowest level since March 2021. The primary drivers behind this substantial drop from the prior month’s 4.5% figure are the falling energy prices and the effects of the interest rate hikes.
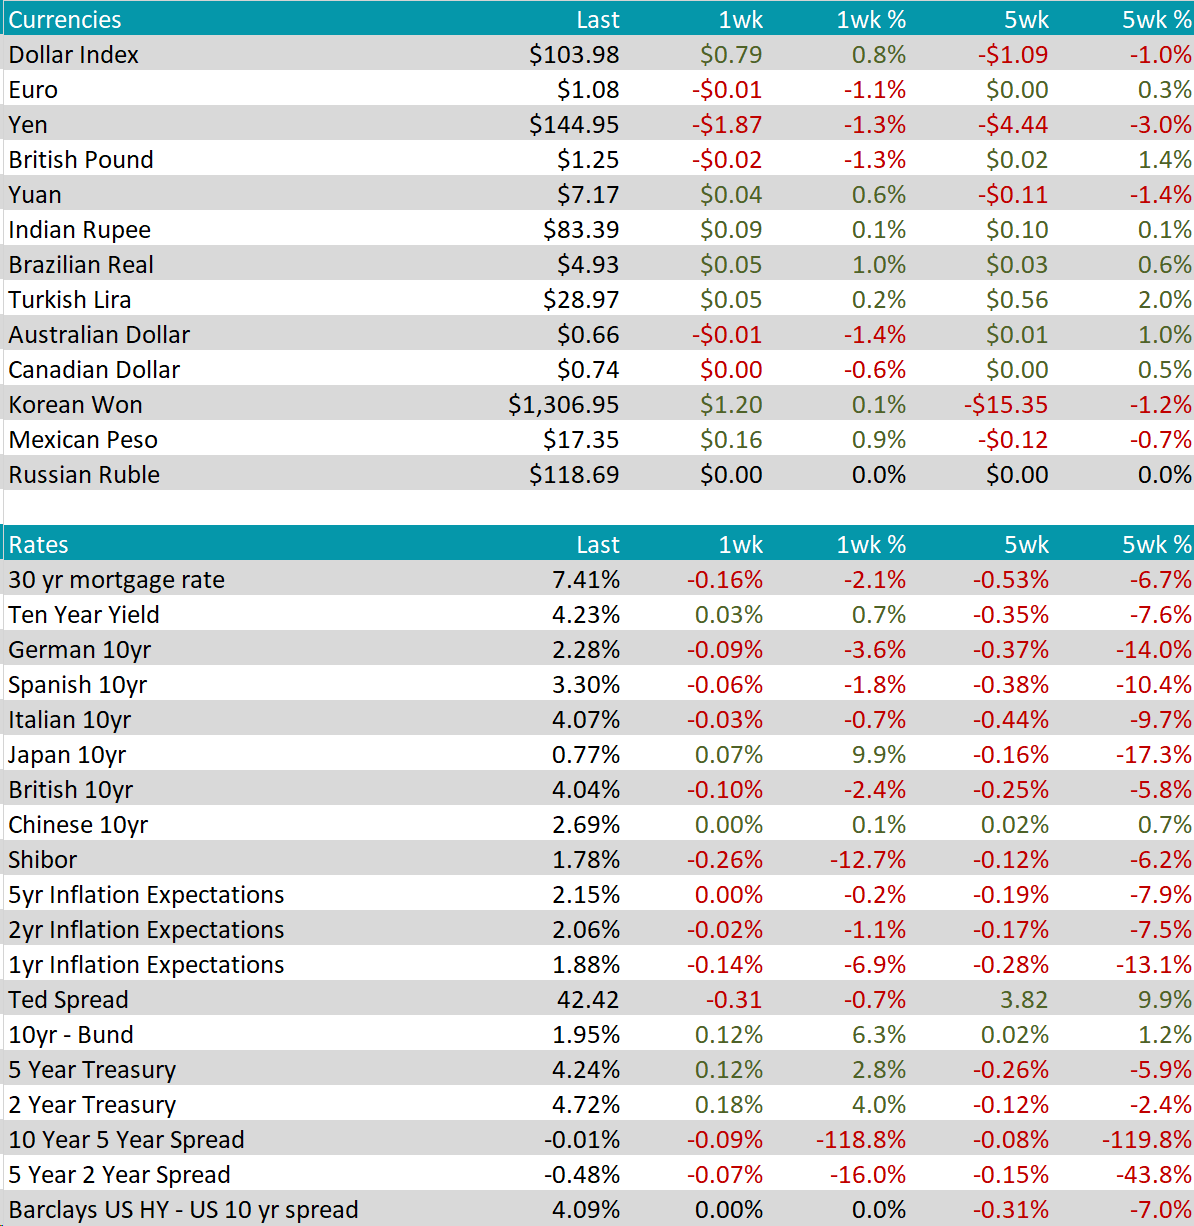
Last week, the Dollar Index (DXY) rose 0.8%, reaching a three-week high. Investors awaited major economic releases and the Fed’s final policy decision of 2023. Despite easing inflation, the Fed is signaling that they are going to challenge rate-cut expectations, given the labor market’s unexpected resilience. Nearly 200K jobs were added in November, surpassing expectations, and the USD strengthened against the JPY as investors adjusted rate hike expectations from the Bank of Japan.
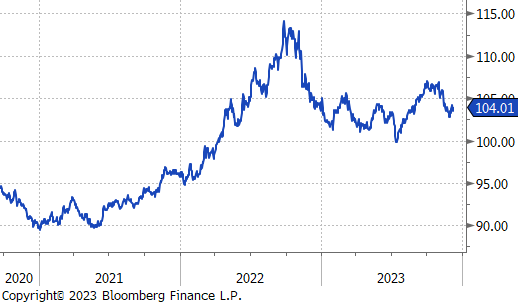
The EURUSD hit its lowest point since mid-November as focus shifted to the USD post a robust US jobs report. Dovish comments by ECB policymakers and a decline in Eurozone inflation contributed to the common currency’s pressure. Isabel Schnabel’s remarks indicated further interest rate hikes were “rather unlikely,” and Francois Villeroy de Galhau raised the possibility of a rate cut in 2024, reflecting the swift progression of disinflation. Evolving dynamics in the Eurozone and the US impacted the EURUSD exchange rate.
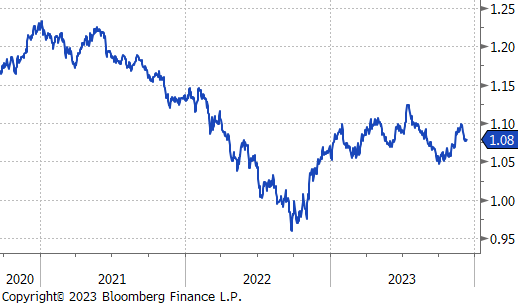
US 10-year Treasury Yield:
Long-dated treasuries rallied from three-month lows as markets awaited key releases for insights into the Fed’s policy direction. The Fed is expected to maintain its funds rate unchanged, highlighting the labor market’s resilience to high-interest rates.