Flack Capital Markets | Ferrous Financial Insider
February 14, 2025 – Issue #471
February 14, 2025 – Issue #471
Overview:
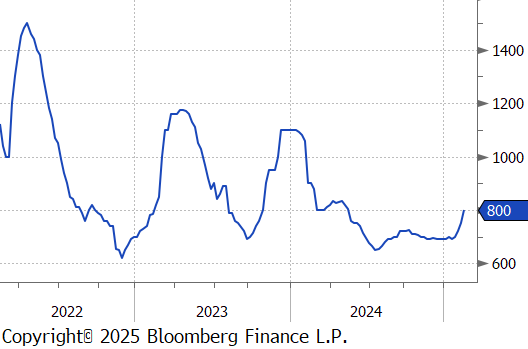
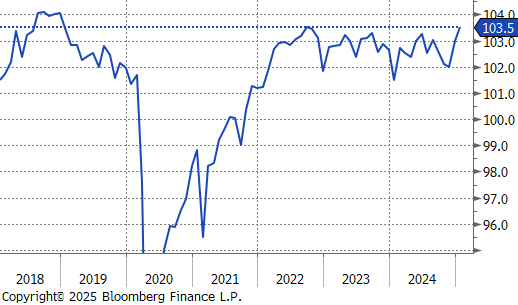
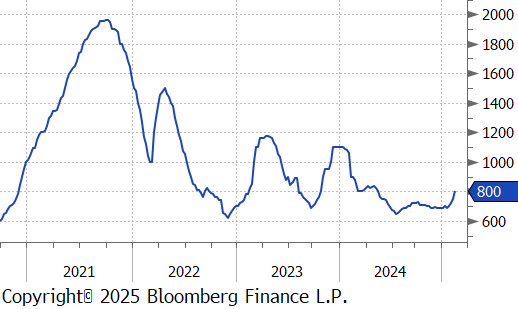
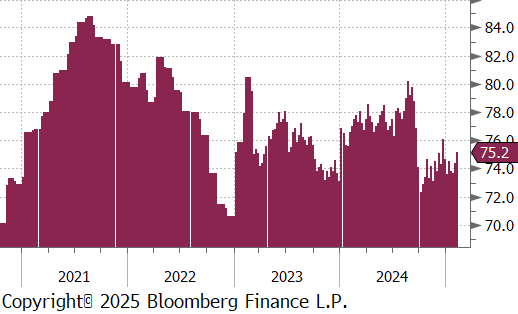
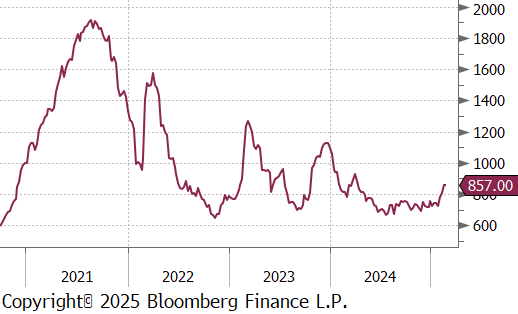
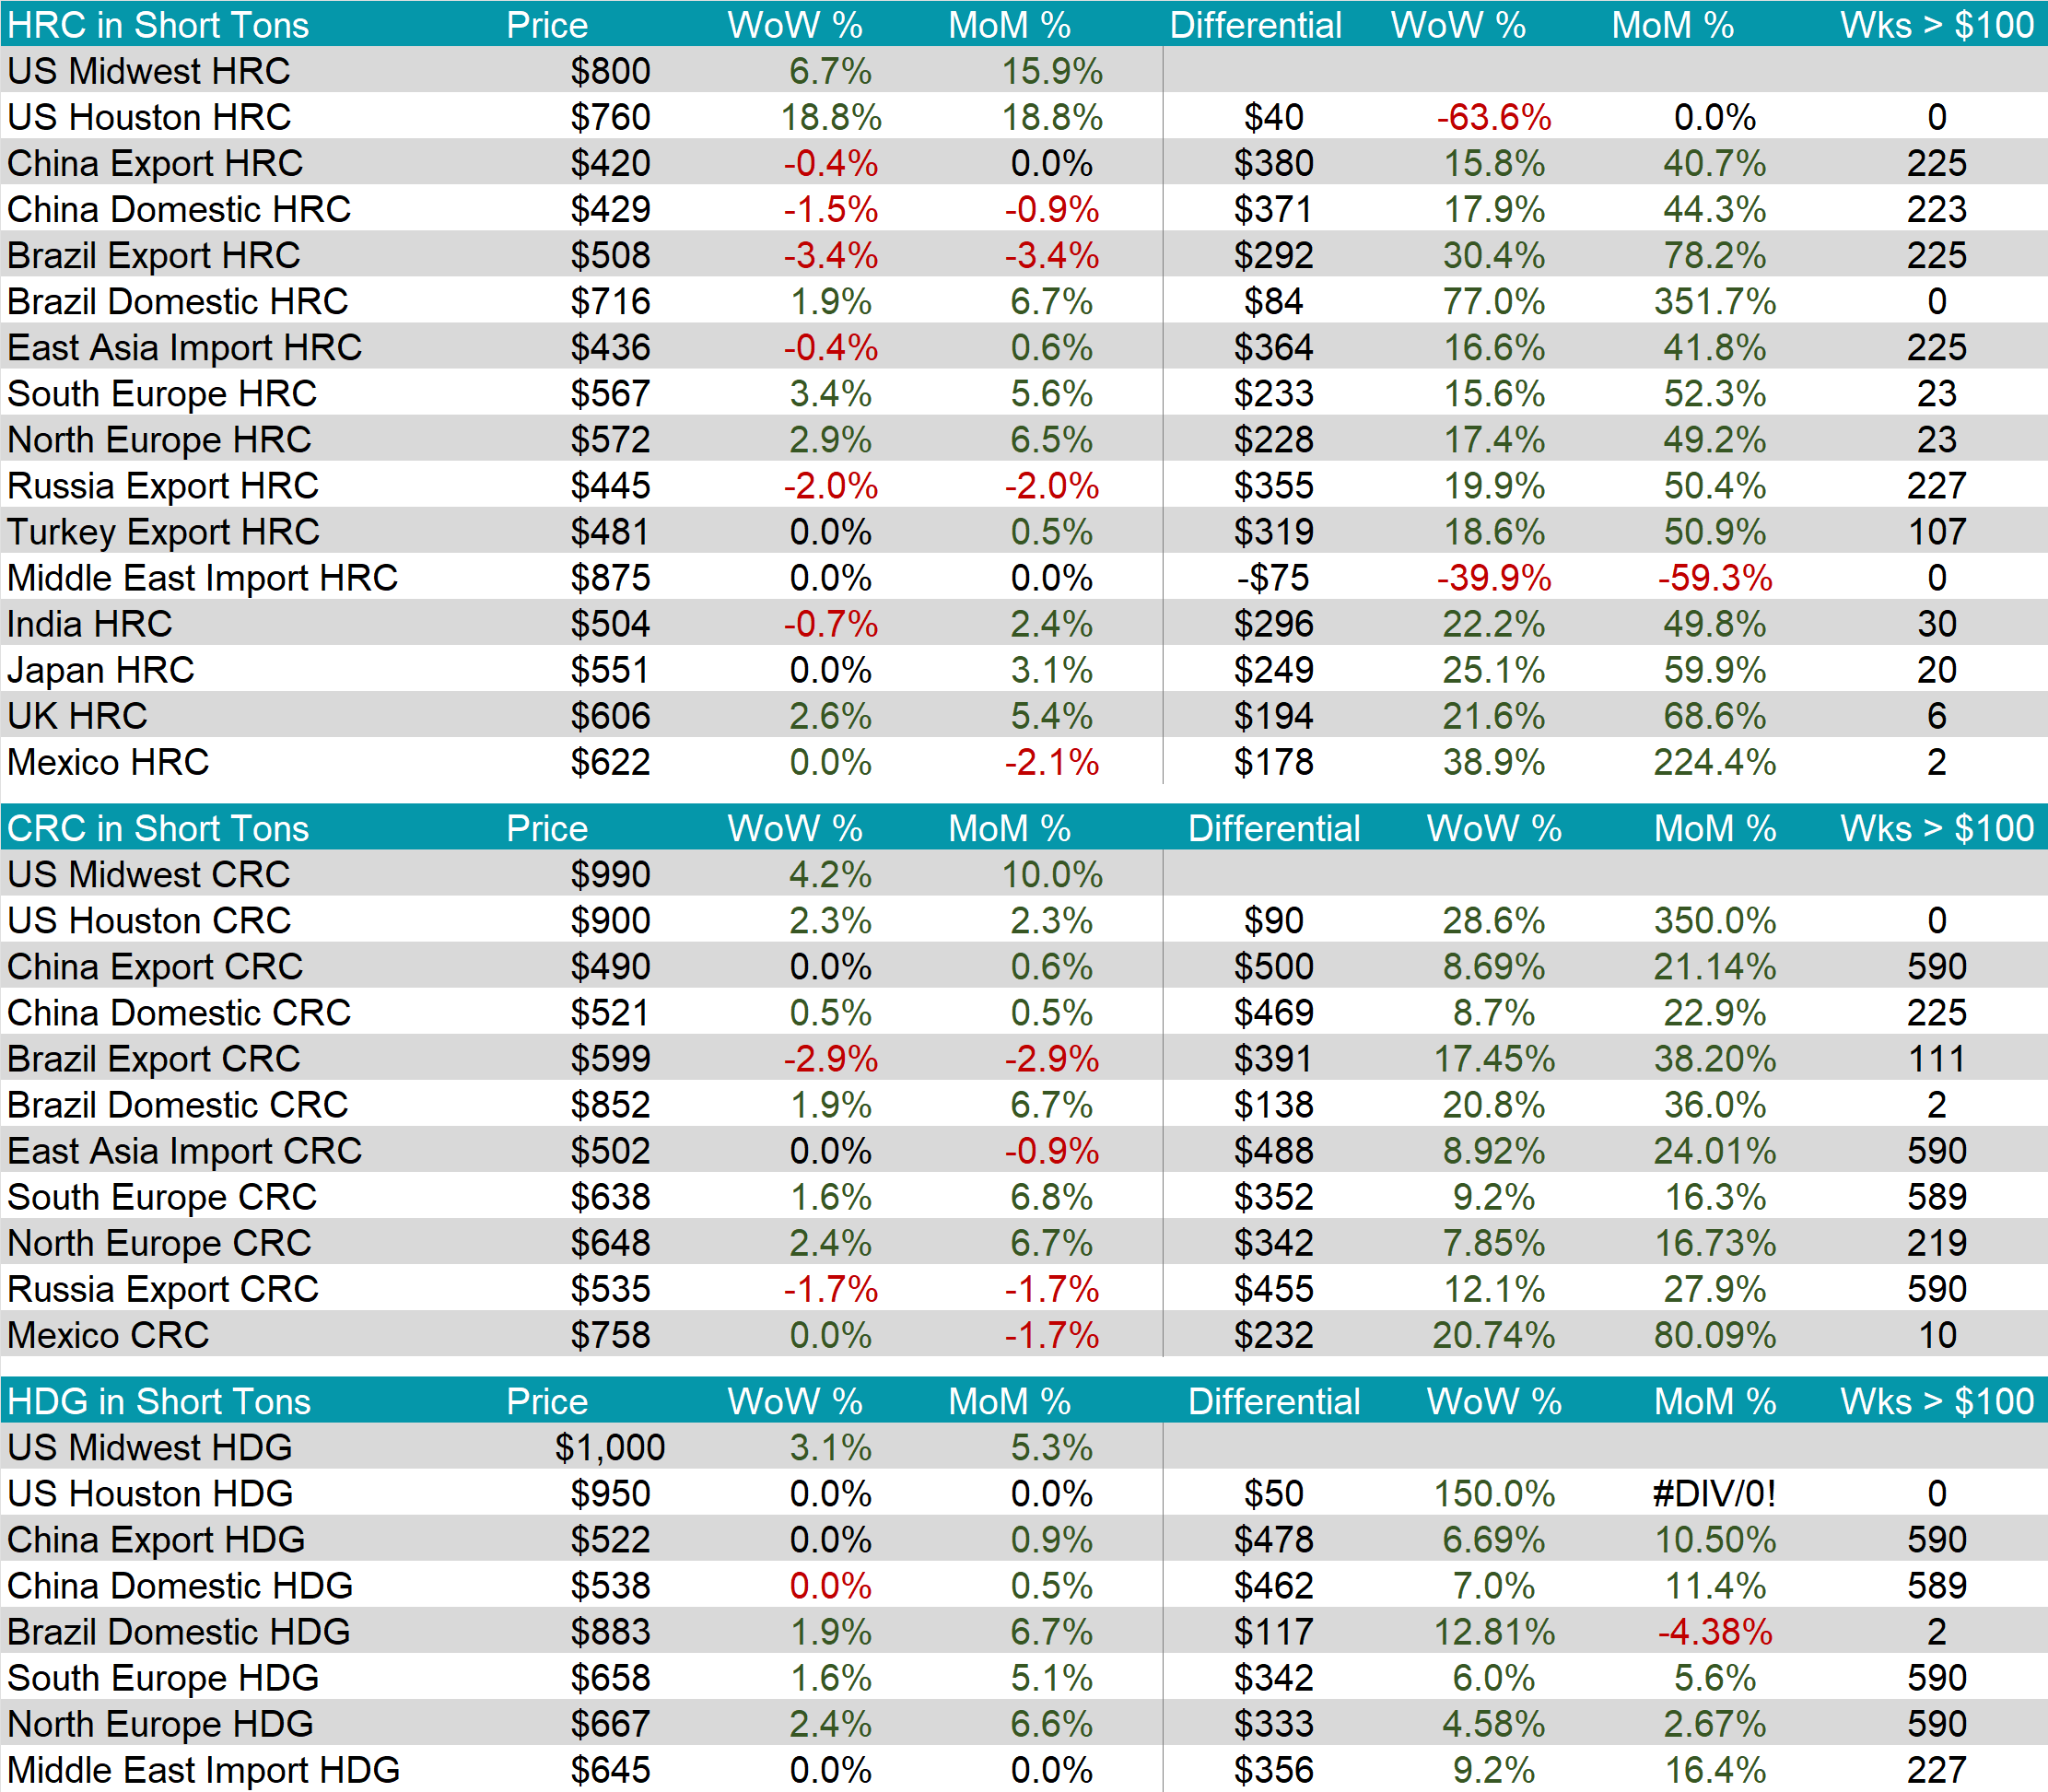
The HRC spot price surged by $50 or 6.7% to $800, hitting the highest price since May 2024 and marks the third consecutive week of notable increases. At the same time, the HRC 2nd month future jumped by $52 or 6.5% to $857, similarly marking the third consecutive week of notable increases and the highest price since April 2024.
Tandem products both increased, CRC up by $40 and HDG up by $30, resulting in the HDG – HRC differential to be down by $20 to $110.
Mill production resumed its upward trend, with capacity utilization continuing to tick up, this week by 0.8% to 75.2%, bringing raw steel production up to 1.675m net tons.
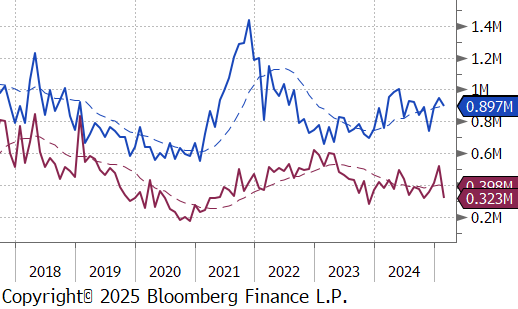
February Projection – Sheet 897k (down 49k MoM); Tube 323k (down 198k MoM)
January Projection – Sheet 946k (up 54k MoM); Tube 521k (up 110k MoM)
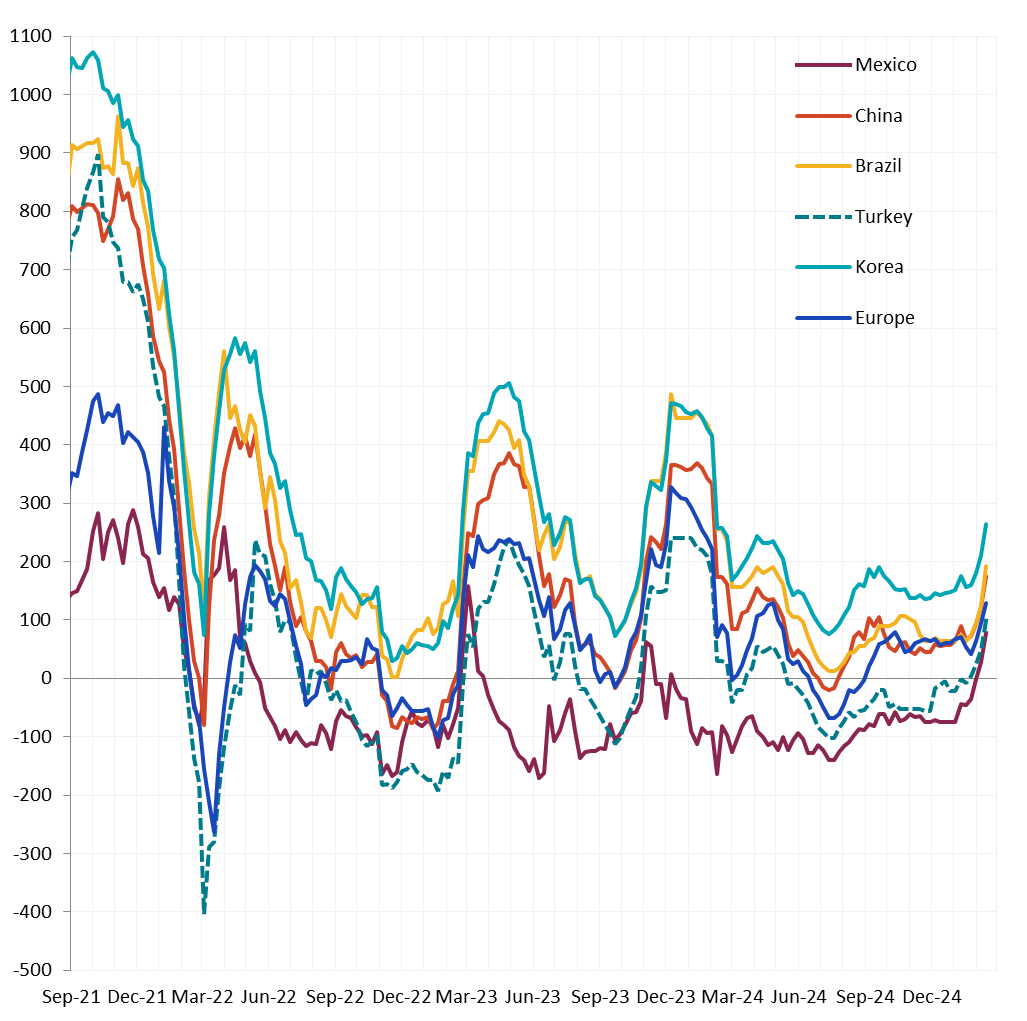
All watched global differentials expanded this week. China’s Export HRC and Korea’s HRC were both down by -0.4%, Brazil Export HRC fell by -3.4%, and Russia Export HRC fell by -2%, while N Europe HRC rose by 2.9%.
Scrap
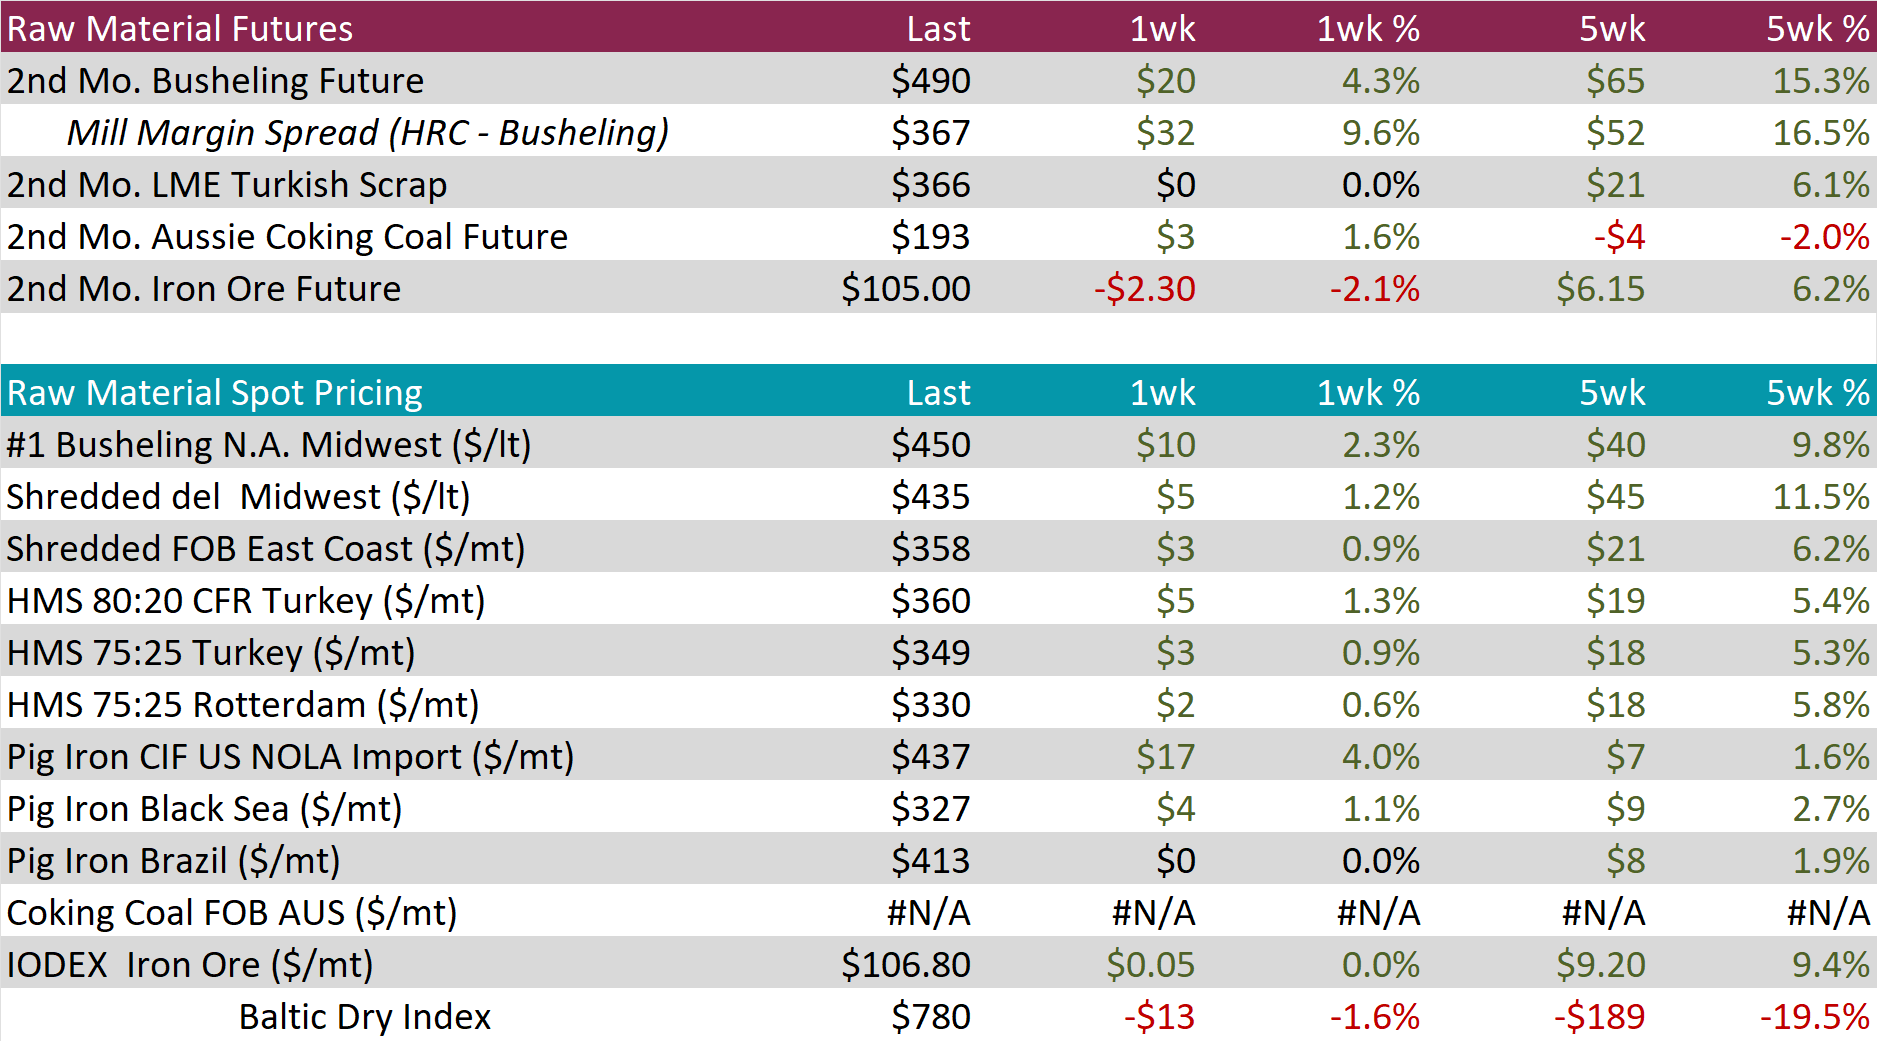
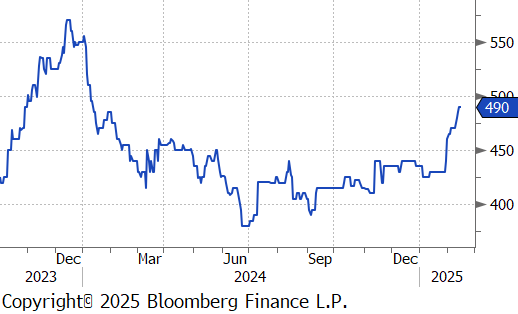
The 2nd month busheling future soared by $20 or 4.3% to $490, continuing its upward trend to reach the highest level since January 2024.
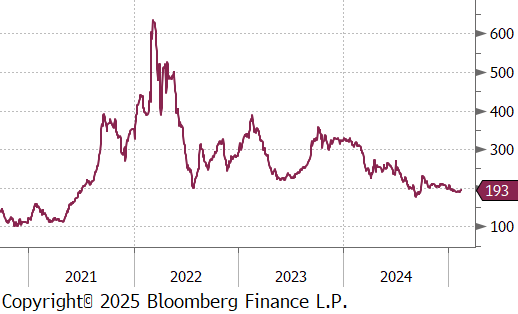
The Aussie coking coal 2nd month future inched up by $3 or 1.6% to $193 to reach its highest price in four weeks.
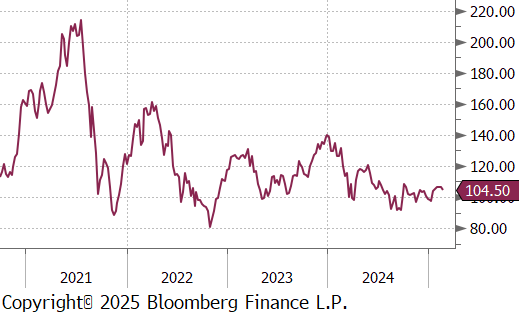
The 2nd month iron ore future declined by $2.30 or -2.1% to $105, ending four consecutive weeks of gains.
Dry Bulk / Freight
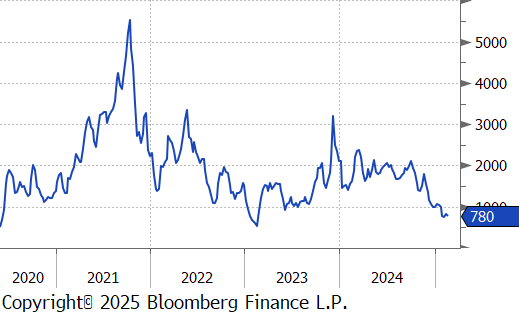
The Baltic Dry Index fell by $13 or -1.6% to $780, retreating from last weeks rebound.
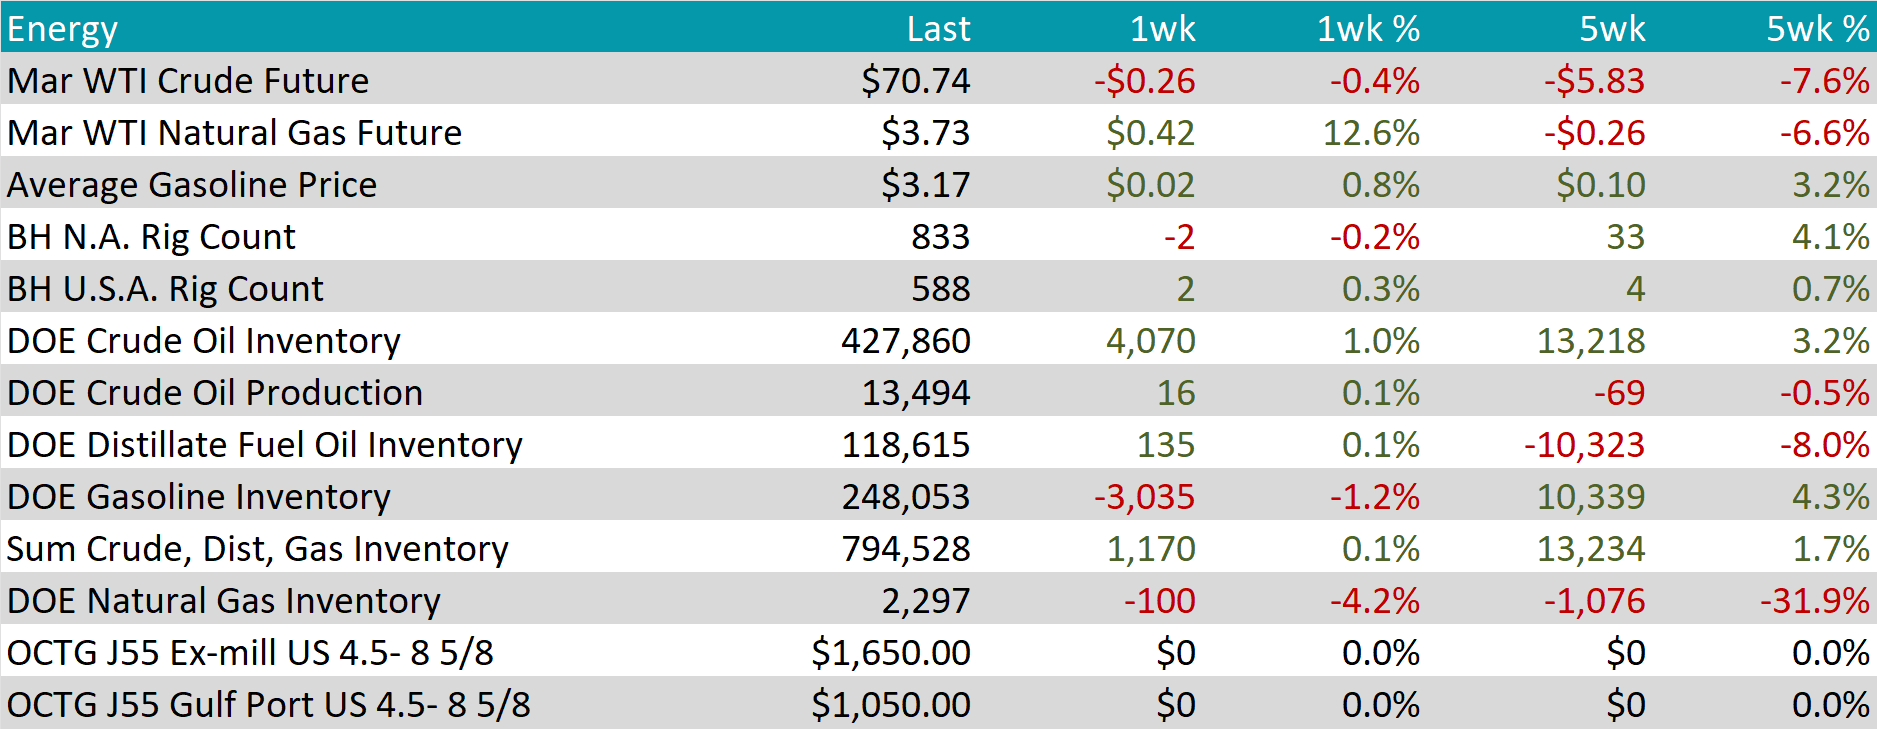
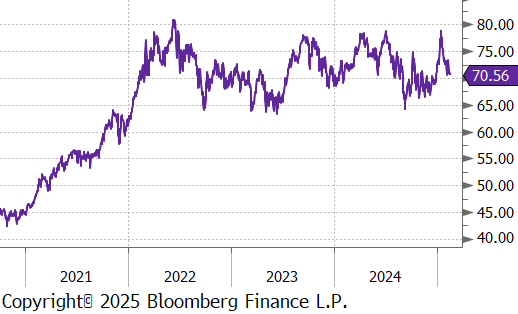
WTI crude oil future lost $0.26 or -0.4% to $70.74/bbl.
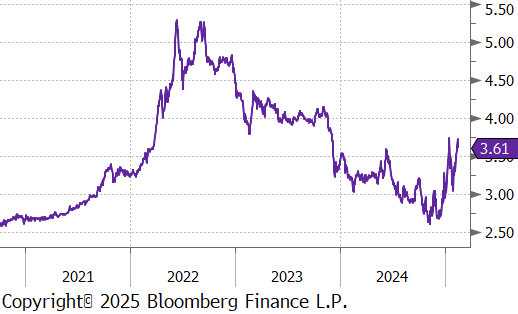
WTI natural gas future gained $0.42 or 12.6% to $3.73/bbl.
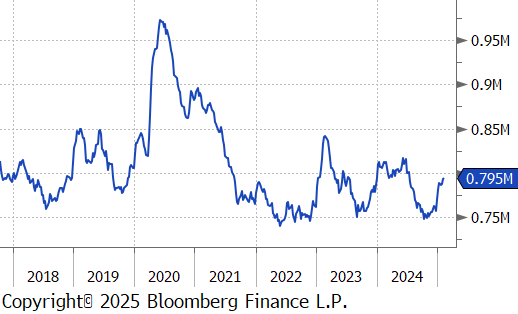
The aggregate inventory level experienced an increase this week of 0.1%.
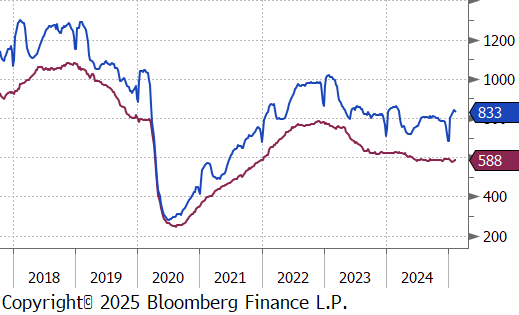
The Baker Hughes North American rig count reduced by 2 rigs, bringing the total count to 833. Conversely, the US rig count added to rigs, bringing the total count to 588 rigs.
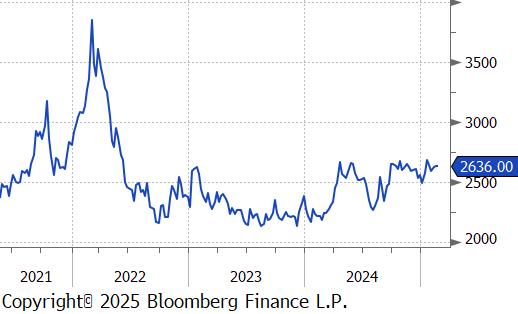
Aluminum futures rose by $10 or 0.4% to $2,638 as expectations of tighter supply and recovering manufacturing demand supported prices. China produced a record 44 million tons of aluminum in 2024, but output is set to slow significantly as Beijing enforces its longstanding production cap of 45 million tons, introduced in 2017 to curb excess supply and meet carbon emission targets. This comes despite Beijing’s fiscal stimulus measures aimed at boosting consumption, which could lead to an expansion in the budget deficit. In the U.S., ISM data revealed that the manufacturing sector unexpectedly rebounded in January, marking its first expansion in over two years, further improving the demand outlook for aluminum. However, aluminum prices outside the U.S. remained under pressure due to ongoing tariffs imposed by President Trump, dampening demand for imported metal.
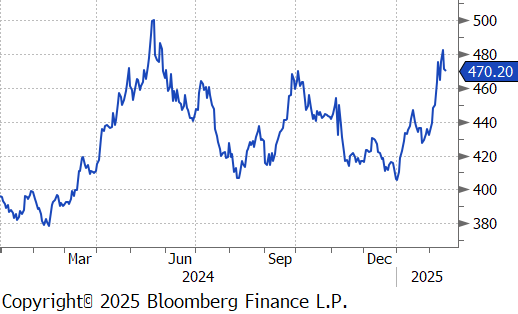
Copper futures increased by $12.40 or 2.7% to $471 as concerns over potential U.S. tariffs on copper imports eased. The metal had surged to amid fears of temporary tightness in the U.S. copper market, with the spread between CME and LME contracts widening by more than 10%. However, President Donald Trump indicated that tariffs on copper would take longer to implement compared to the recently announced levies on aluminum and steel, easing immediate market anxieties. Meanwhile, in China, authorities have imposed restrictions on copper smelting to curb excess capacity, a move aimed at addressing oversupply in the sector. Despite rising copper imports and declining inventories, many smelting firms are struggling with profitability due to the imbalance between production and demand.
Precious Metals
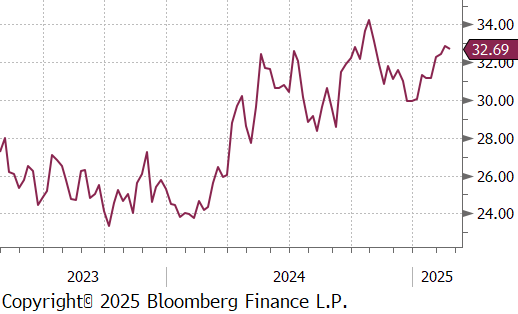
Silver inched up by $0.41 or 1.3% to $32.86. Investors remained watchful of U.S.-led diplomatic efforts to resolve the war in Ukraine, which, if successful, could reduce demand for safe-haven assets like silver. Despite recent fluctuations, silver reached a three-month high, driven by strong industrial demand, particularly in electrification and manufacturing. Fresh data highlighted China’s addition of 357 gigawatts of solar and wind power in 2024, reinforcing silver’s critical role in the clean energy transition. Meanwhile, India’s Oil and Natural Gas Corp pledged INR 1 trillion in wind and solar investments by 2030, and Indonesia committed to adding 17 gigawatts of solar capacity through state-owned enterprises, further solidifying long-term demand for industrial silver.
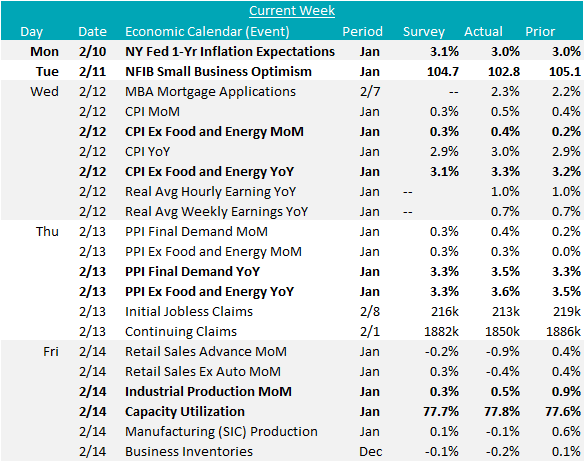
January Industrial Production data surprised to the upside, increasing by 0.5% month-over-month, surpassing the forecasted 0.3%, with Capacity Utilization ticking up by 77.8% (vs 77.7%) from December’s 77.6%. This points to resilience in the sector, signaling that demand may be holding steady. However, Manufacturing (SIC) Production missed expectations, declining by -0.1%, compared to the anticipated 0.1% increase, following December’s 0.6% rise, suggesting that the manufacturing sector is still facing some challenges.
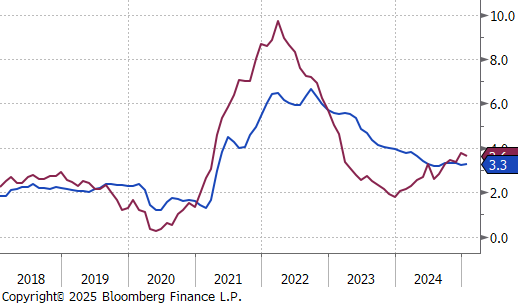
The main event this week was the inflation data, which came in hotter than expected. The Consumer Price Index (CPI) YoY for Core increased by 3.3%, vs the expected 3.1%, and the Topline rose by 3.0%, exceeding the 2.9% forecast. While seasonal factors and base effects played a role, this acceleration in inflation suggests that the previous disinflationary trend has stalled for now. Similarly, the Producer Price Index (PPI) YoY for Core rose by 3.6%, vs the anticipated 3.3%, and the Topline advanced by 3.5%, surpassing the forecasted 3.3%. These results indicate that inflation remains sticky, making limited progress toward stabilization ahead of expected tariff implementations. The strong inflation data significantly reduced the likelihood of multiple interest rate cuts by the Fed this year.
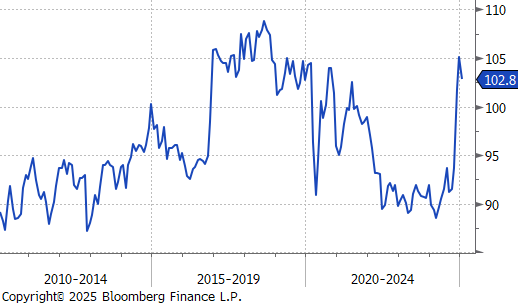
Lastly, on the sentiment front, the January NFIB Small Business Optimism index fell short of expectations, falling to 102.8 vs 104.7 from December’s multiyear high of 105.1. This revealed some cautiousness around future activity as uncertainty resurged. Additionally, the NY Fed 1-Year Inflation Expectations for January held steady at 3.0%, beating the forecasted increase to 3.1%, suggesting that consumers’ outlook on inflation remains relatively stable.