Flack Capital Markets | Ferrous Financial Insider
February 17, 2023 – Issue #367
February 17, 2023 – Issue #367
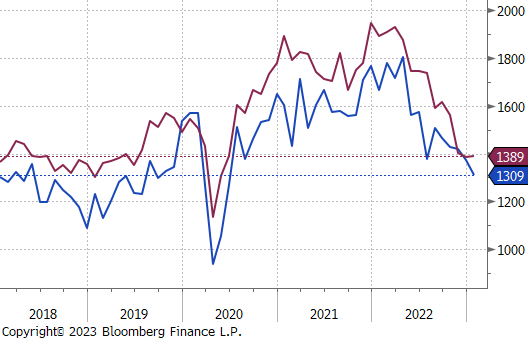
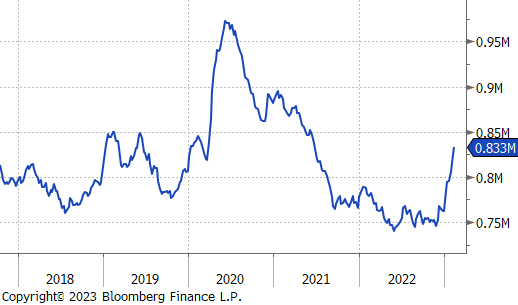
This week, the most notable steel related data came from the construction sector, with housing starts and building permits released on Thursday, February 16th. After permits crossed under starts in November and remained below in December, steady downward momentum in housing starts (down 5-straight-months) caused them to push back under building permits. At first glance, the obvious takeaway is that the housing and construction markets remain under pressure with each peaking early last year. While this is clearly true, it is not new information, and has already been largely broadcast. What is more significant is the underlying recent trend in permits which have leveled off around mid-2019 levels on a seasonally adjusted basis.
What does this mean for the broader market? The construction market is the bellwether in a rising rates environment for steel consuming sectors. On top of that, building permits, which lead starts and eventual sales was the first to peak in April. Over the second half of last year, we have seen contraction in manufacturing and moderation in other sectors. However, if construction is in fact stabilizing around pre-pandemic levels going into warmer weather, this is a positive signal for demand in the broader market. At the same time, it should be a concern for buyers that have been reluctant to restock. Subdued supply levels from domestic production, imports, and inventories could quickly create a short-term shortage.
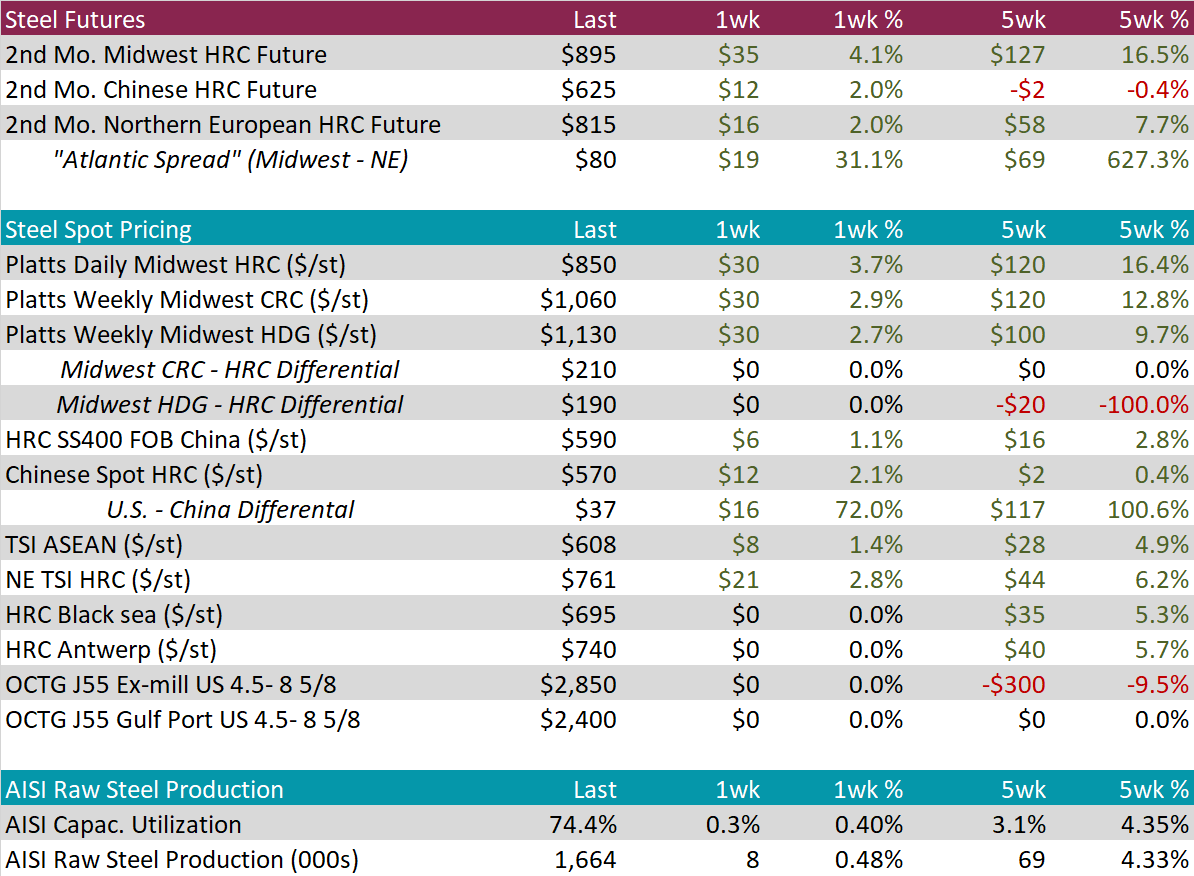
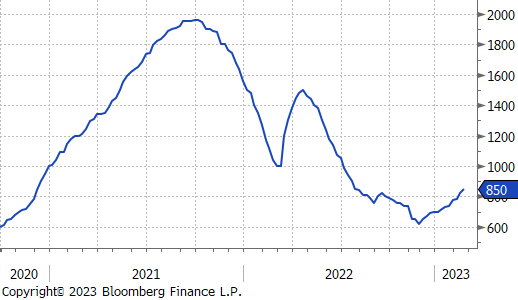
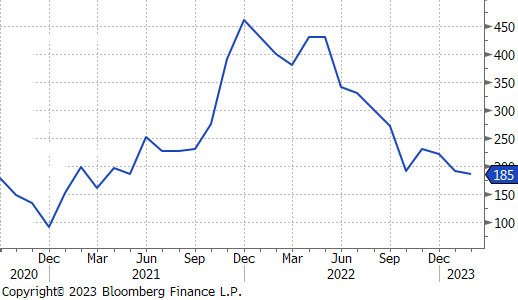
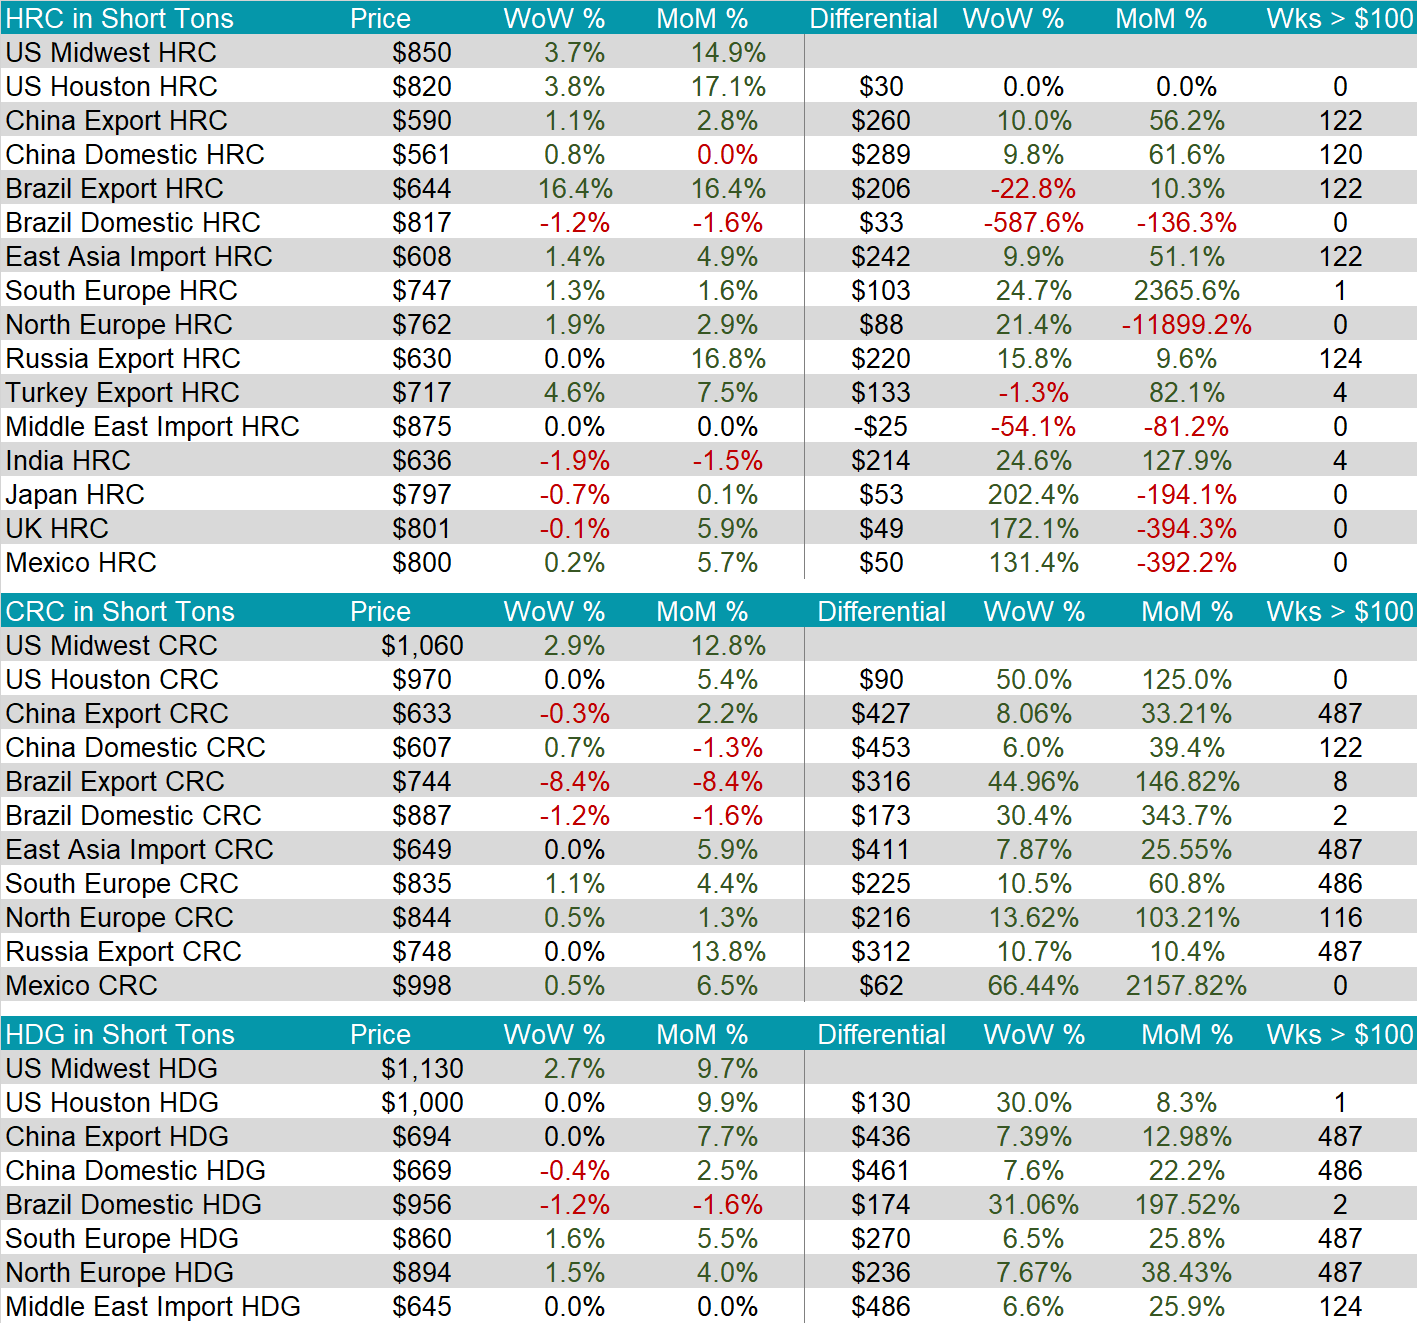
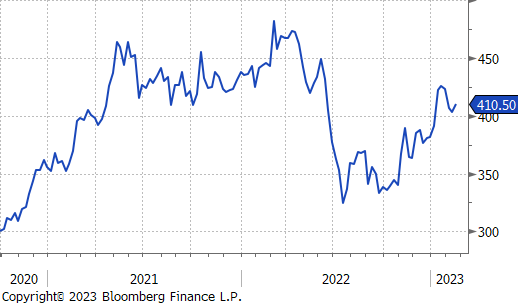
HRC – The domestic HRC spot price rally continues to pick up steam, up 3.7% on the week, and 16.4% over the last 5 weeks. This is mirrored in the futures market with the 2nd month future up 4.1% on the week, and up 16.5% over the last 5 weeks.
Anecdotally, last week was notable in the physical market as the first week in the rally when lead times meaningfully pushed out, with most mills now reporting that they are sold out of March spot tons.
Tandem products – The rally also continued for CRC and HDG last week, with each up 2.9% and 2.7%, respectively. All three domestic prices rose equally in $/s.ton, so the differentials did not change.
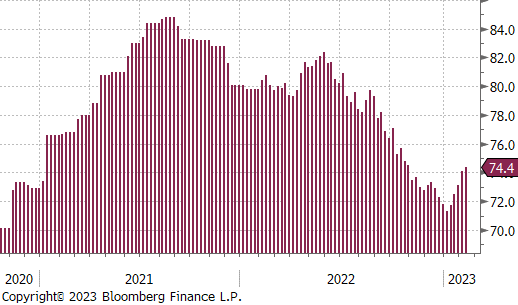
Domestic production continues to increase, with capacity utilization up to 74.4%. Over the last 5 weeks, production has increased by 69,000 tons per week.
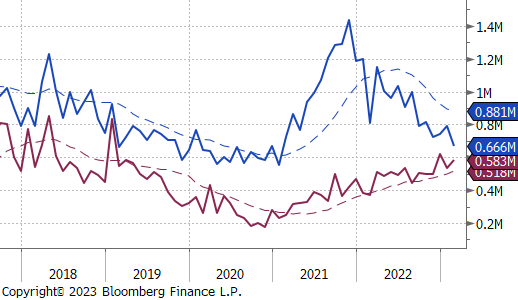
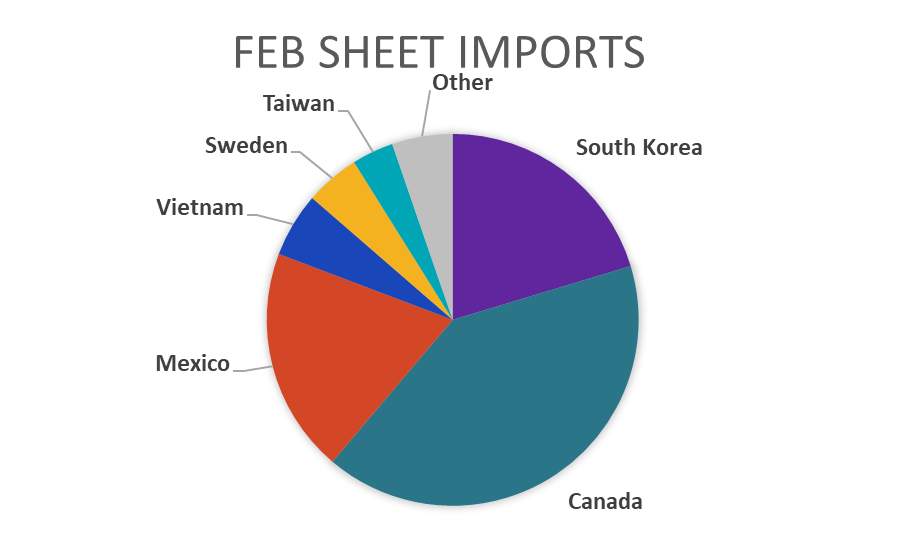
February Projection – Sheet 666k (down 127k MoM); Tube 583k (up 50k MoM)
January Projection – Sheet 793k (up 50k MoM); Tube 533k (down 88k MoM)
The current projection for February sheet import arrivals would be the lowest level since January 2021, over 2-years ago. Prior global price dynamics suggest that imports should remain subdued in the near-term.
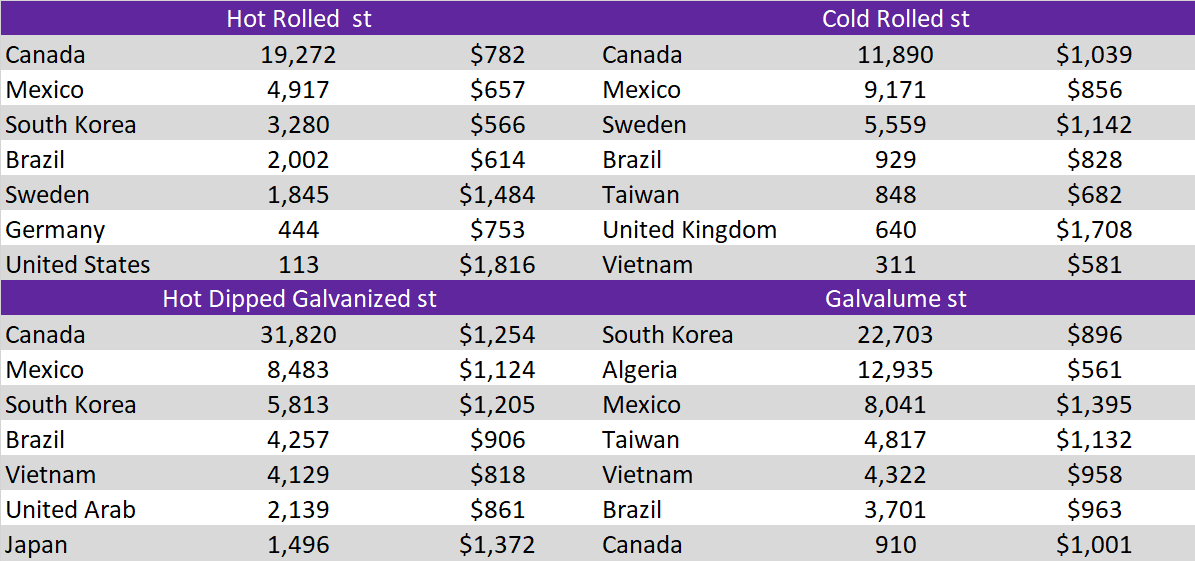
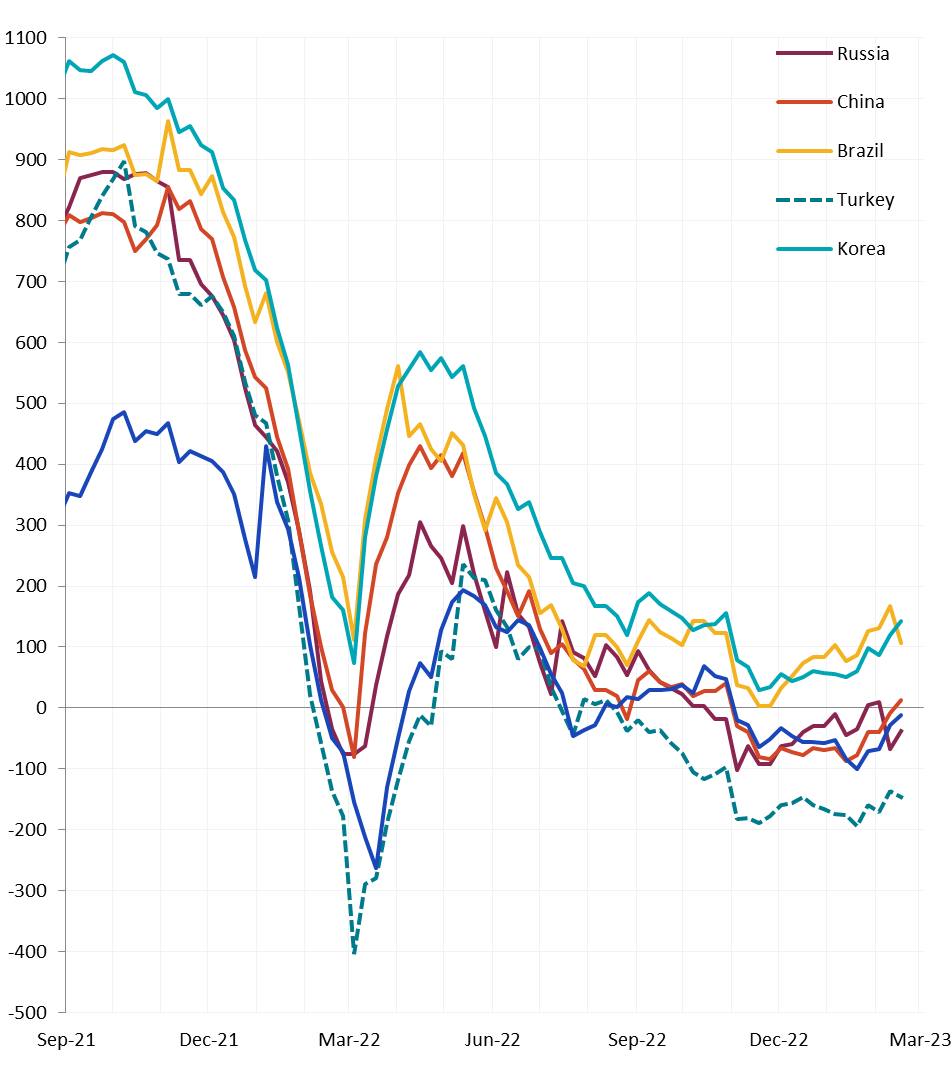
Global price differentials were higher for most of the watched countries, except for Brazil and Turkey. This highlights the fact that the domestic rally is outpacing the rest of the world. Furthermore, this is first time we have a positive U.S. v China differential since the end of October.
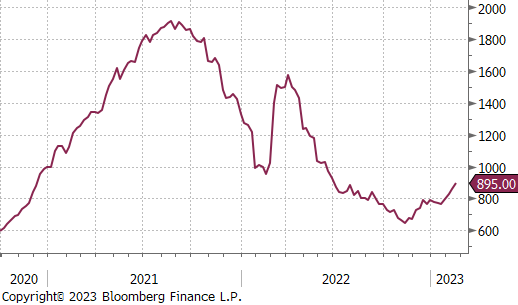
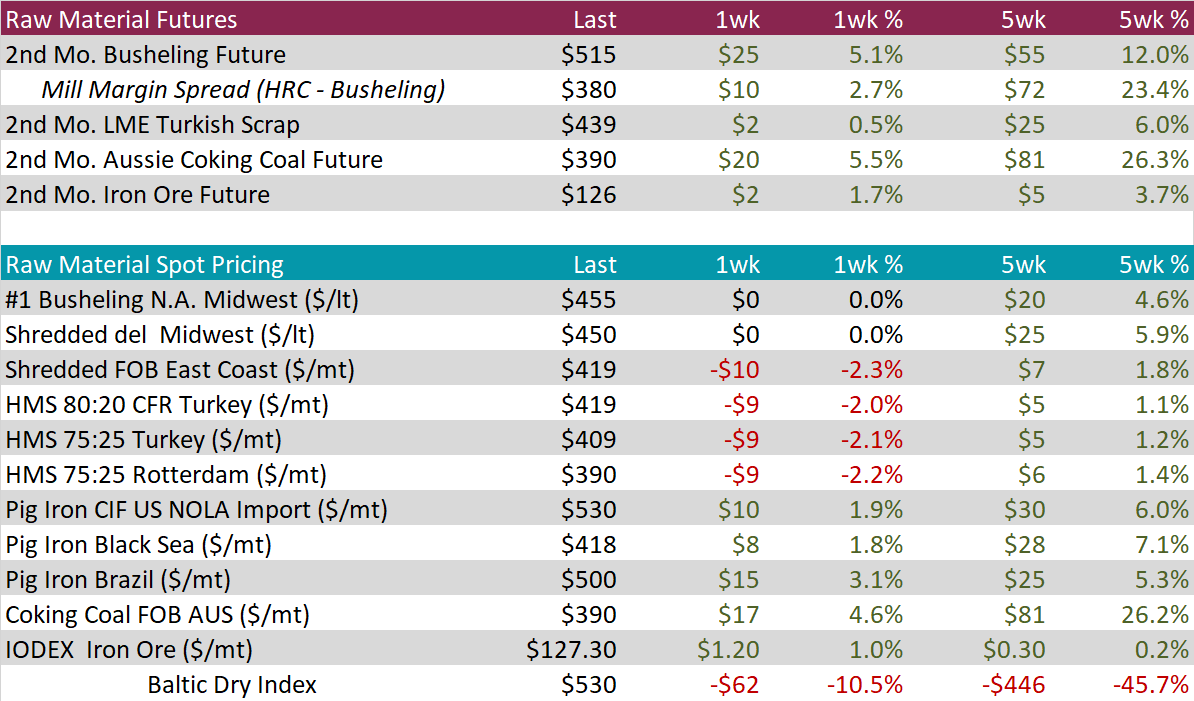
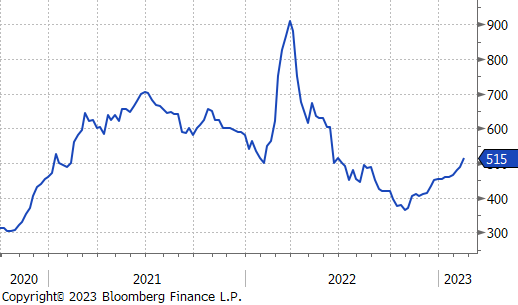
The 2nd month (April) busheling future was up another 5.1%. Notably, other global scrap prices receded in the spot market last week, with East Coast FOB shredded, Turkish 80/20 & 75/25, and Rotterdam 75/25 each down around 2%. The divergence is likely due to the news coming out of Turkey, where it is uncertain when the steel industry will be able to fully restart following the earthquake.
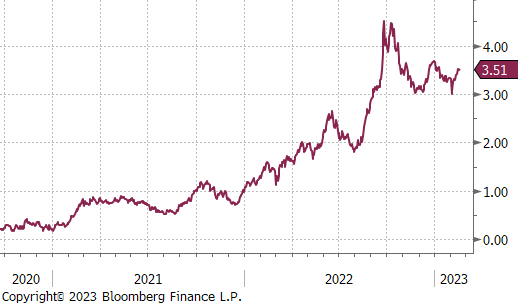
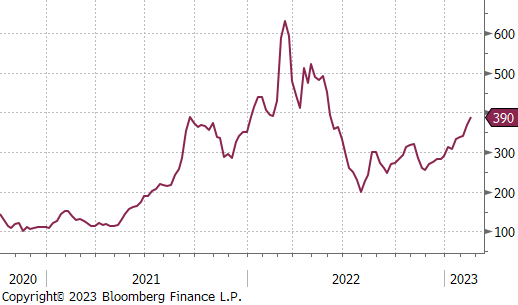
The 2nd month (March) coking coal future continues to rally, up another 5.5%, last week. The price is now at the highest level since the end of May, last year.
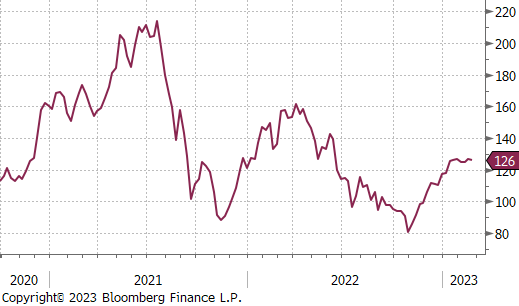
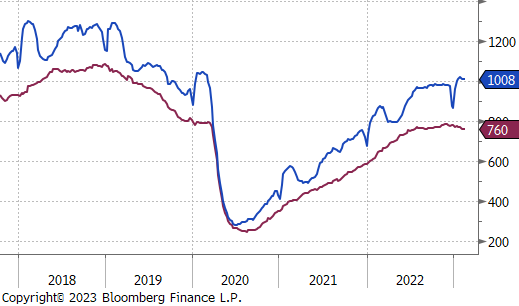
After rallying since early November because of China’s reopening and the anticipated support of their property sector, the 2nd month iron ore future has essentially flatlined, trading in the range of $120-130 since the beginning of the year. This week it was up 1.7%. Taking a step back, weekly iron ore exports from Australia and Brazil are severely depressed with the 6-month and 12-month average of each around the lowest levels since the data began in 2015. If demand in China is stable, restricted supply in exports would be supportive of higher prices.
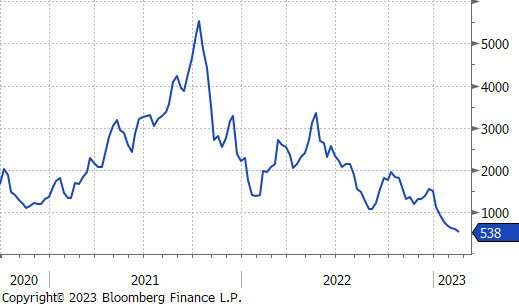
The Baltic dry index continues to fall, down another 10.5% on the week. The sustained move lower is likely related to the fact that iron ore exports are down.
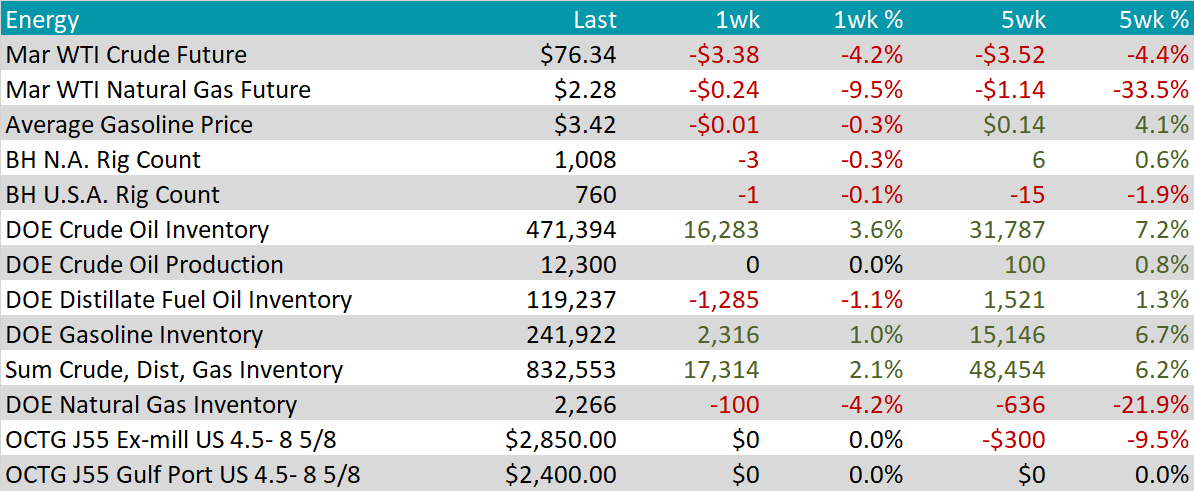
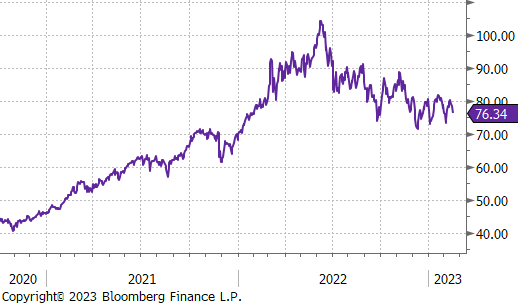
March WTI crude oil future lost $3.38 or 4.2% to $76.34/bbl.
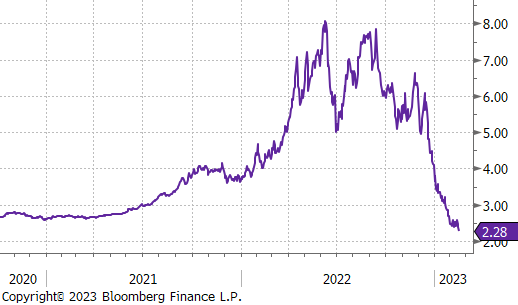
March WTI natural gas future lost another $0.24 or 9.5% to $2.28/bbl.
The selloff in both was largely due to the already announced strategic petroleum reserve release and seasonally warm weather. Additionally, the aggregate inventory level was up another 2.1%.
The Baker Hughes North American rig count was down another 3 rigs, and the U.S. rig count was down 1 rig.
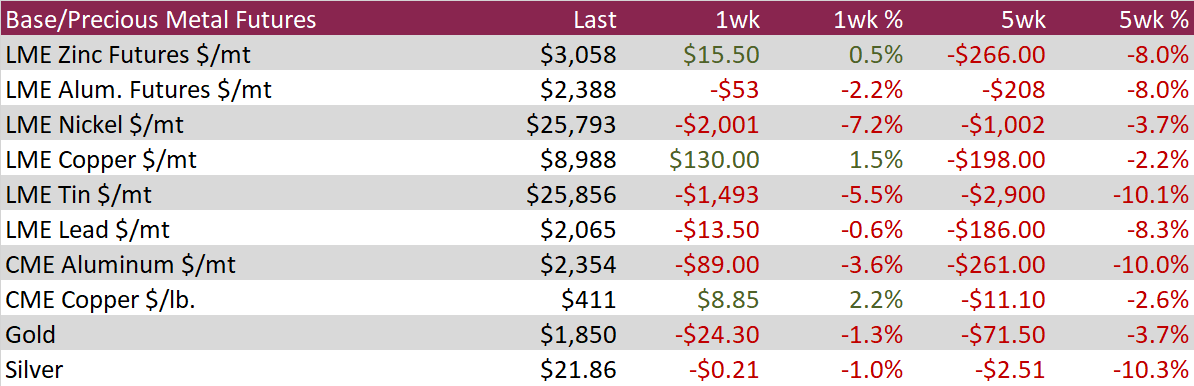
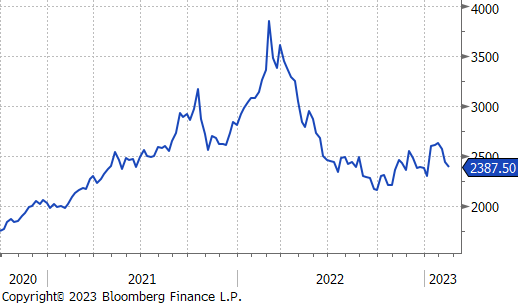
Aluminum futures finished the week lower by 2.2% as stocks continue to build on LME and SHFE and as the U.S. Dollar advanced. Aluminum futures have consolidated in 11 of the 13 trading days during February after rallying to the highest price in 7-months to begin 2023.
CME Copper finished 2.2% higher this past week, breaking out of a 3-week slump where copper futures fell to a 1-month low. The price of copper has been rangebound since early February after rallying sharply to start the year on optimism of a China reopening. The nearby forward curve flipped into backwardation as COMEX inventories dropped to the lowest level since February 2015 at 21.7kt.
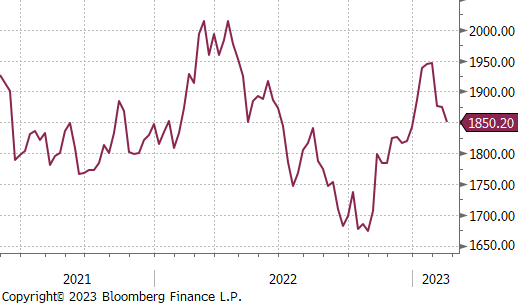
Gold fell 1.3% during the week as the US dollar continue to recover, however futures were down close to 3% during the lows last week before a late rally on Friday helped the metal recover much of its losses. Holdings in exchange-traded funds have drifted lower since April, with outflows slowing somewhat since November.
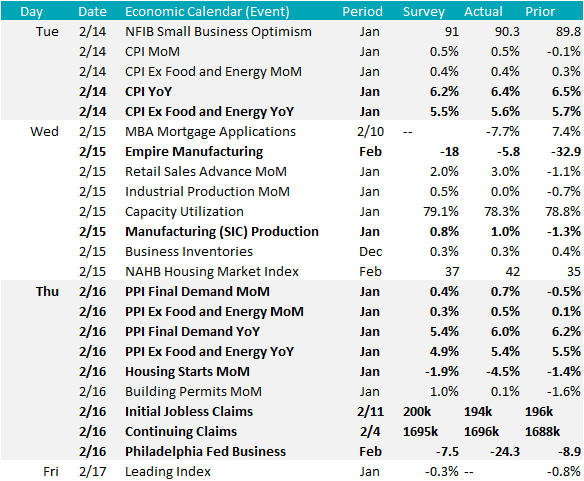
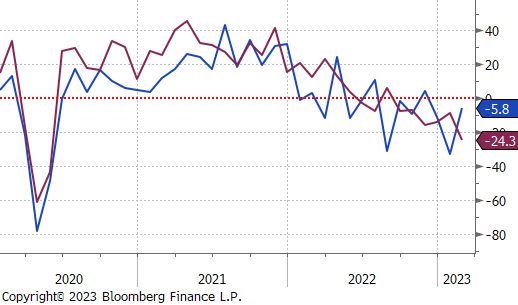
Manufacturing – This week, the Federal Reserve manufacturing surveys for New York (Empire) and Philadelphia were released. While the direction for the two separate surveys is mixed, both signal continued contraction in the sector. The Empire survey is up from -32.9 in January to -5.8, above expectations of -18, and Philadelphia is down from -8.9 in January, to -24.3, well below expectations of -7.5.
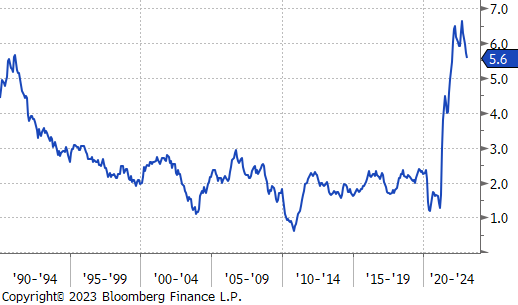
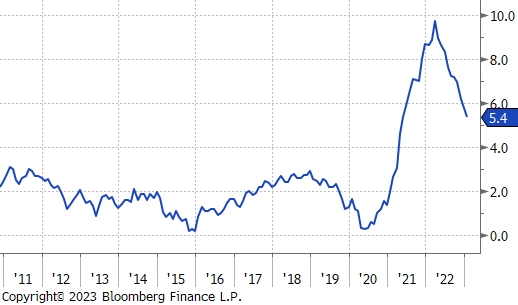
Inflation – This week, we received CPI (Consumer Price Index) and PPI (Producer Price Index) data. Both showed that rising price momentum is stickier than market expectations and the Fed’s fight with inflation is far from over. Consensus expectations for YoY Core CPI data was a continued moderation to 5.5% in January, from 5.7% in December. The actual data split the difference, with prices coming in 5.6% higher than last year. On the producer side, the positive surprise was more pronounced. YoY Core PPI data came in at 5.4%, down slightly from December at 5.5%, but well above expectations of 4.7%. Looking more closely at the data, January prices accelerated on a MoM basis, up 0.5%, versus 0.1% in December. Following this and recent strong labor market data, the market has largely capitulated with the Fed and probabilities of an interest rate cut this year, have all but evaporated. The Fed’s preferred inflation gauge, the PCE deflator will be released on Friday 02/24.
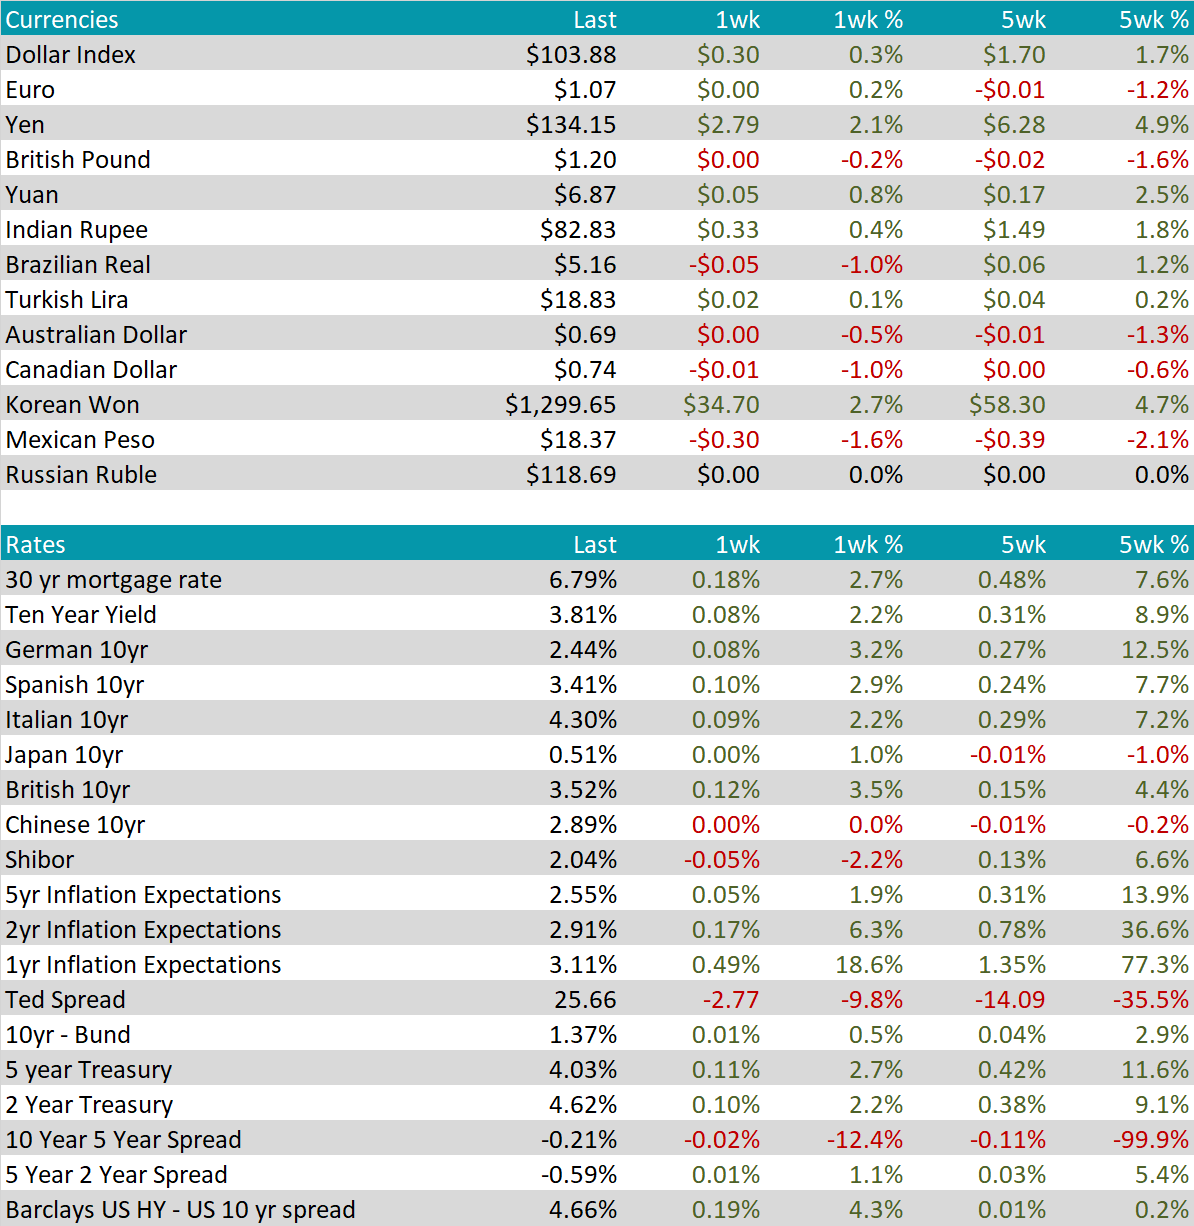
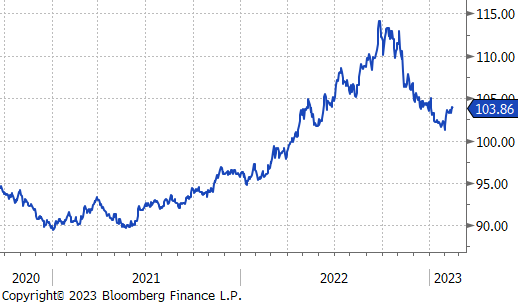
U.S. dollar was slightly higher on the week, as inflation data stabilized, and Federal Reserve speakers came out as largely hawkish.
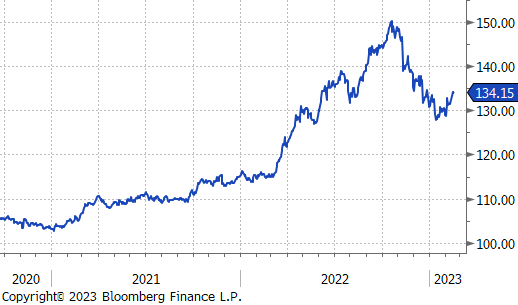
The Japanese yen significantly weakened versus the U.S. dollar over the past week. The BOJ also nominated a new governor last week, Kazuo Ueda is viewed as a strong supporter of the ultra-easy monetary policy that has been synonymous with the central bank.
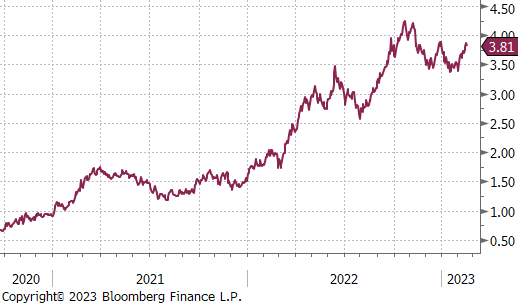
The U.S. 10yr yield increased further, up 8 bps to 3.81%. The entire treasury curve increased this week, as market expectations are lining up more with where the Federal Reserve has been positioned: higher rates for longer.
The British 10yr yield was up most significantly among watched countries, increasing 12 bps on the week and ending at 3.52%. The market anticipates that the BOE will raise interest rates 25bps twice more before June.