Flack Capital Markets | Ferrous Financial Insider
February 28, 2025 – Issue #473
February 28, 2025 – Issue #473
Overview:
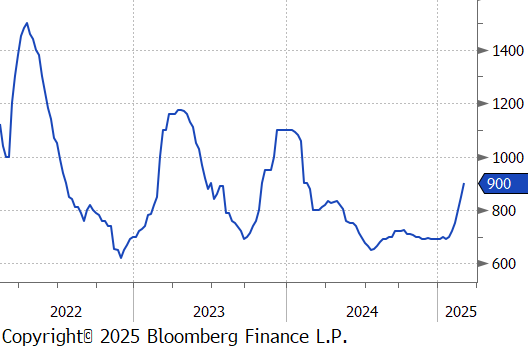
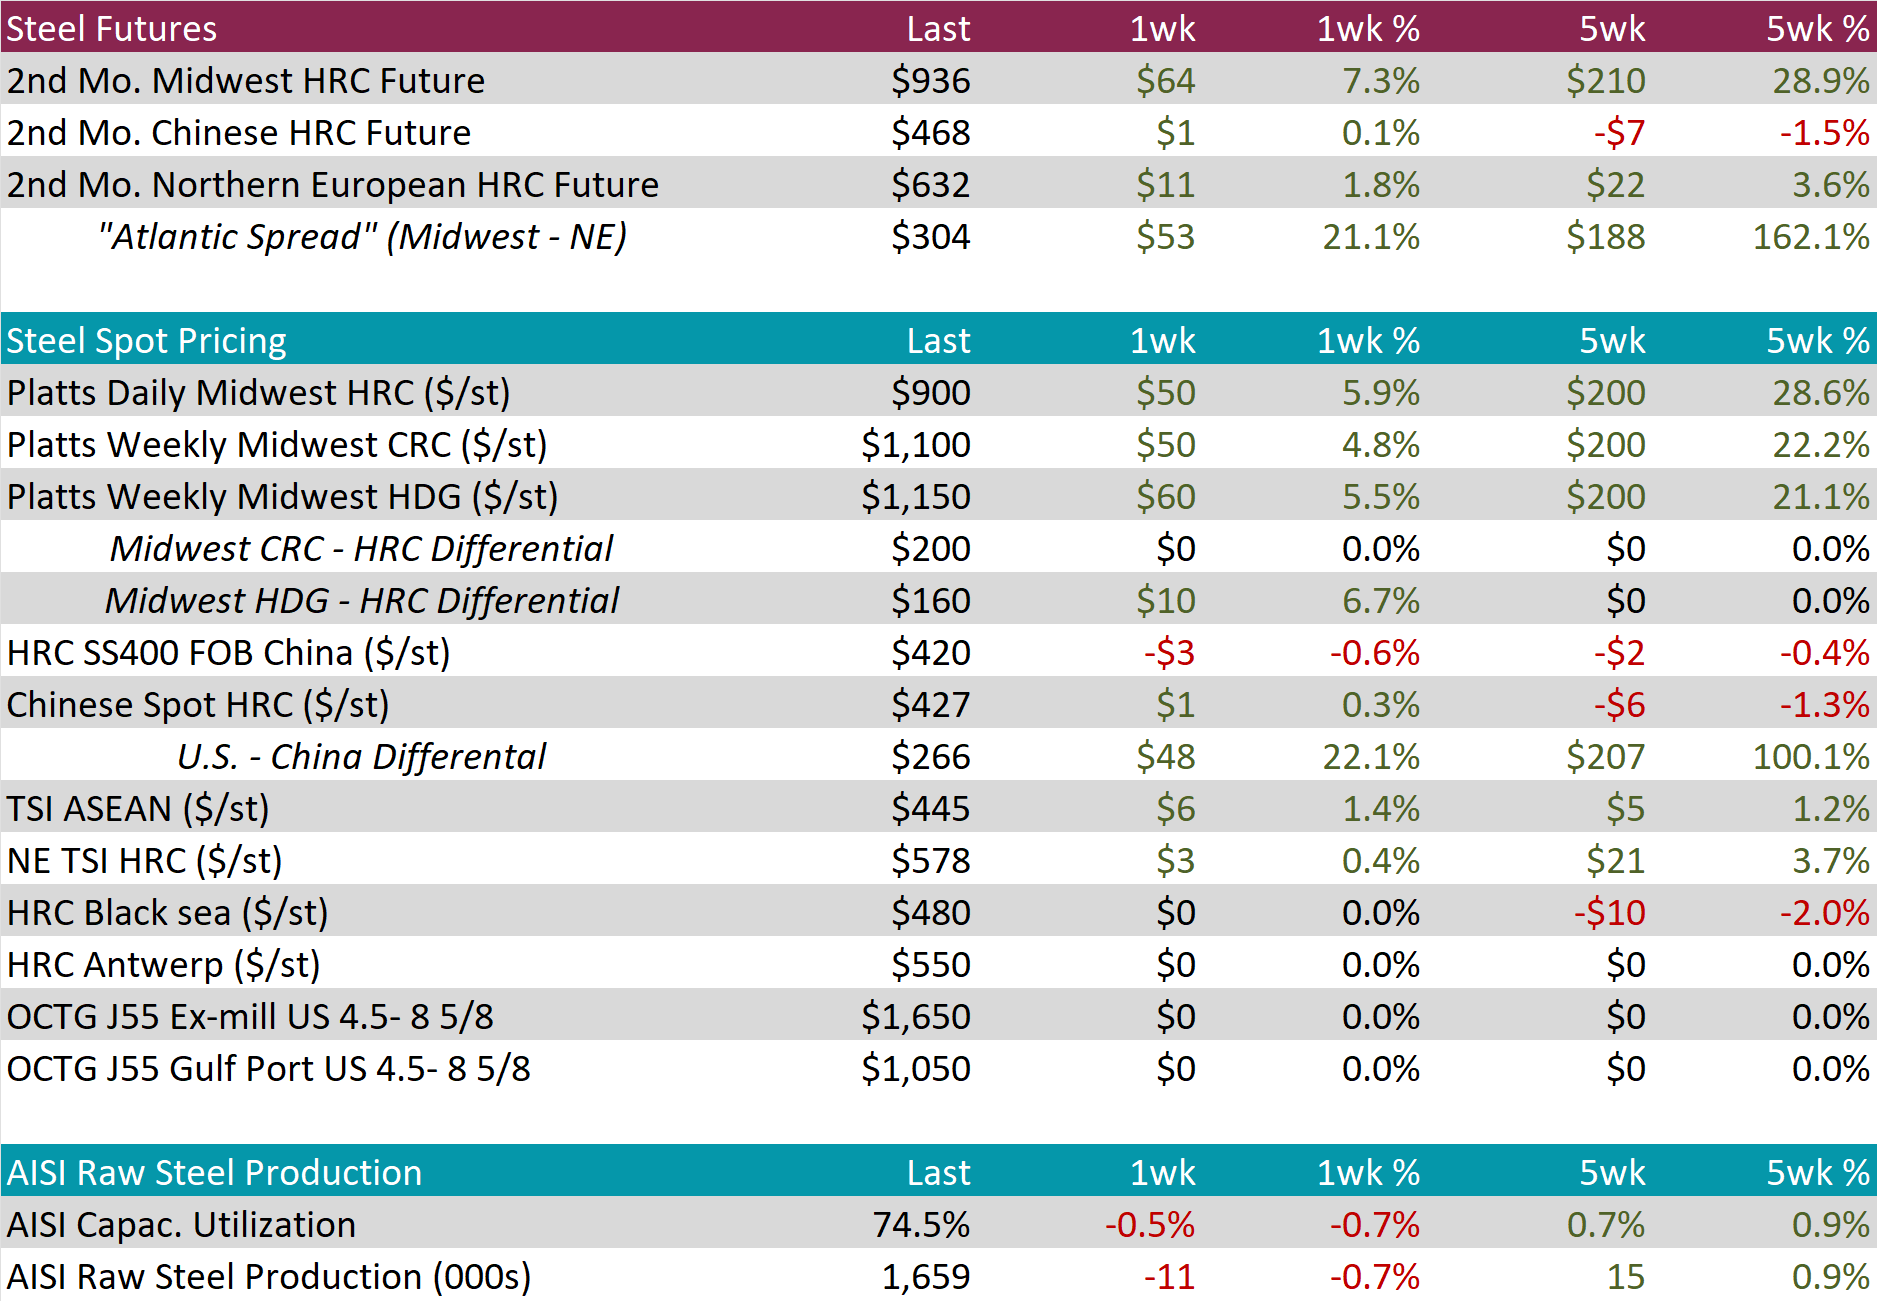
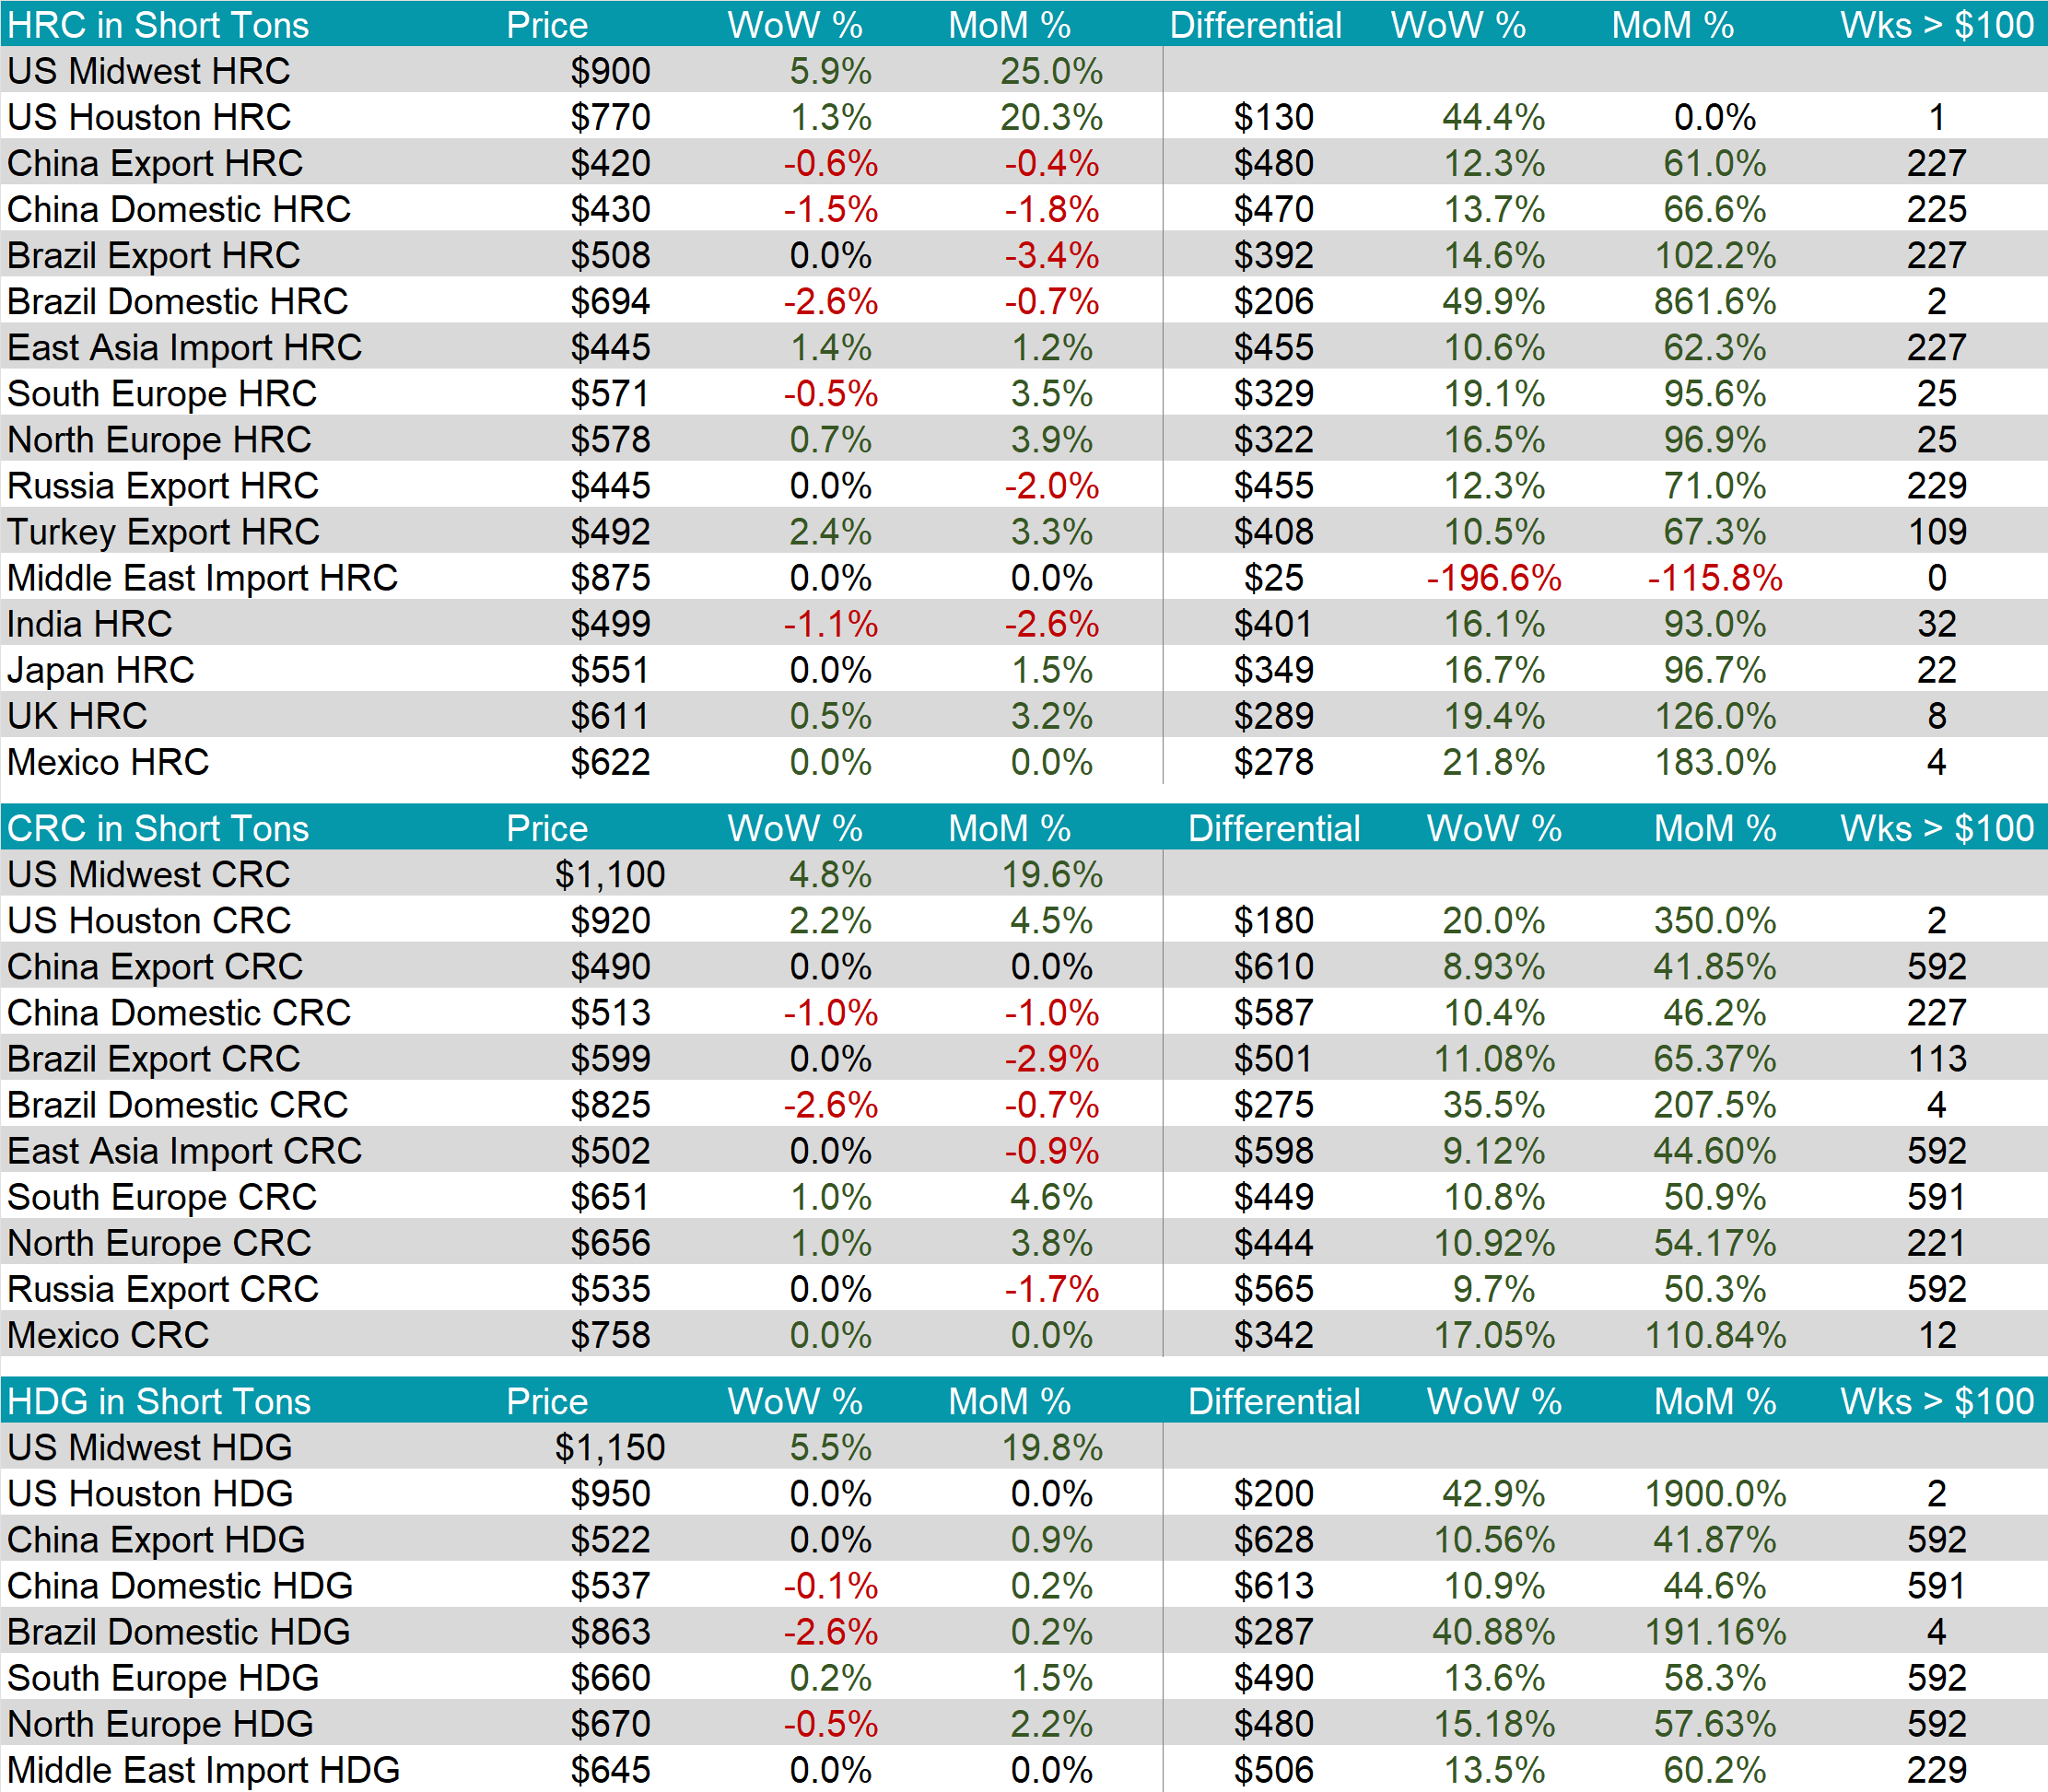
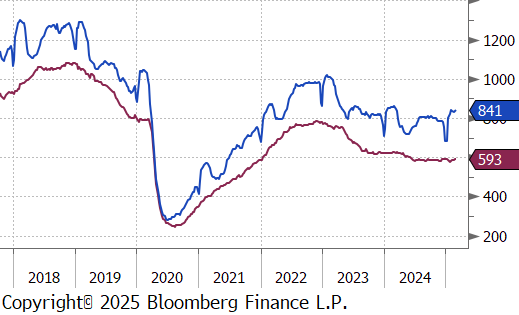
The HRC spot price continued to climb for the sixth consecutive week, this week rising by $50 or 5.9% to $900, reaching the highest price since February 2024. At the same time, the HRC 2nd month future jumped by $64 or 7.3% to $936, the fifth consecutive increase and highest level since January 2024.
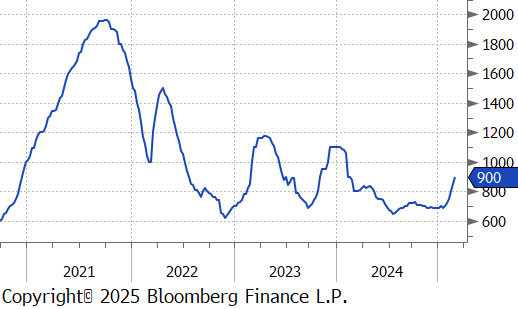
Tandem products both increased, CRC by $5 and HDG by $60, resulting in the HDG – HRC differential to rise by $10 or 6.7% to $160.
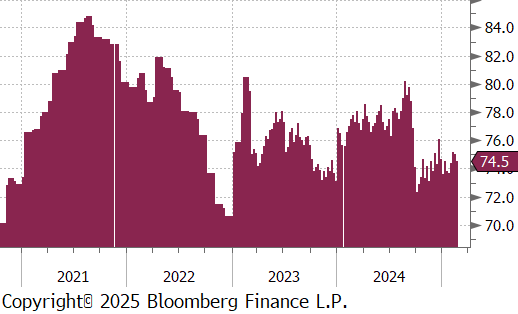
Mill production eased further, with capacity utilization ticking down by -0.5% to 74.5%, bringing raw steel production down to 1.659m net tons.
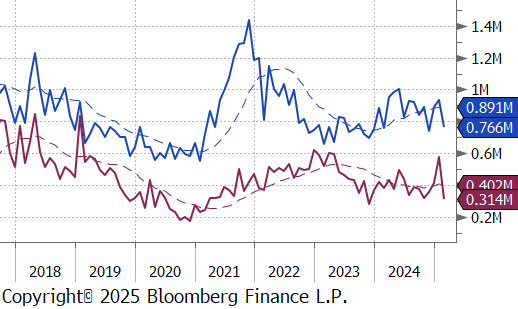
February Projection – Sheet 766k (down 170k MoM); Tube 314k (down 266k MoM)
January Projection – Sheet 935k (up 43k MoM); Tube 580k (up 169k MoM)
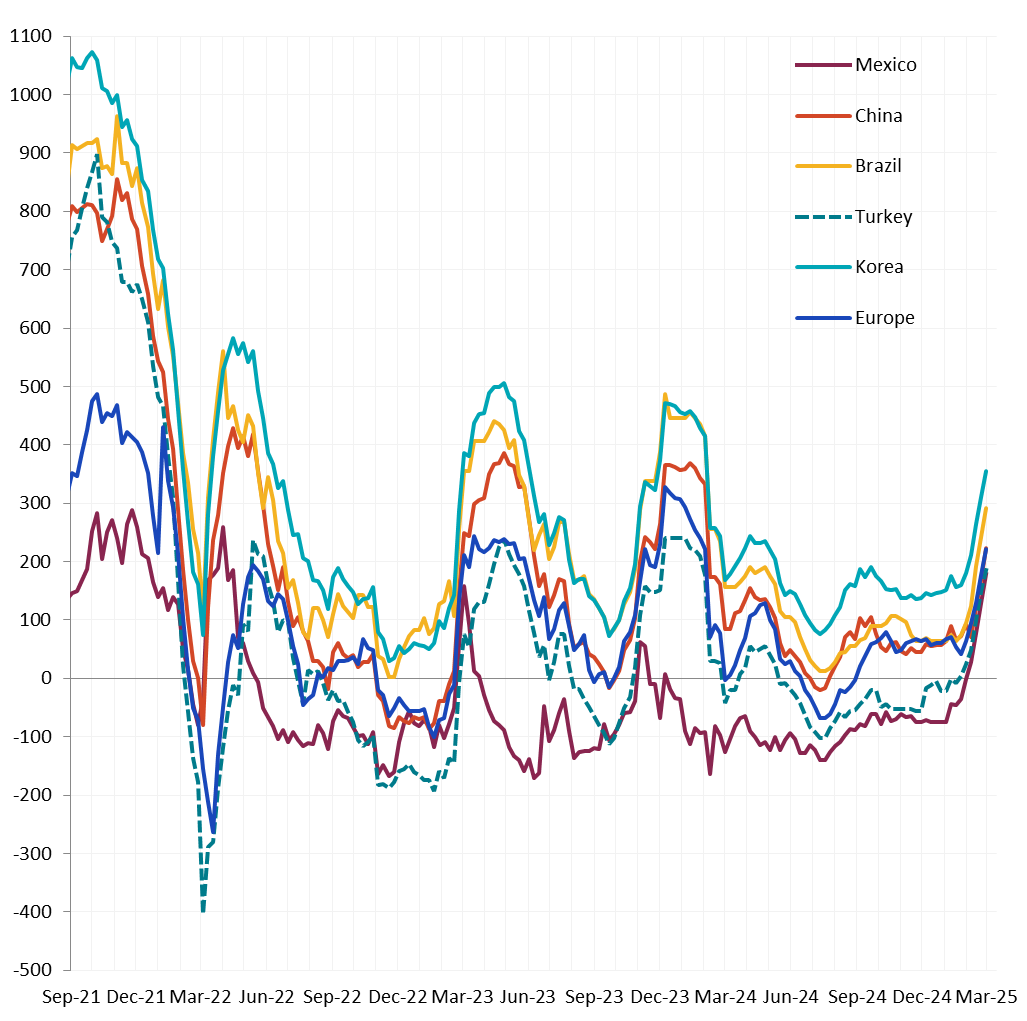
Differentials mainly expanded this week. Notable global price changes were Korea HRC going up by 1.4%, and Turkey Export HRC rising by 2.4%, while China Export HRC fell by -0.6%.
Scrap
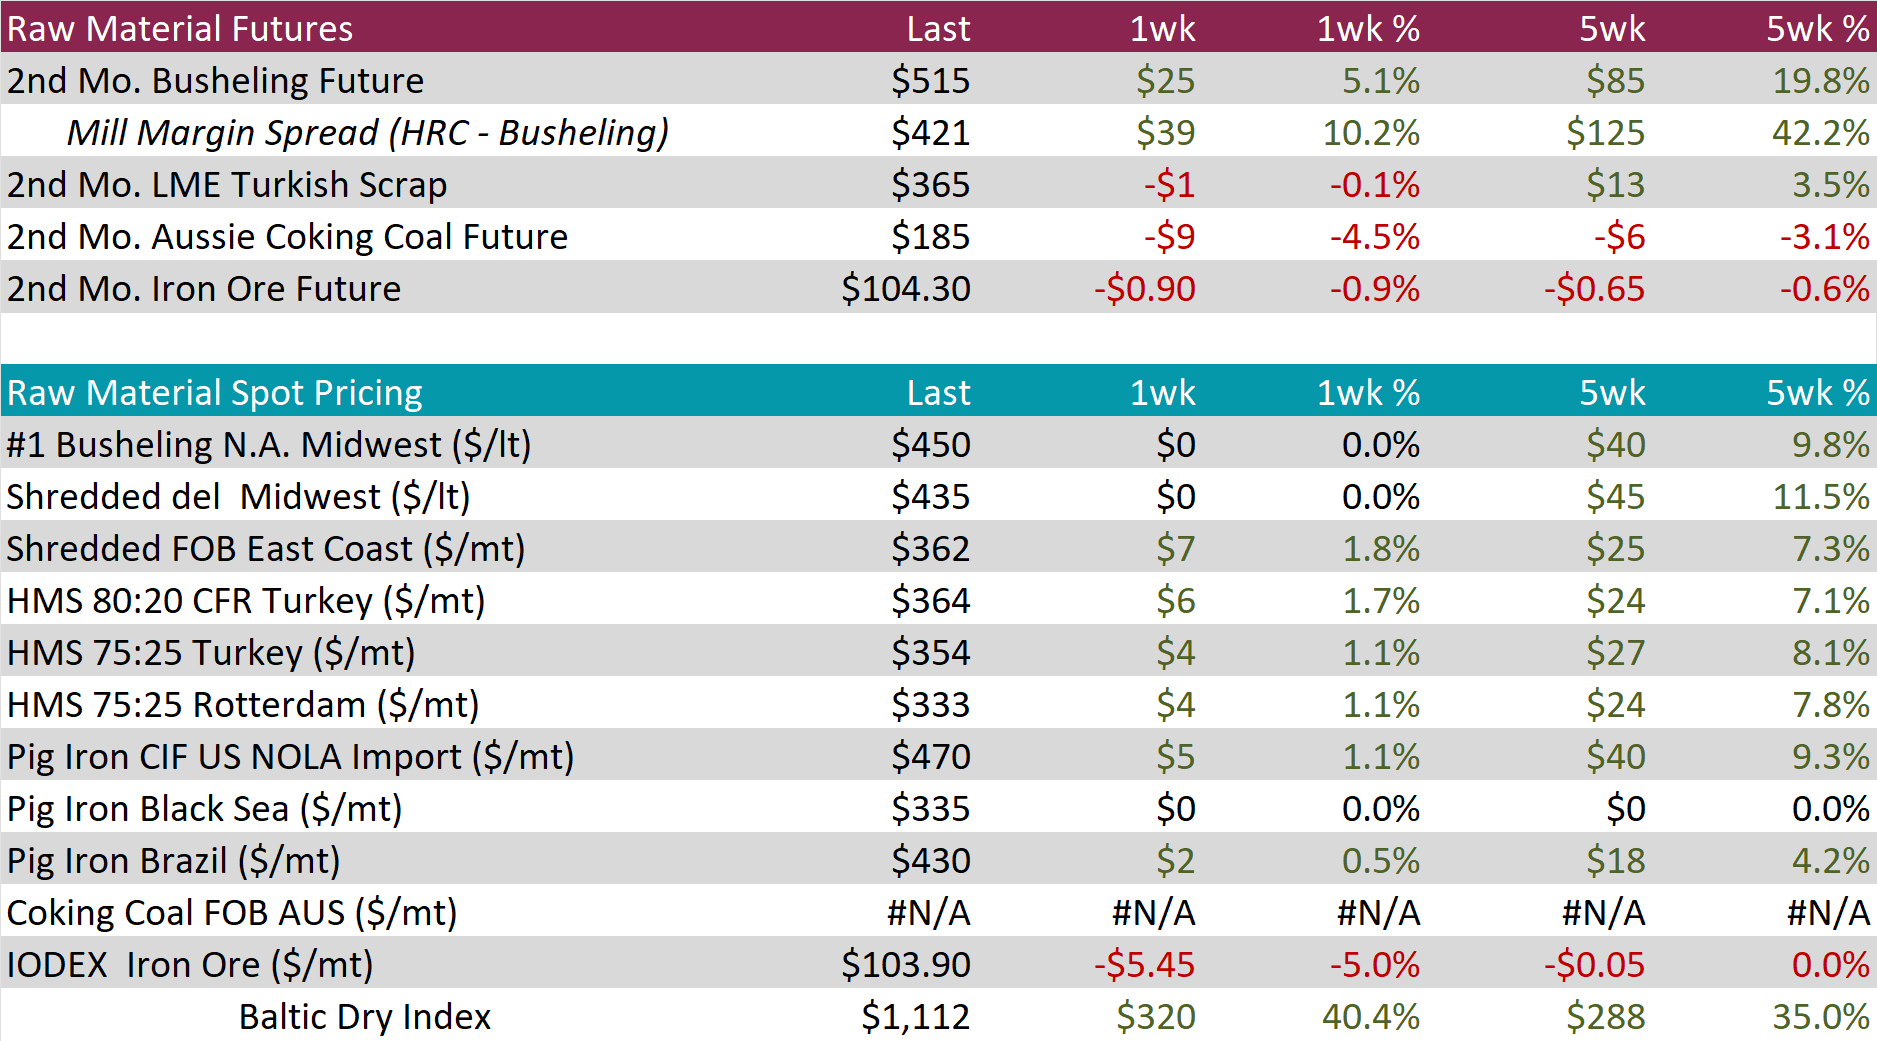
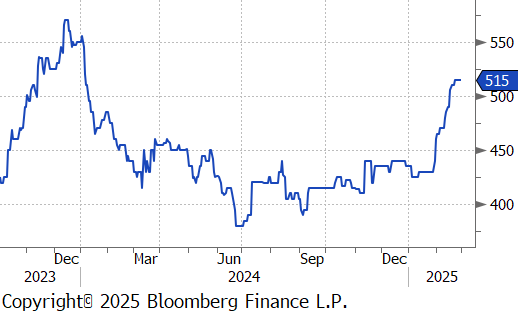
The busheling 2nd month future increased by $25 or 5.1% to $515, hitting the highest level since January 2024.
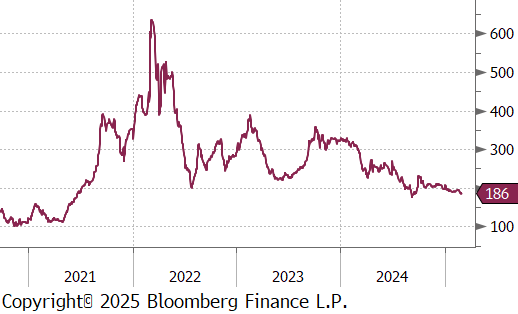
The Aussie coking coal 2nd month future declined by $9 or -4.5% to $185, ending the two consecutive weeks of increases.
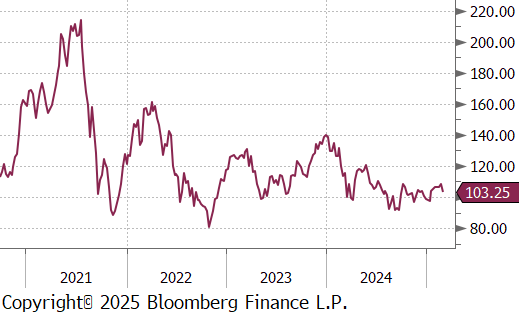
The iron ore 2nd month future edged down by $0.90 or -0.9% to $104.30, falling to the lowest price in six weeks.
Dry Bulk / Freight
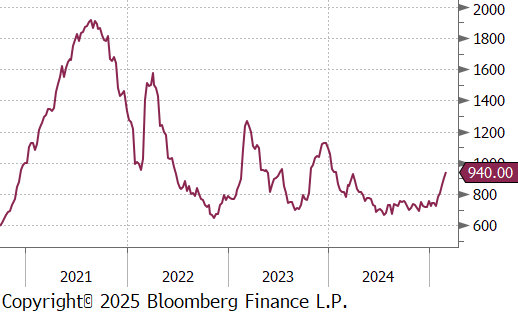
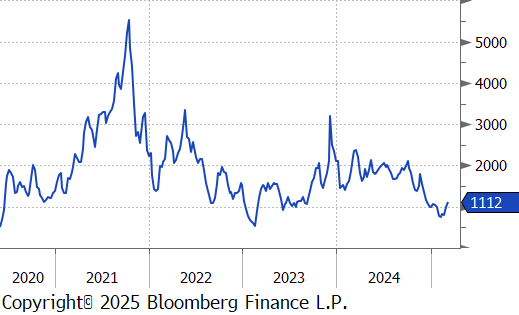
The Baltic Dry Index surged by $320 or 40.4% to $1,112, rising for the second consecutive week and reaching the highest level in twelve weeks.
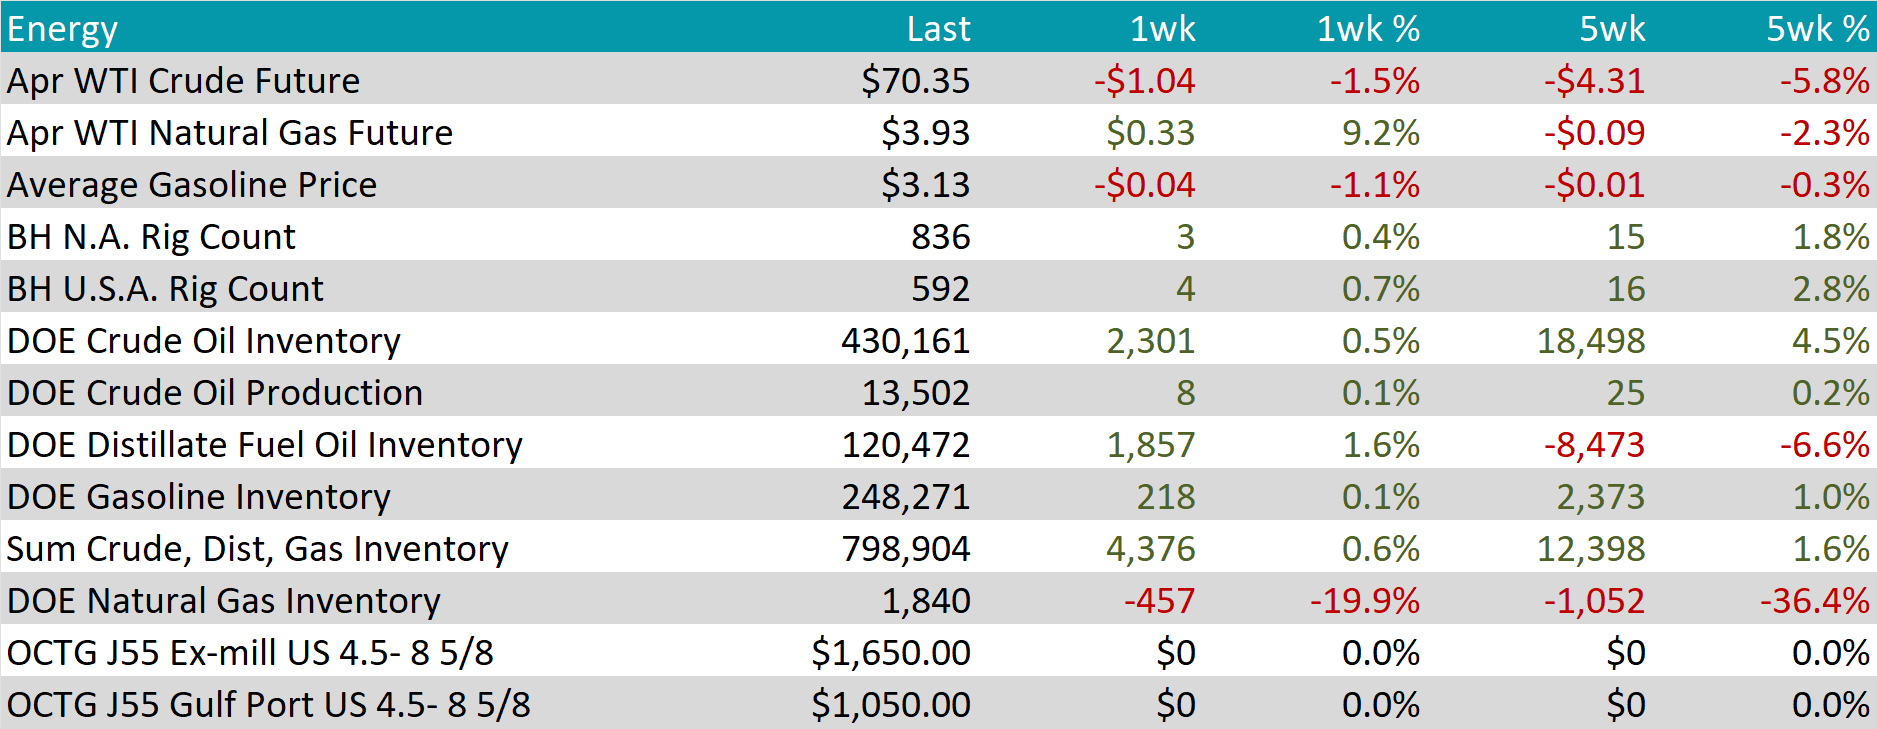
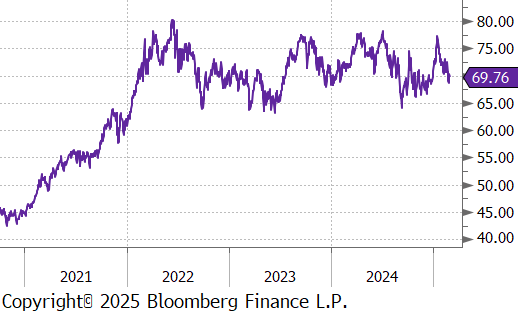
WTI crude oil future lost $1.04 or -1.5% to $70.35/bbl.
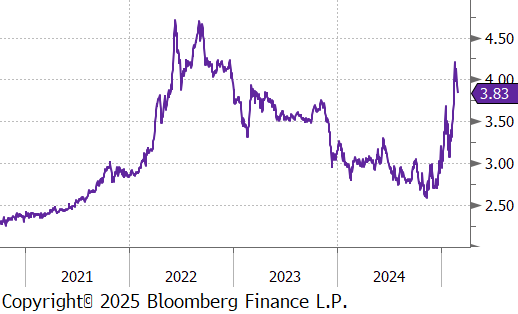
WTI natural gas future gained $0.33 or 9.2% to $3.93/bbl.
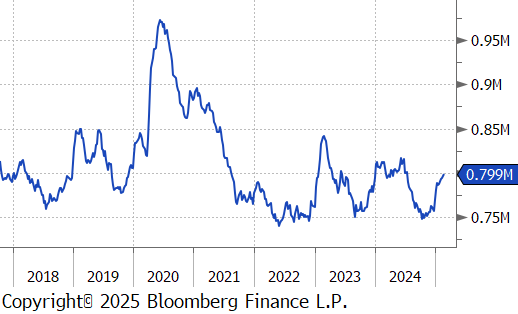
The aggregate inventory level notably increased, rising by 0.6%.
The Baker Hughes North American rig count added 3 rigs, bringing the total count to 836. Similarly, the US rig count increased by 4 rigs, bringing the total count to 592.
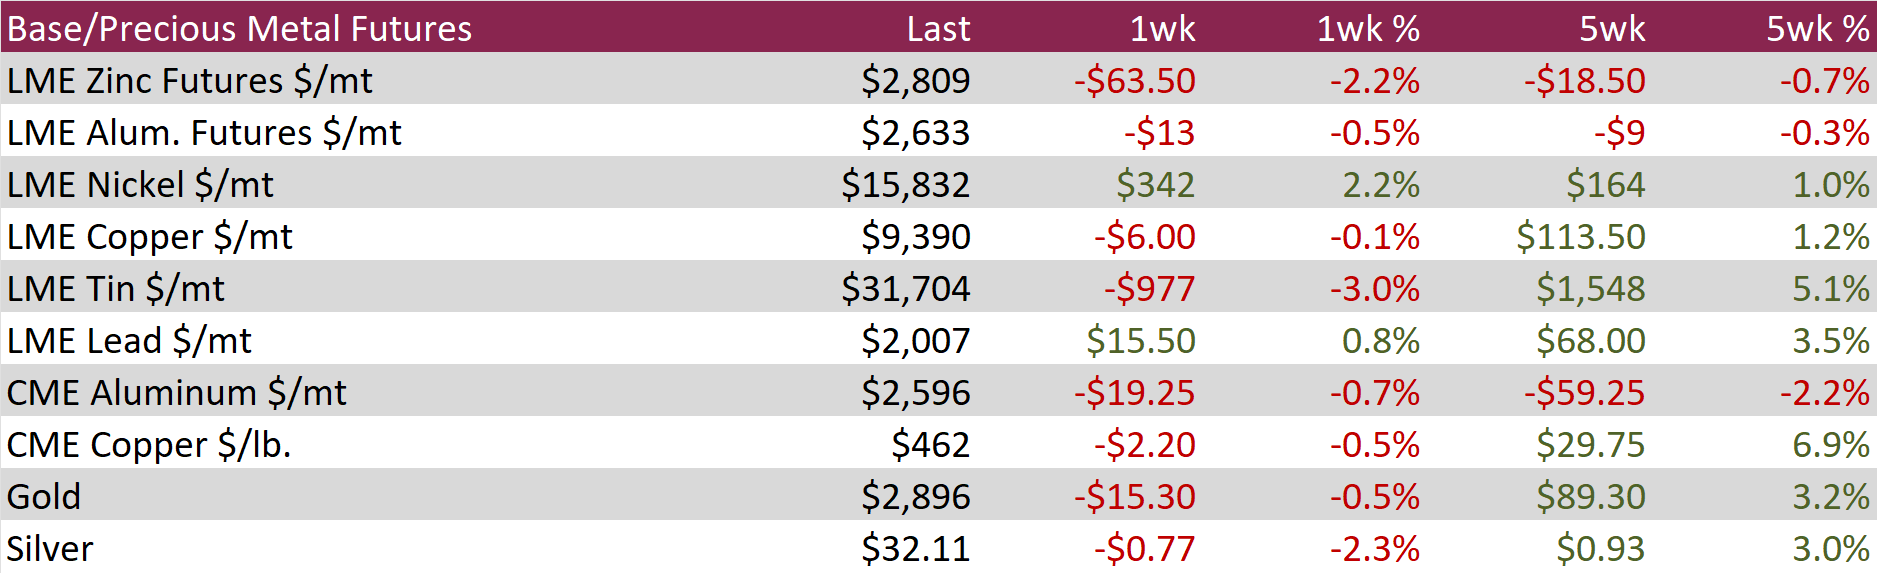
Aluminum futures declined by $13 or -0.5% to $2,633, retreating sharply from the nine-month high of $2,730 reached on February 20th, as signals from the U.S. suggested a potential relaxation of sanctions on Russia, easing fears of supply shortages. The U.S. administration indicated plans to restore economic ties with Russia, driving a 50% surge in Rusal HDRs since mid-February, as investors anticipated the company’s renewed access to export markets. This development comes despite fresh warnings from the European Commission that new sanctions on Russian aluminum remain under consideration. Meanwhile, China produced a record 44 million tons of aluminum in 2024, bringing it close to the government-imposed cap of 45 million tons set in 2017 to curb oversupply and support emissions targets. As a result, production is expected to slow significantly this year, even as Beijing ramps up fiscal stimulus and credit expansion to boost economic growth.
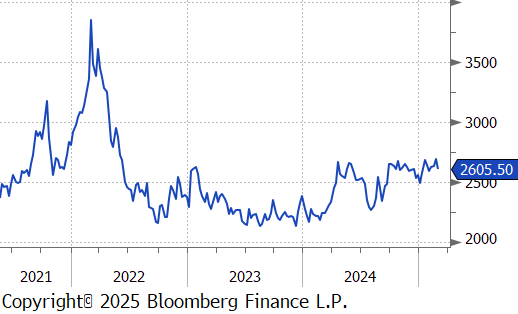
Copper futures decreased by $2.20 or -0.5% to $462. President Donald Trump launched an investigation into possible tariffs on copper imports, prompting traders to anticipate levies by the end of the year. The administration has already moved forward with immediate tariffs on other base metals, including aluminum. If enacted, copper tariffs would further increase reliance on domestic production, which remains constrained, with the U.S. dependent on imports for nearly half of its copper supply. Meanwhile, in China, supply conditions remained loose. Treatment charges for Chinese smelters remained below zero, signaling persistent overcapacity in refined copper production. Copper inventories continued to rise, surpassing 270,000 tonnes—three times the levels recorded at the start of the year.
Precious Metals
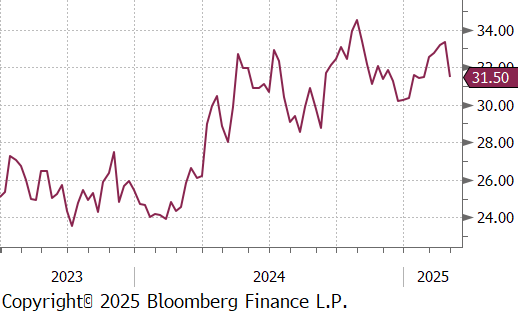
Silver dropped by $0.77 or -2.3% to $32.11. President Donald Trump confirmed that tariffs on Canadian and Mexican imports would take effect Tuesday, alongside an additional 10% duty on Chinese shipments, bringing cumulative tariffs on Chinese goods to 20%. In response, reports suggested Beijing was preparing retaliatory measures against U.S. imports, fueling market uncertainty. Meanwhile, supply and demand dynamics remained mixed. Hecla Mining, the largest U.S. silver producer, reported a 13% increase in silver output for 2024, reaching 16.2 million ounces—the second-highest production level in its 134-year history. However, demand signals were weaker, with U.S. silver coin purchases falling 27% year-over-year in January to 3.5 million ounces, marking the lowest January sales since 2018.
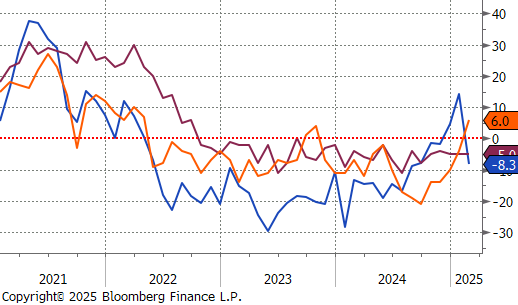
The last three of the February Fed Manufacturing Surveys were mixed. Both the Dallas and Kansas City index fell short of forecasts, -8.3 vs 6.4 and -5 vs -4, respectively. However, the Richmond index exceeded the anticipated -3 print and increased to 6. While the manufacturing sector is improving, these results indicate it will be a bumpy path. Additionally, Durable Goods New Orders rose to 3.1%, above the expected increase by 2%. This was driven primarily by activity in the transportation sector, with the ex. Transportation portion coming in unchanged this month, below the expected slight increase of 0.3%
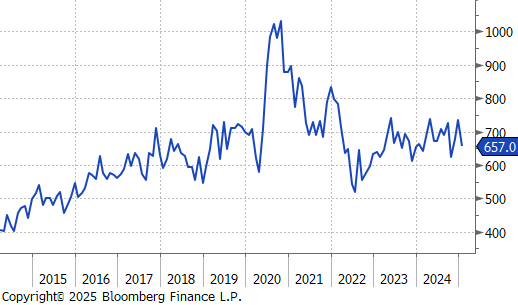
Housing data disappointed this week. January’s New Homes Sales missed market expectations, 657k vs 680k, and so did Pending Home Sales NSA YoY, coming in at -5.2% in January vs -1.1%. Additionally, housing prices indicated a pick-up, with S&P CoreLogic CS 20-City YoY index growing by 4.5%, surpassing the anticipated 4.4% increase and up from November’s 4.3%. The housing sector continues to be dampened by high mortgage rates and affordability issues.
The second revision of 4Q24 GDP showed no change to the topline figure at 2.3% growth QoQ, while Personal Consumption increased to 4.2% from 4.1%.
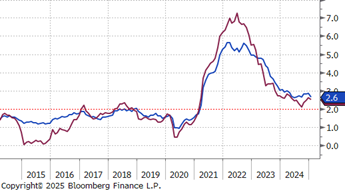
Inflation data came in line with expectations with Core PCE (ex Food & Energy) YoY declining to 2.6% and Topline PCE declining to 2.5%, also in line with expectations. FED speakers continue to express that they will be taking a cautious approach with interest rate policy in the coming months. Our view on how we expect the economy to unfold leads us to believe there will be zero interest rate cuts this year.