Flack Capital Markets | Ferrous Financial Insider
February 9, 2024 – Issue #418
February 9, 2024 – Issue #418
Overview:

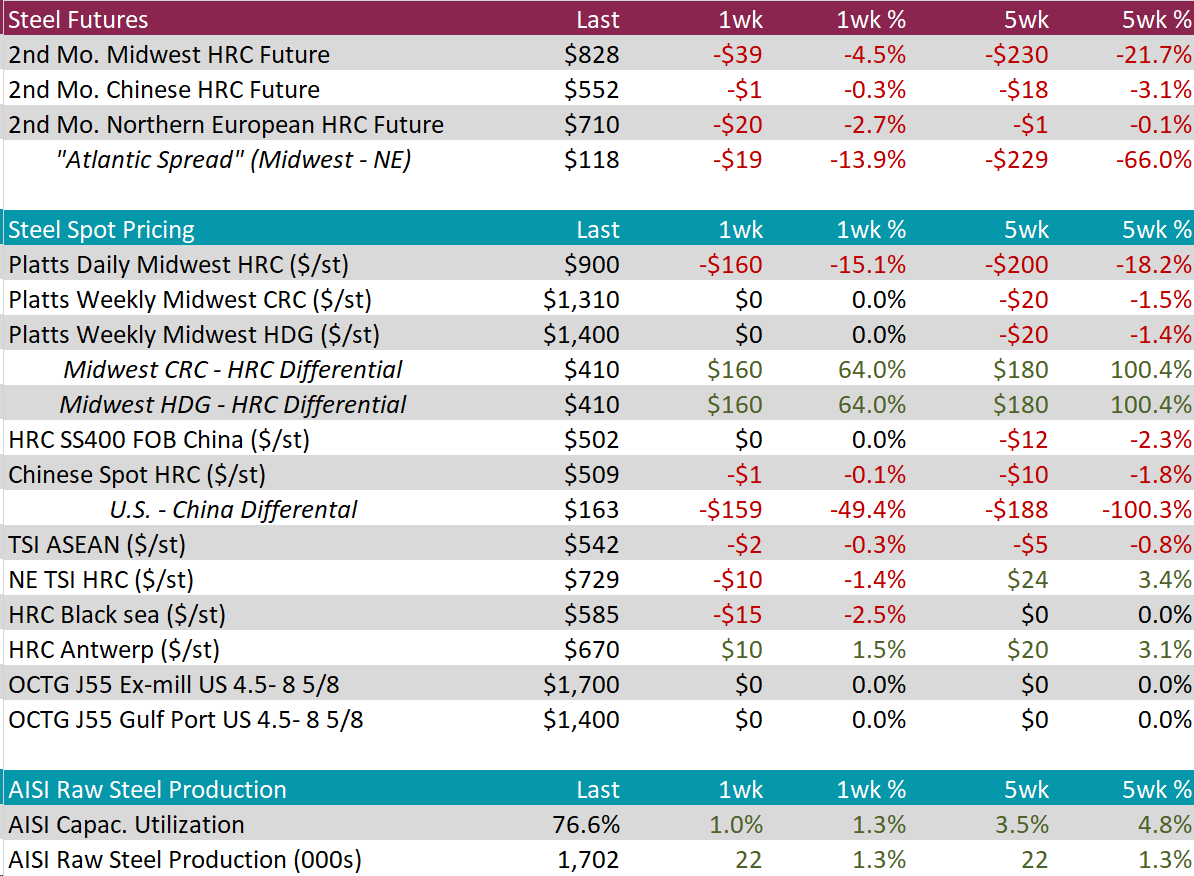
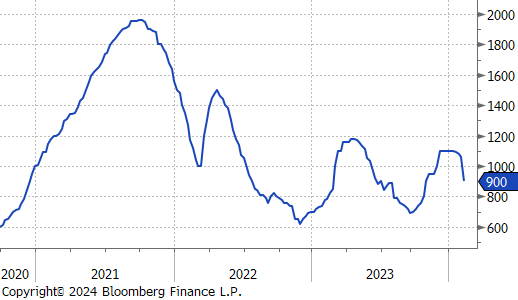
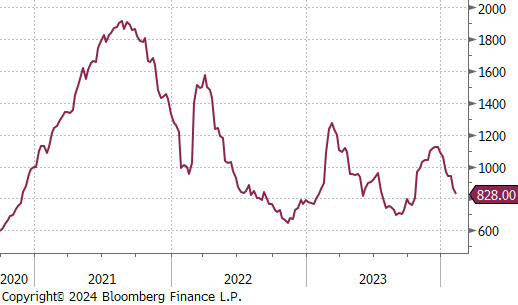
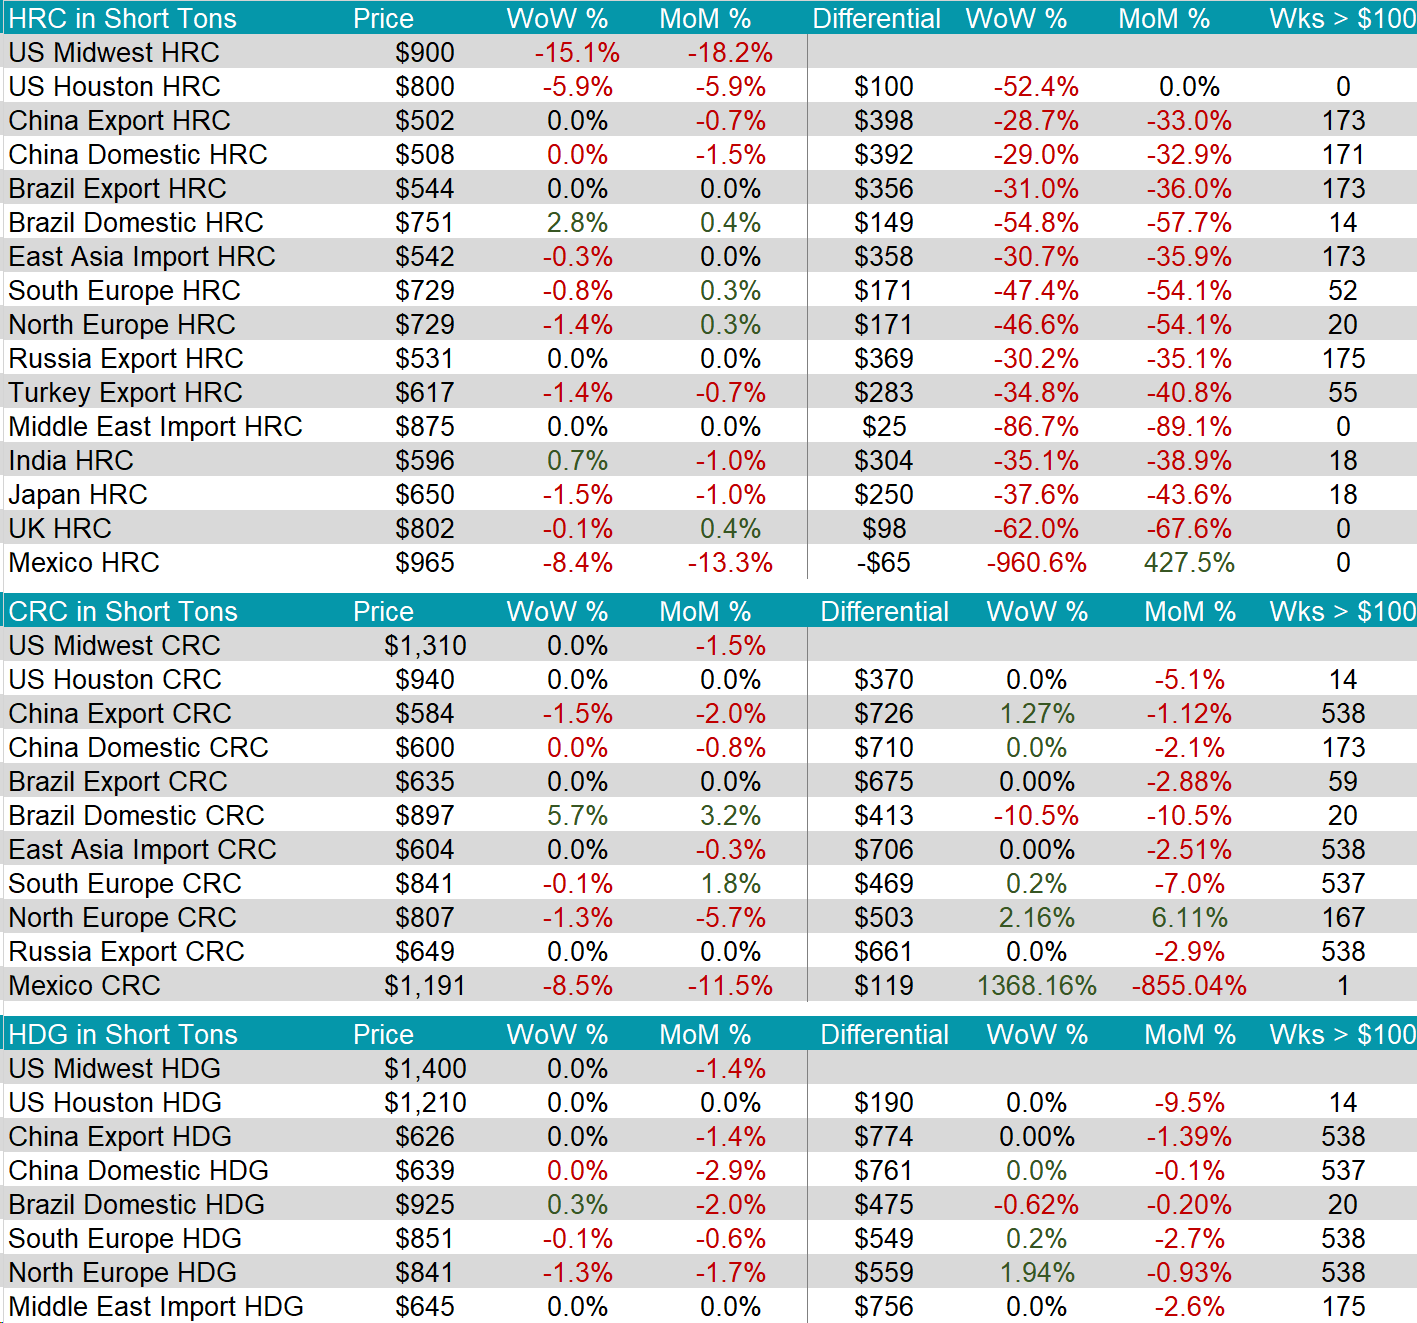
The HRC spot price plunged down by $160 or -15.1% to $900, marking a $200 price decline since reaching its price high 4-weeks ago. At the same time, the 2nd month future fell by $39 or -4.5% to $828, reaching its lowest level since October 2023.
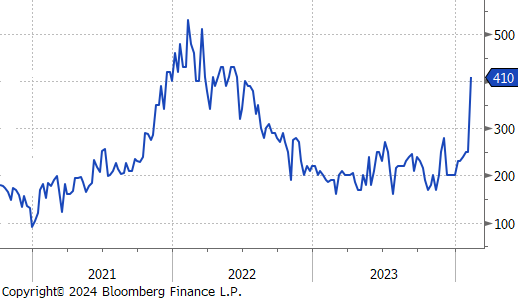
Tandem products both remained unchanged, resulting in the HDG – HRC differential to jump up by $160 or 64.0% to $410, a level not seen since mid-2022.
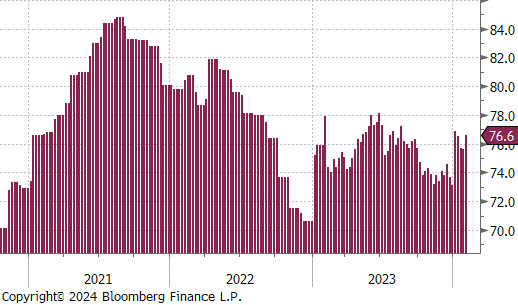
Mill production ticked slightly up, yet continues to remain rather subdued, with capacity utilization increasing by 1.0% to 76.6%, bringing raw steel production up to 1.702m net tons.
February Projection – Sheet 897k (up 87k MoM); Tube 782k (up 427k MoM)
January Projection – Sheet 811k (up 58k MoM); Tube 354k (down 17k MoM)
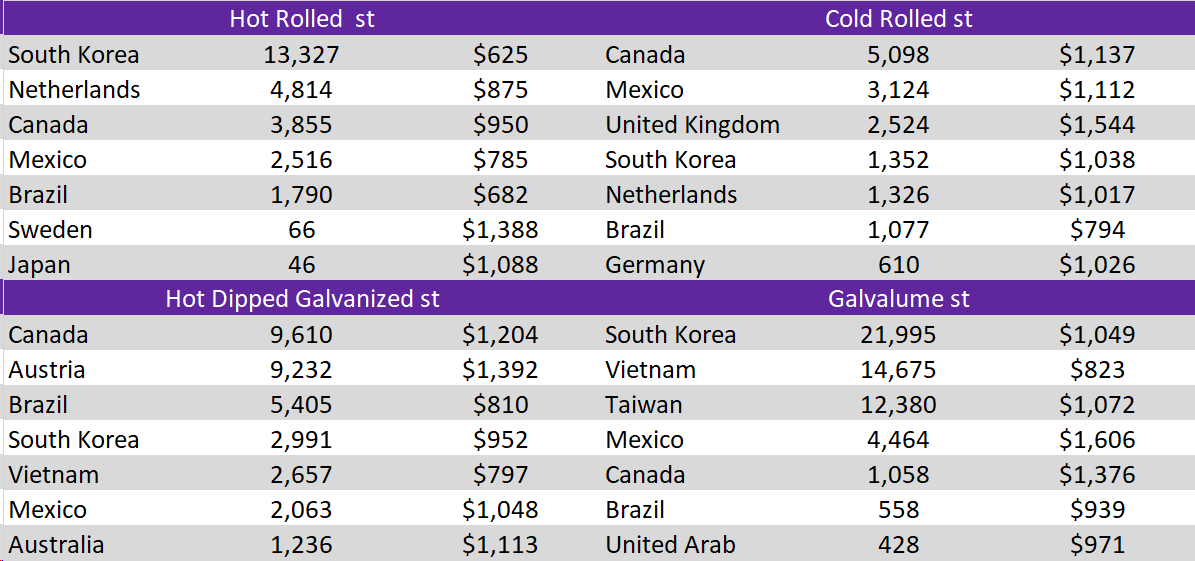
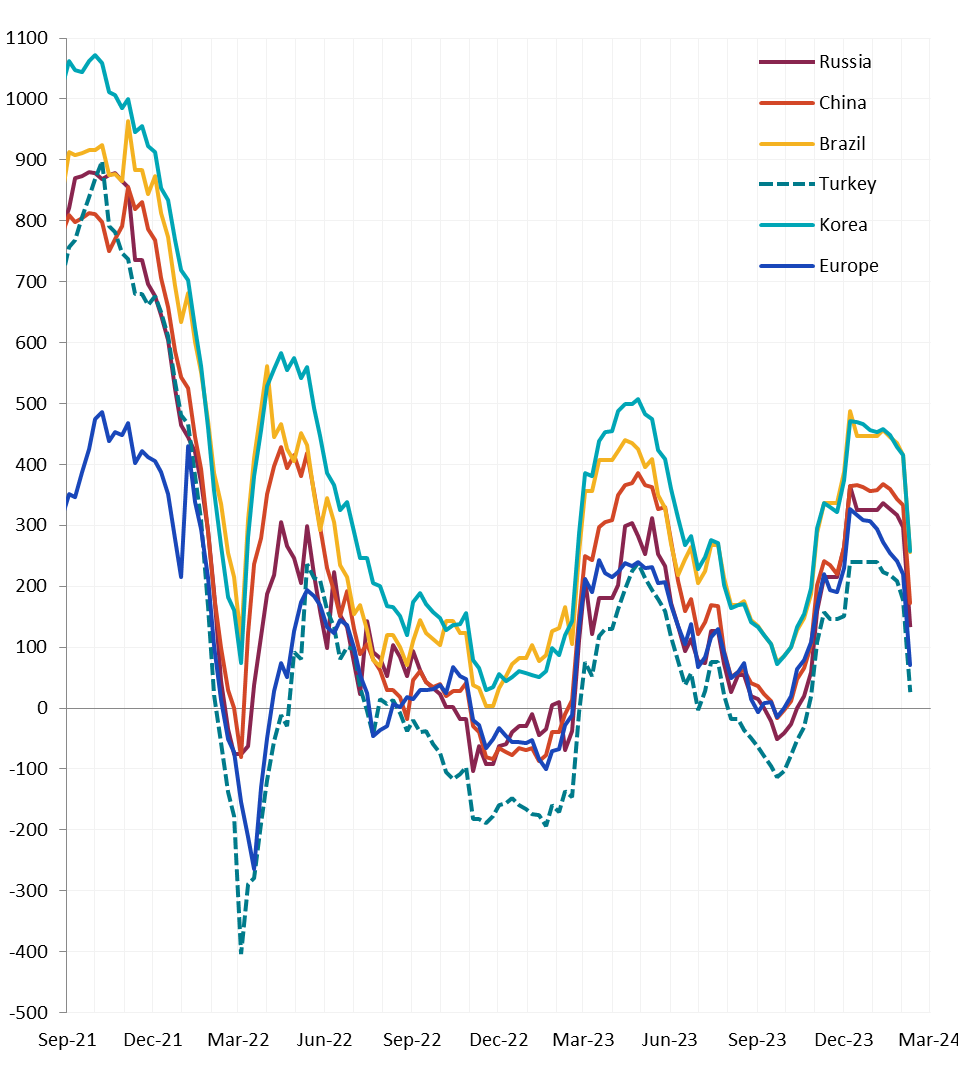
All watched global differentials declined this week, with all global prices declining or remaining unchanged except for the Brazil Domestic HRC and the India HRC, increasing by 2.8% and 0.7%, respectively.

Scrap
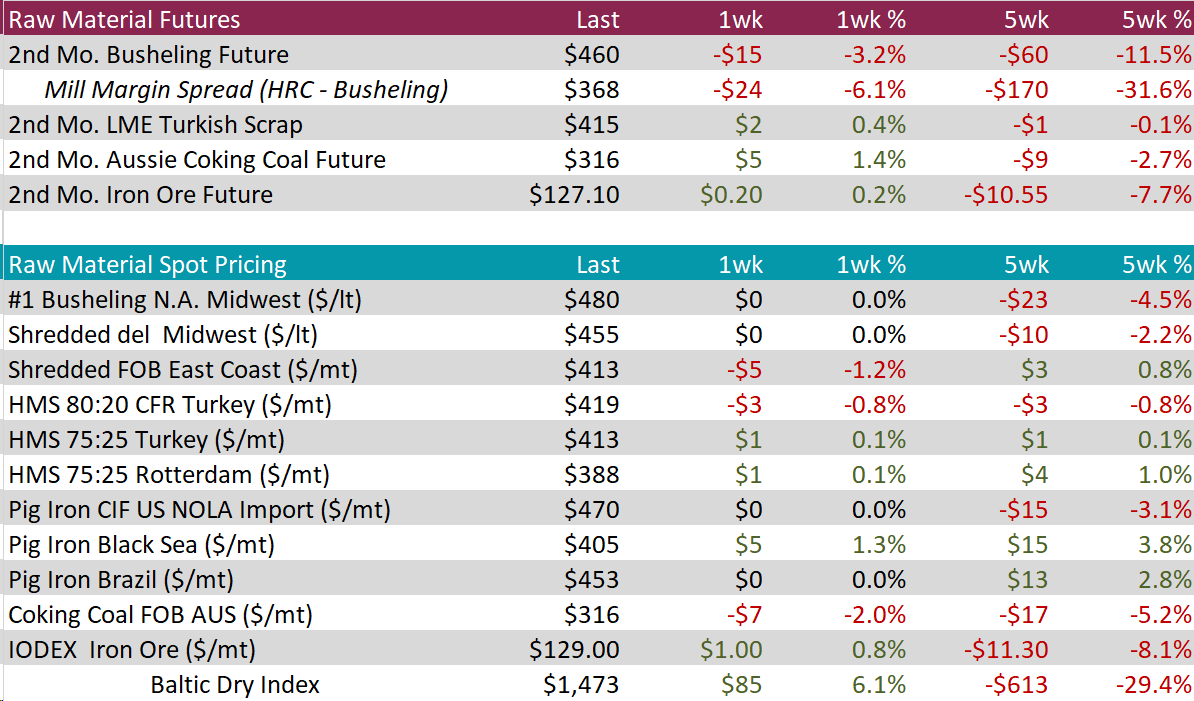
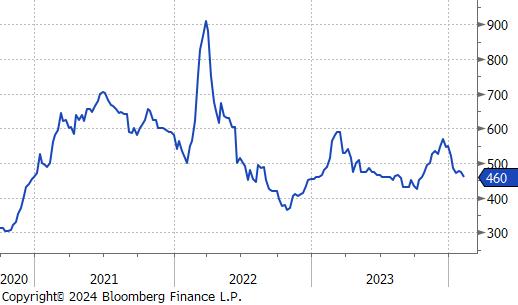
The 2nd month busheling future fell by $15 or -3.2% to $460, resulting in the 5-week price change to fall by $60 or -11.5%. Meanwhile, the busheling spot price remained stagnant at $480.
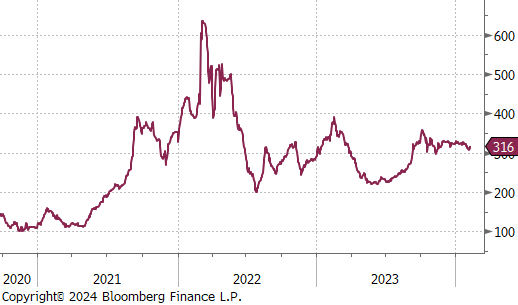
The Aussie coking coal 2nd month future rose by $5 or 1.4% to $316, continuing to remain elevated just above the $300 price level.
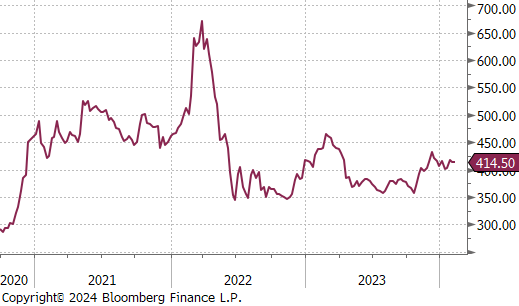
The LME Turkish scrap 2nd month future slightly increased this week, rising by $2 or 0.4% to $415, continuing to fluctuate just above the $400 price level.
Dry Bulk / Freight
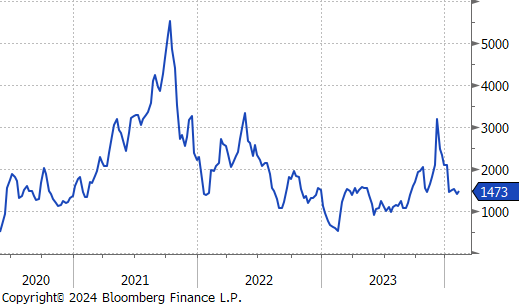
The Baltic Dry Index ticked up by $85 or 6.1% to $1,473, continuing to level off and steady from its recent significant price drop.
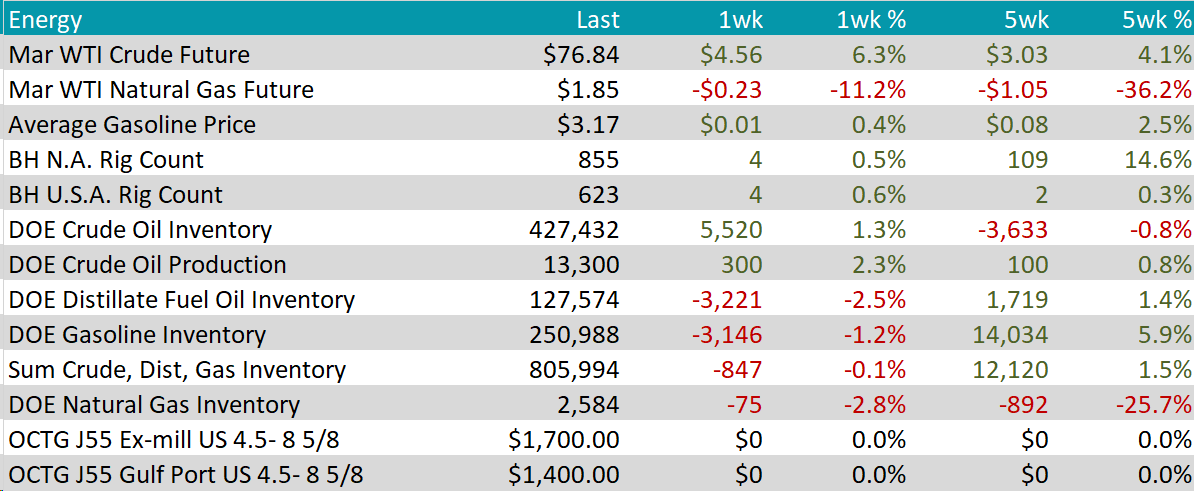
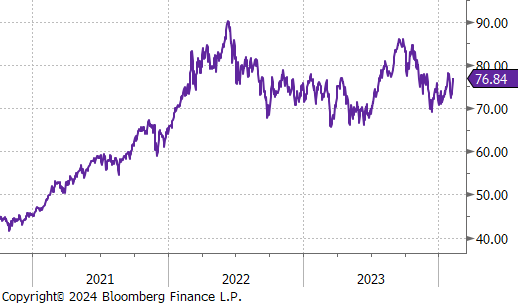
WTI crude oil future gained $4.65 or 6.3% to $76.84/bbl.
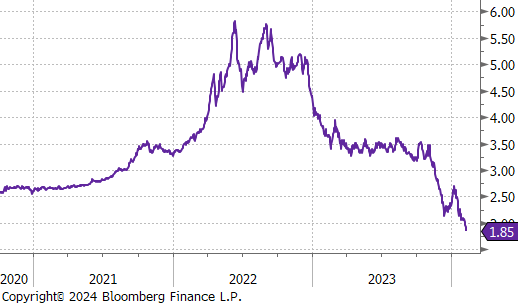
WTI natural gas future lost $0.23 or -11.2% to $1.85/bbl, hitting its lowest price since July 2020.
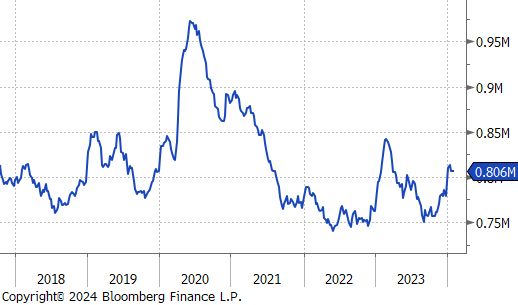
The aggregate inventory level experience a slight decline, falling by 0.1%.
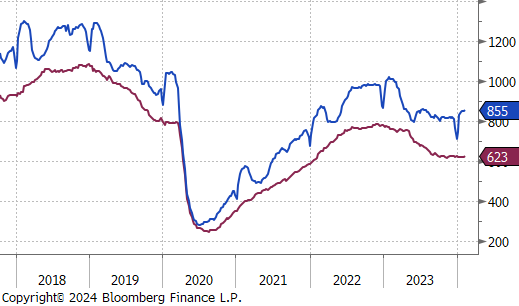
The Baker Hughes North American rig count and the US rig count both gained 4 rig, bringing the NA count to 855 rigs and the US count to 623 rigs.
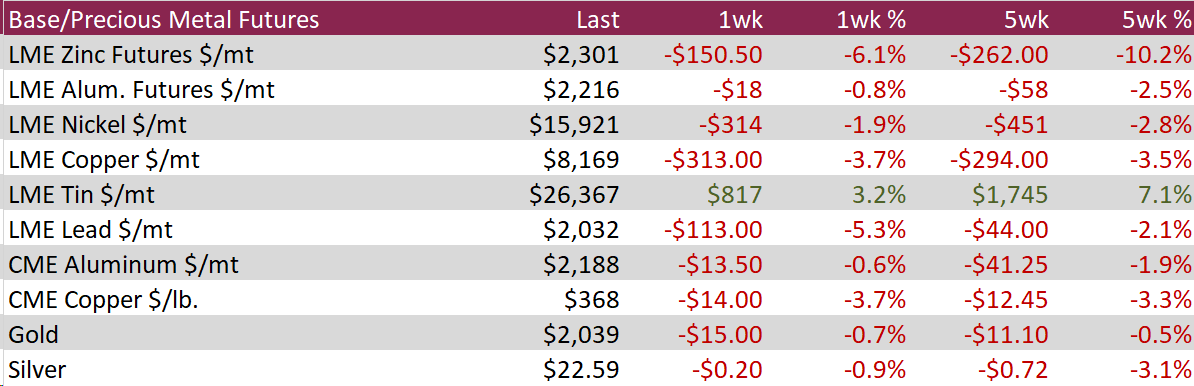
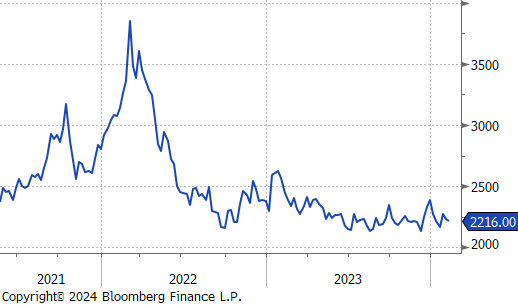
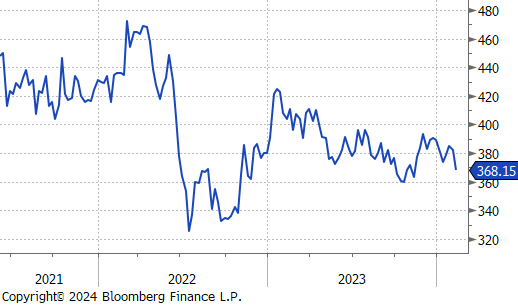
Aluminum fell by $18 or -0.8% to $2,216, and Copper fell by $14 or -3.7% to $368, reaching their lowest point in almost three months, with a decline of over 5% since the beginning of the month. This decrease was influenced by a robust US dollar and a gloomy outlook for industrial activities in China, the world’s leading consumer of copper. Economic challenges in China have negatively impacted base metals demand. The country experienced an unexpected surge in deflation to its highest level in 14 years and reported a fourth consecutive monthly decline in manufacturing activity in January. This trend aligns with the ongoing drop in the Yangshan copper premium, indicating reduced purchases by factories as copper stockpiles in major Chinese warehouses have risen sharply, by more than 120% year-to-date, to almost 70,000 tonnes. Furthermore, strong US economic data has strengthened the dollar, the currency in which copper futures are priced. This has made copper more expensive for key importers and increased benchmark borrowing costs, further dampening the demand for industrial metals.
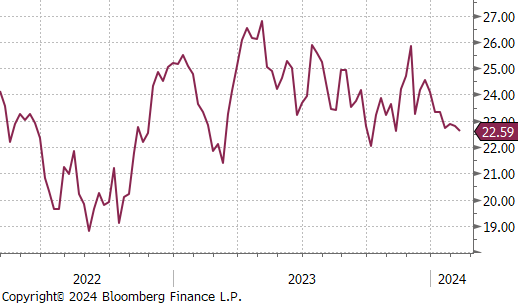
Silver fell by $0.20 or -0.9% to $22.59, hitting a new near-term low, as expectations for immediate Federal Reserve rate cuts diminished. This shift in sentiment followed comments from Fed Chair Powell and other officials, who emphasized that any easing of monetary policy would be gradual and unlikely to start in March. The outlook was further influenced by stronger-than-expected US jobs and services data, suggesting that borrowing costs could remain high until late spring. This scenario lessened the attractiveness of non-yielding assets like silver. However, silver found some support in the anticipation of additional measures from authorities to boost China, its largest consumer, and in the prospects of rising demand throughout the year. The Silver Institute’s latest forecast predicts global silver demand will reach 1.2 billion ounces in 2024, marking the second-highest demand level ever, driven by industrial consumption.
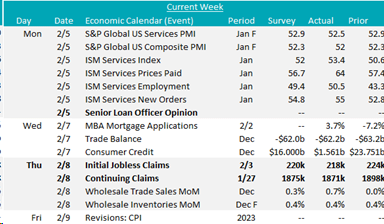
One of the more interesting releases was the 4Q23 SLOOS (Senior Loan Officer Opinion survey) which showed that there was an increased willingness for banks to lend compared to 3Q23. While financial conditions remain tight, this is an early indication that major contagion risk in the banking sector has eased. It is also important to consider the fact the problems at NYBC became public after this data had been collected.
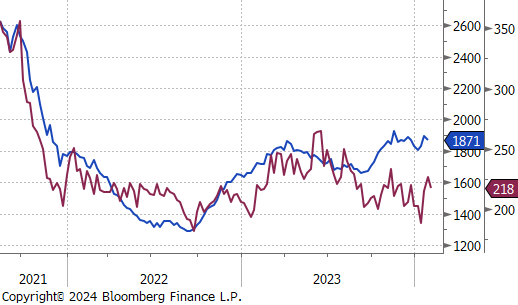
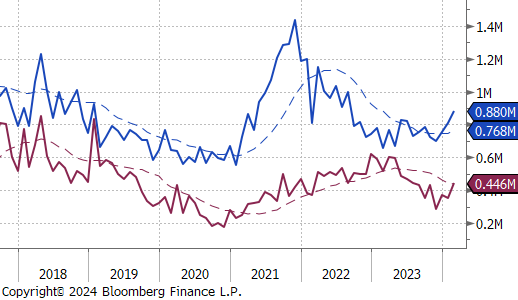
Initial and continuing jobless claims both printed slightly down and came in below expectations as well, 218k versus 220k, and 1,871k versus 1,875k, respectively. The real time data continues to show a resilient labor market. However, the coming months will be a significant test, we will be closely watching how the recent flurry of announced layoffs and still elevated job openings balance each other out.
Finally, revisions to 2023 CPI (Consumer Price Index) showed very little change, slightly emboldening the trending recent disinflationary pressure on the core index.
One ongoing trend of note is the changing expectations around topline economic growth. After the upside surprise in labor market report from last week and this week’s better than expected ISM Services PMI (among other releases), the Atlanta Fed GDPNow tracker is currently forecasting a 1Q24 GDP print of 3.4%. This is significantly above economist expectations with the median survey currently around 1.4%, up from 0.9% over 1 month ago.