Flack Capital Markets | Ferrous Financial Insider
January 17, 2025 – Issue #467
January 17, 2025 – Issue #467
Overview:
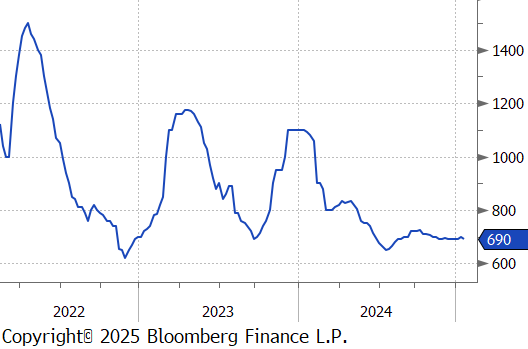
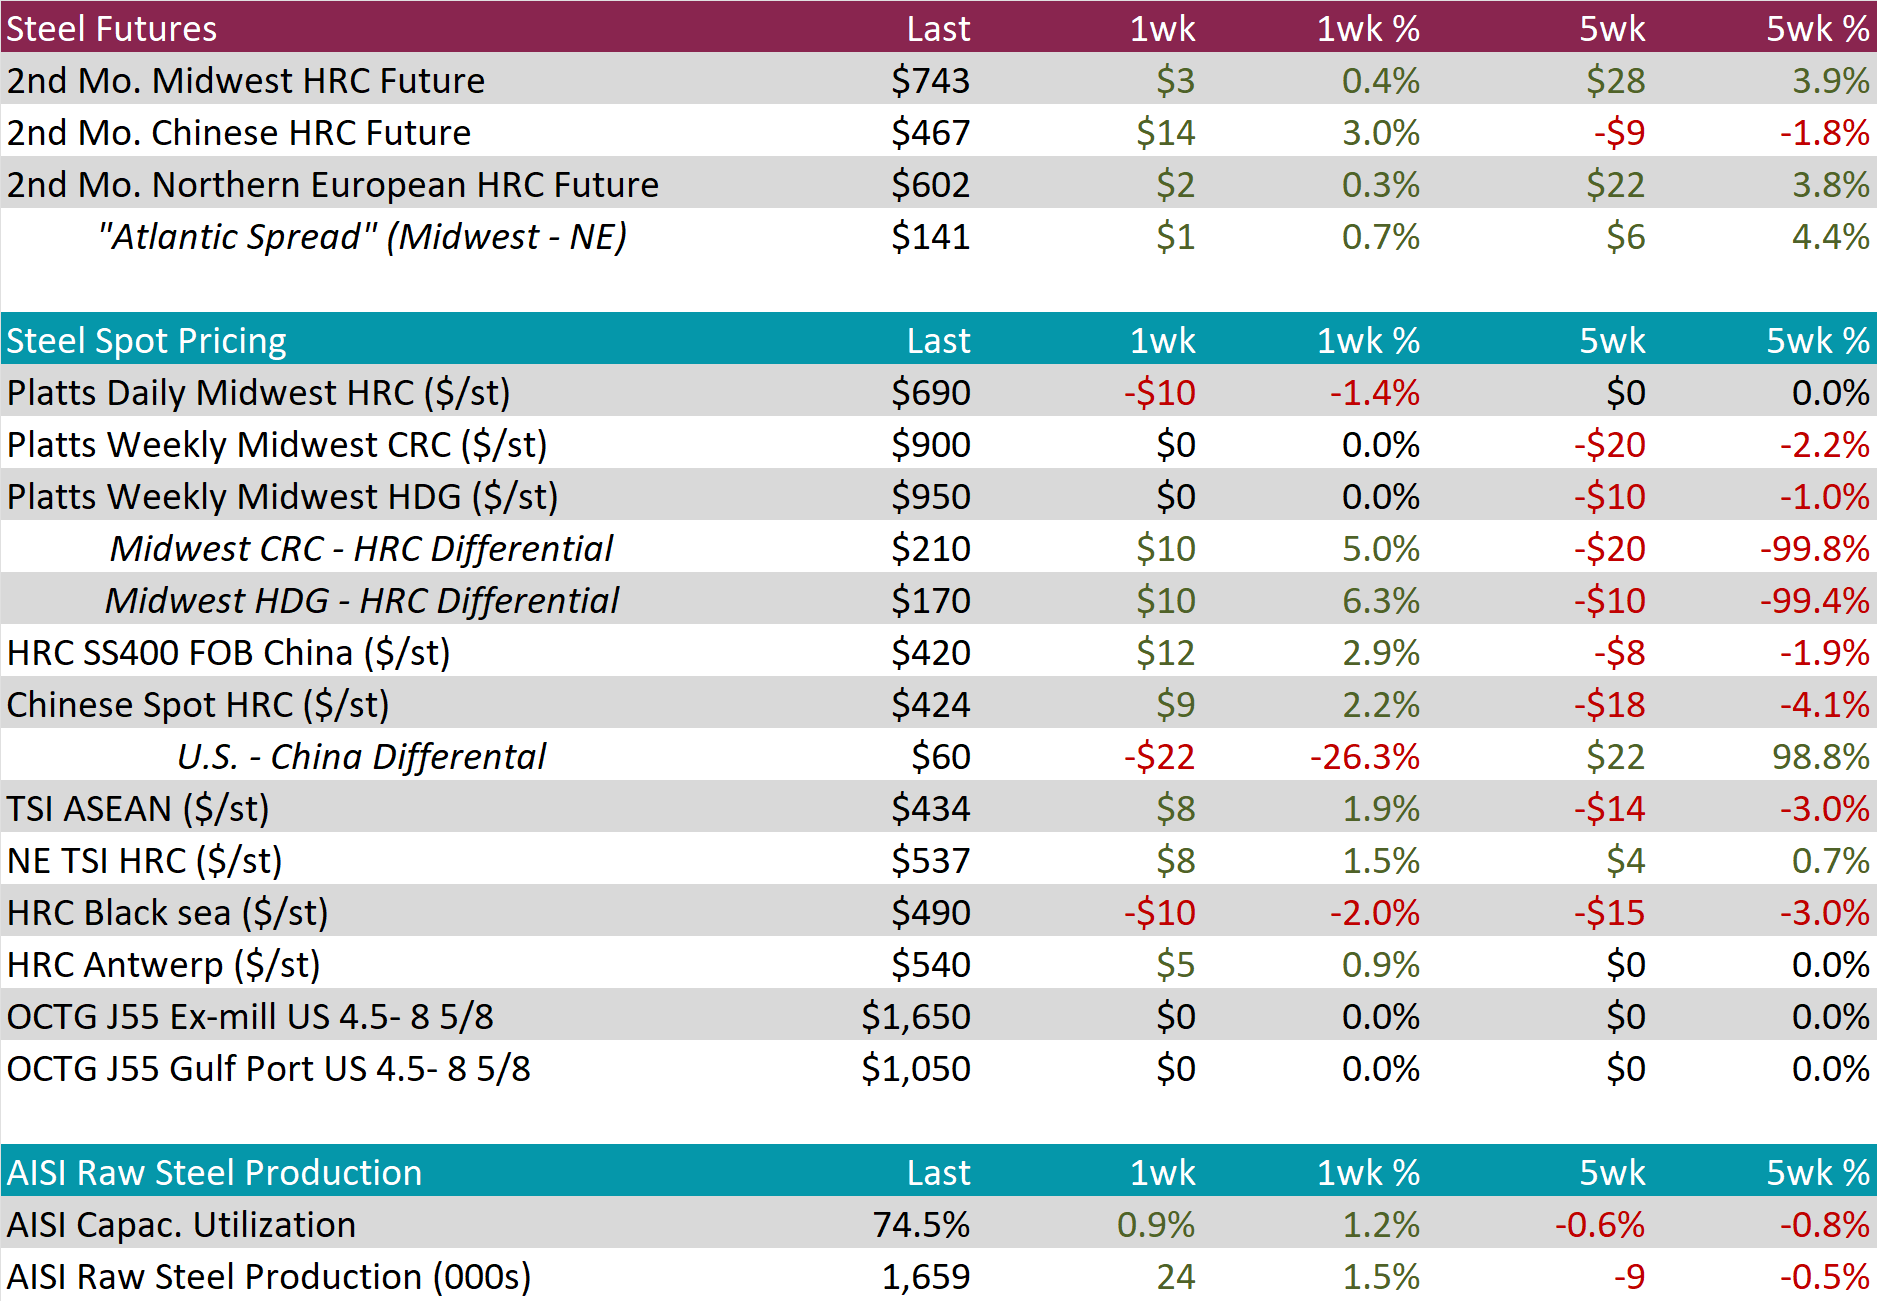
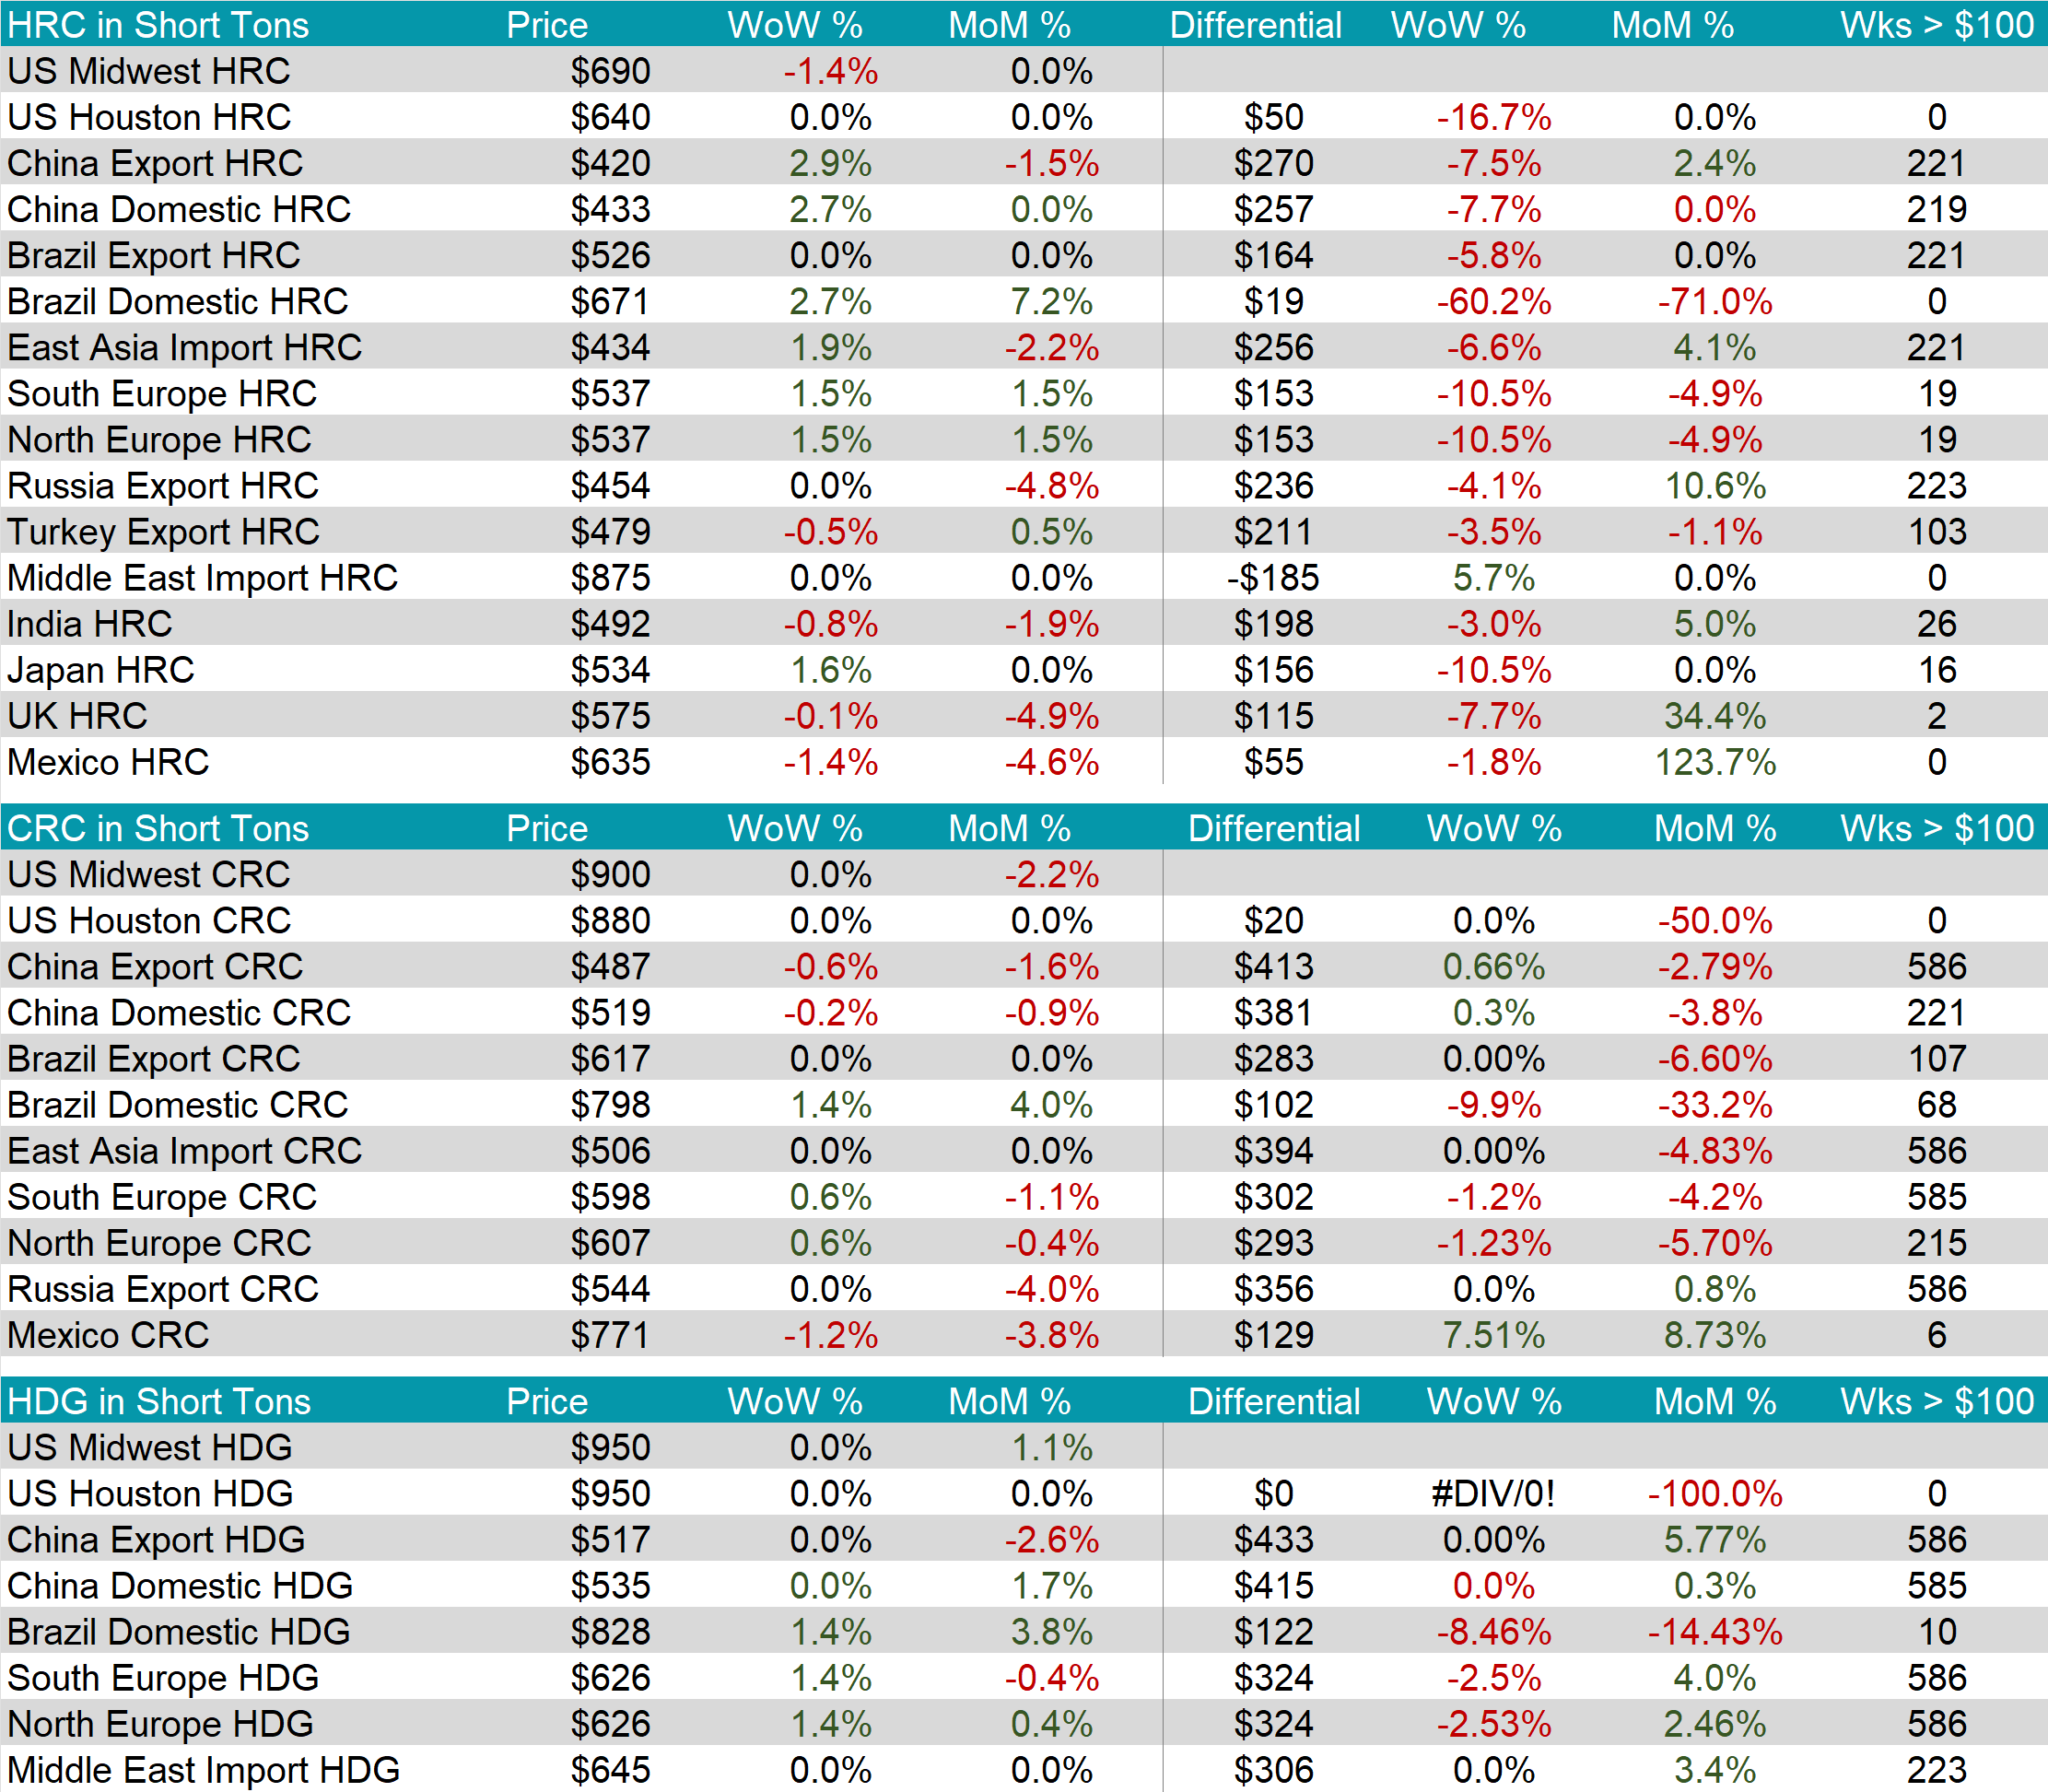
The HRC spot price declined by $10 or -1.4% to $690, reversing last week’s gain. At the same time, the HRC 2nd month future inched up by $3 or 0.4% to $743, resulting in the five-week price change to be up by $28.
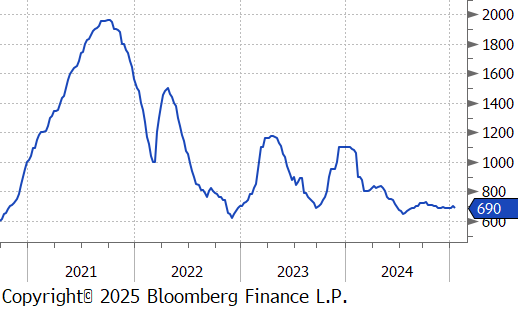
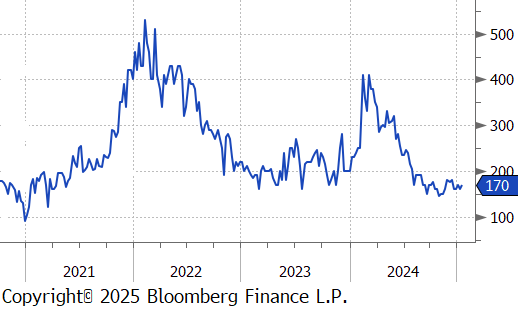
Tandem products both remained unchanged, resulting in the HDG – HRC differential to be up by $10 or 6.3% to $170.
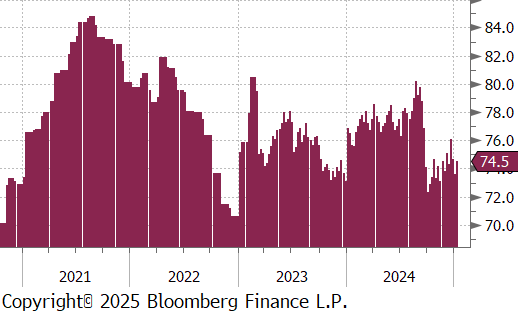
Mill production continues to gradually increase, with capacity utilization ticking up by 0.9% to 74.5%, bringing raw steel production up to 1.659m net tons.
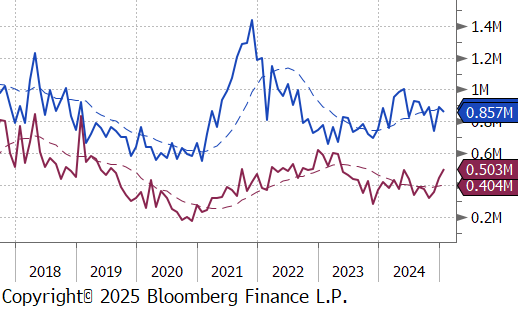
January Projection – Sheet 857k (down 30k MoM); Tube 503k (up 58k MoM)
December Projection – Sheet 887k (up 145k MoM); Tube 445k (up 85k MoM)
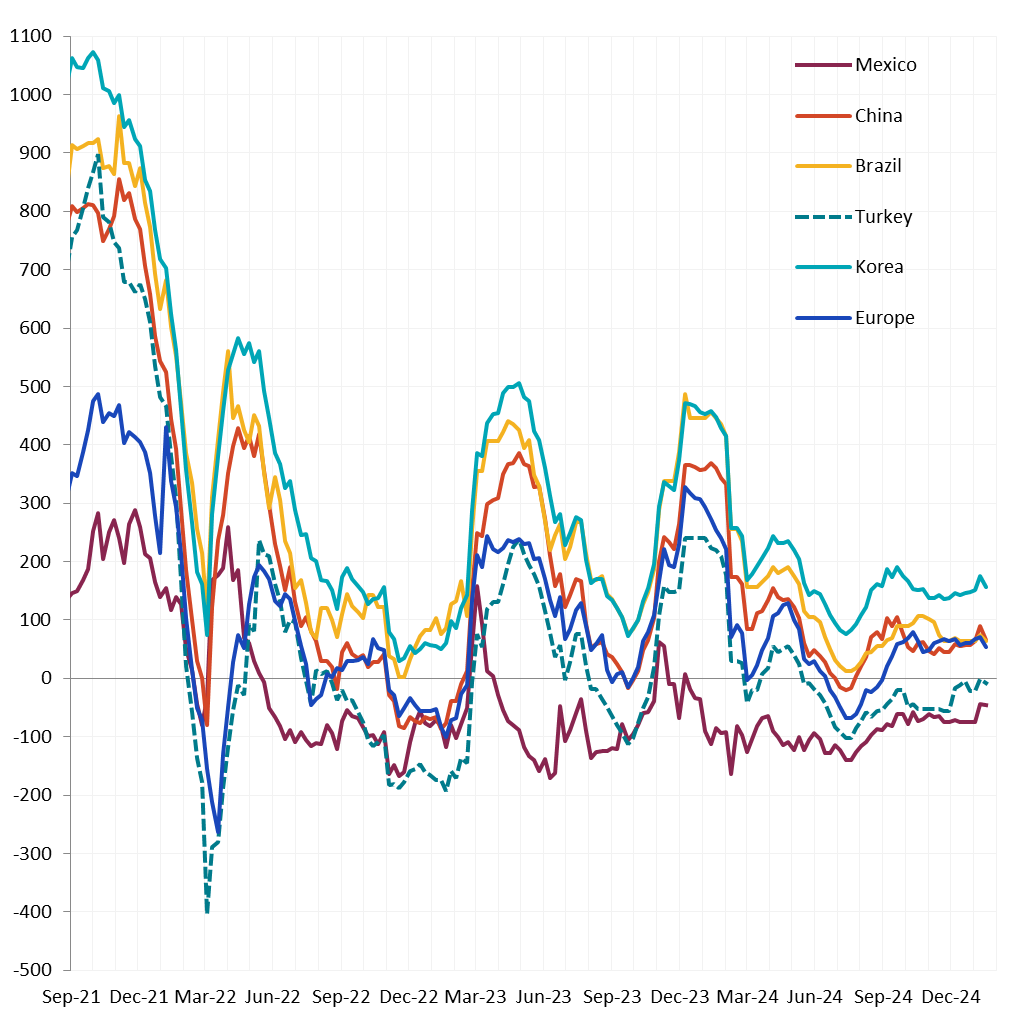
The watched global differentials mainly contracted this week, with the China Export HRC rising by 2.9%, Korea HRC up by 1.9%, and North Europe HRC increasing by 1.5%, while the Turkey Export HRC was down by -0.5%.
Scrap
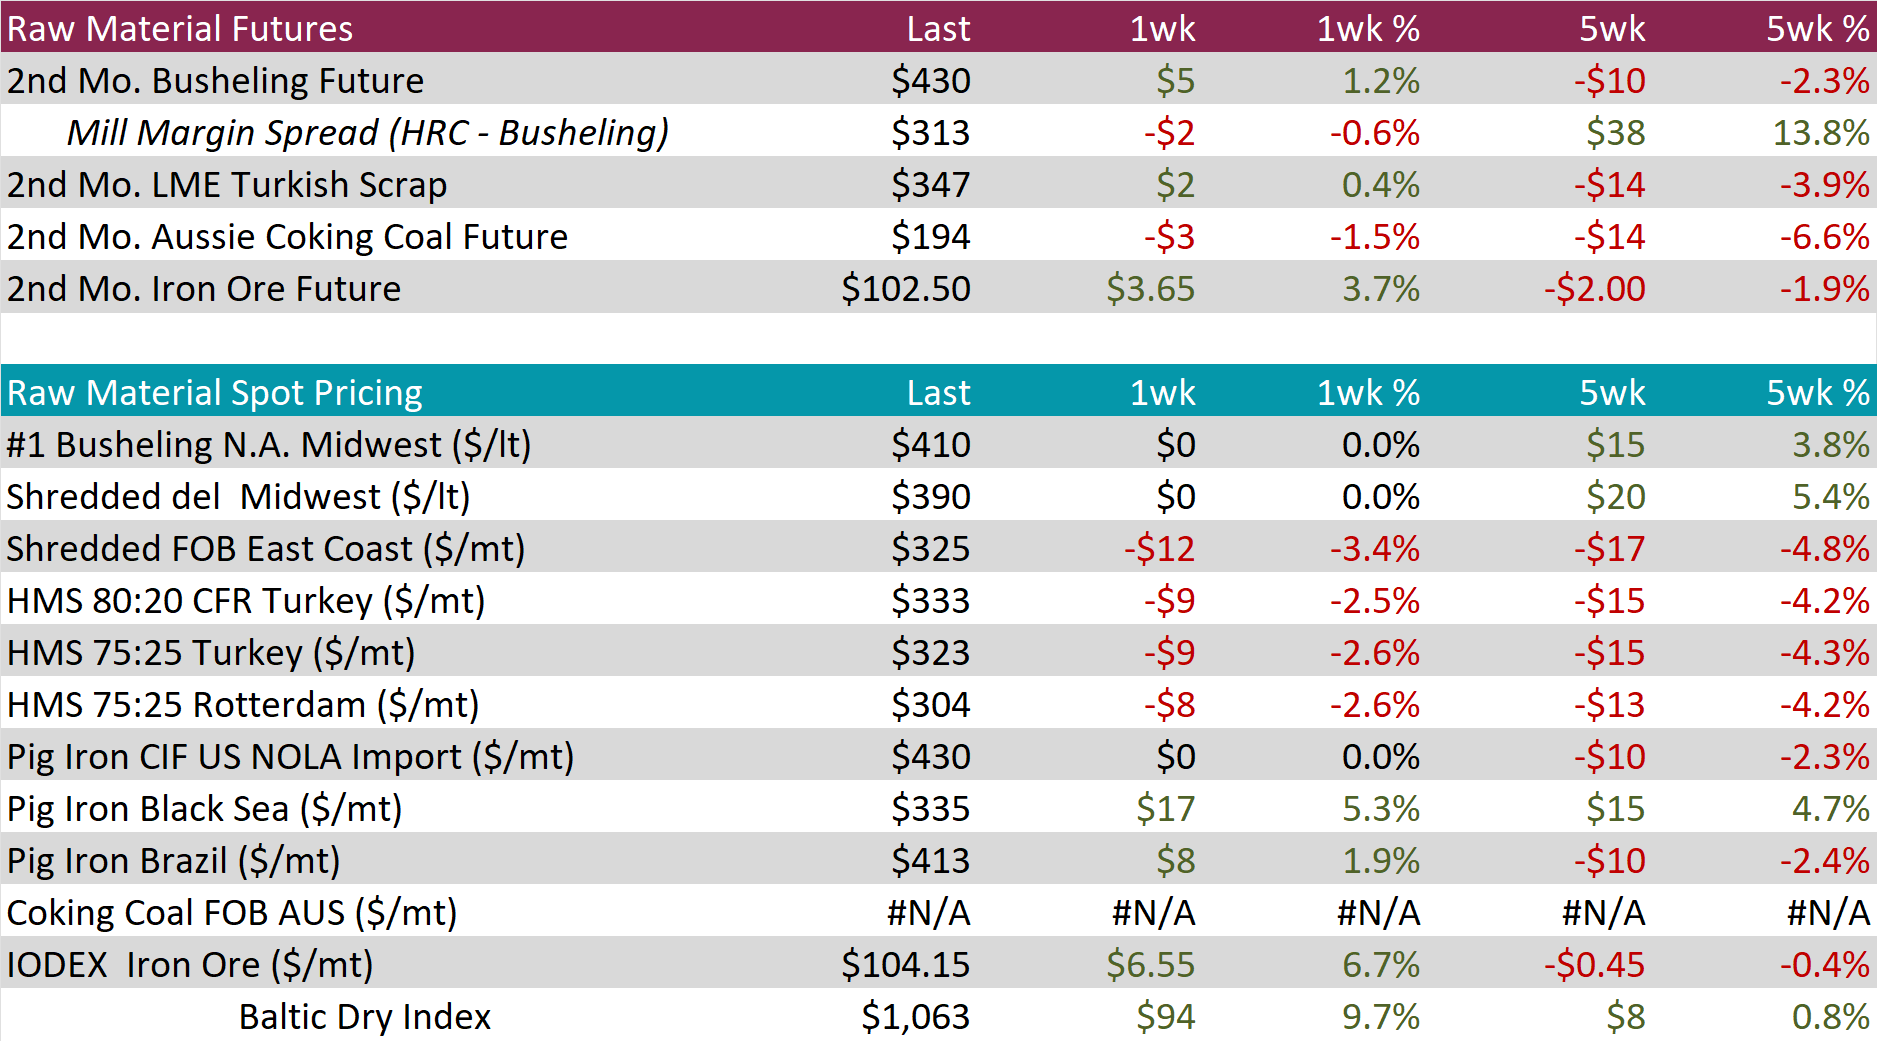
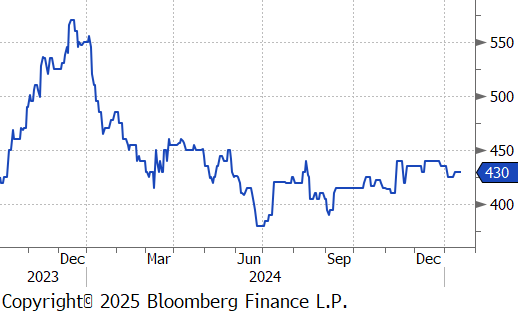
The 2nd month busheling future increased by $5 or 1.2% to $430, rebounding from two consecutive weeks of price declines.
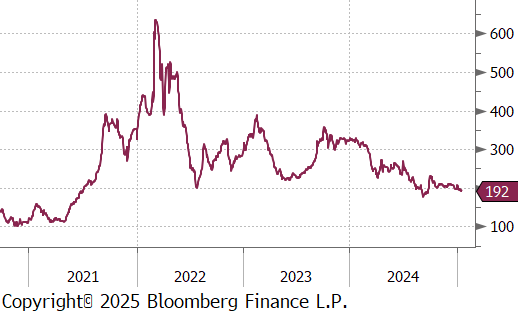
The Aussie coking coal 2nd month future declined by $3 or -1.5% to $194, marking the second consecutive week of price decreases.
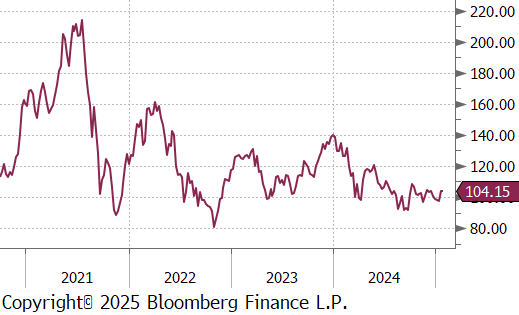
The iron ore 2nd month future rose by $3.65 or 3.7% to $102.50, reaching the highest price in five weeks.
Dry Bulk / Freight
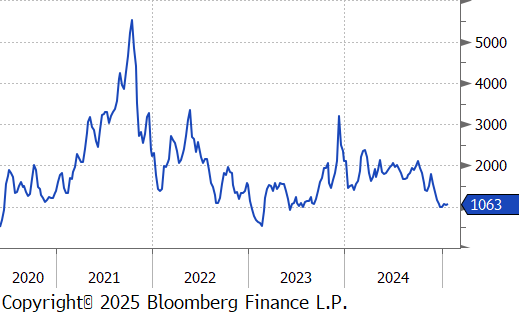
The Baltic Dry Index increased by $94 or 9.7% to $1,063, hitting the highest level in six weeks.
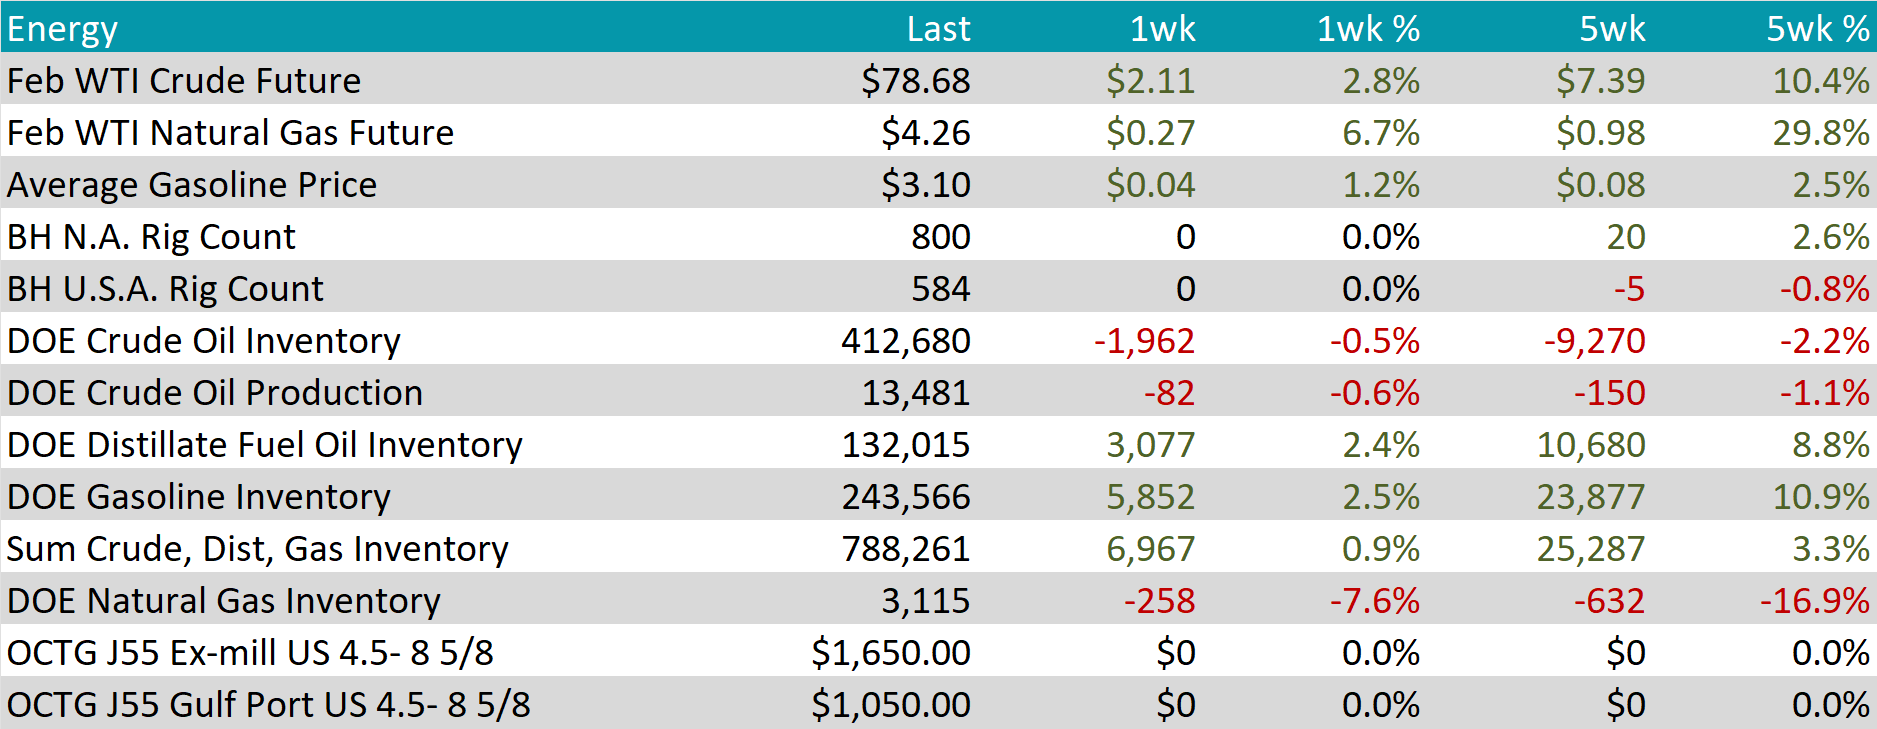
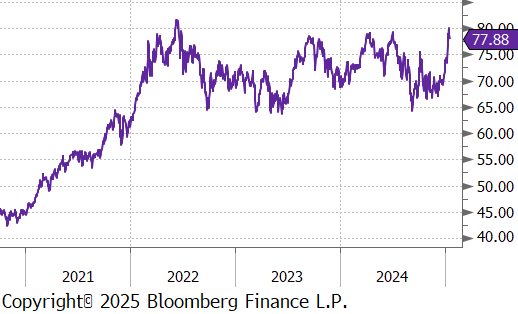
WTI crude oil future gained $2.11 or 2.8% to $78.68/bbl.
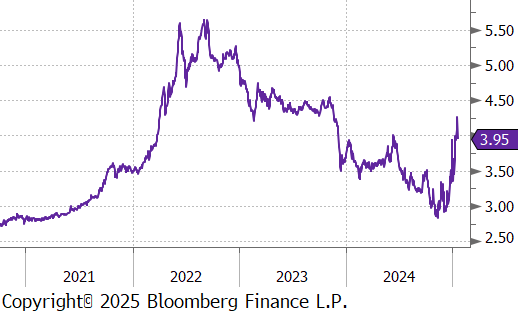
WTI natural gas future gained $0.27 or 6.7% to $4.26/bbl.
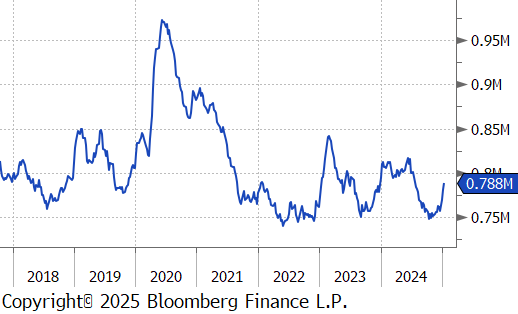
The aggregate inventory level grew further, rising by 0.9%.
The Baker Hughes North American rig count held steady at 800 rigs, and similarly, the US rig count remained unchanged at 584 rigs.
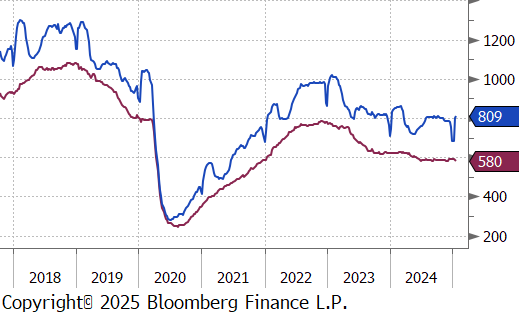
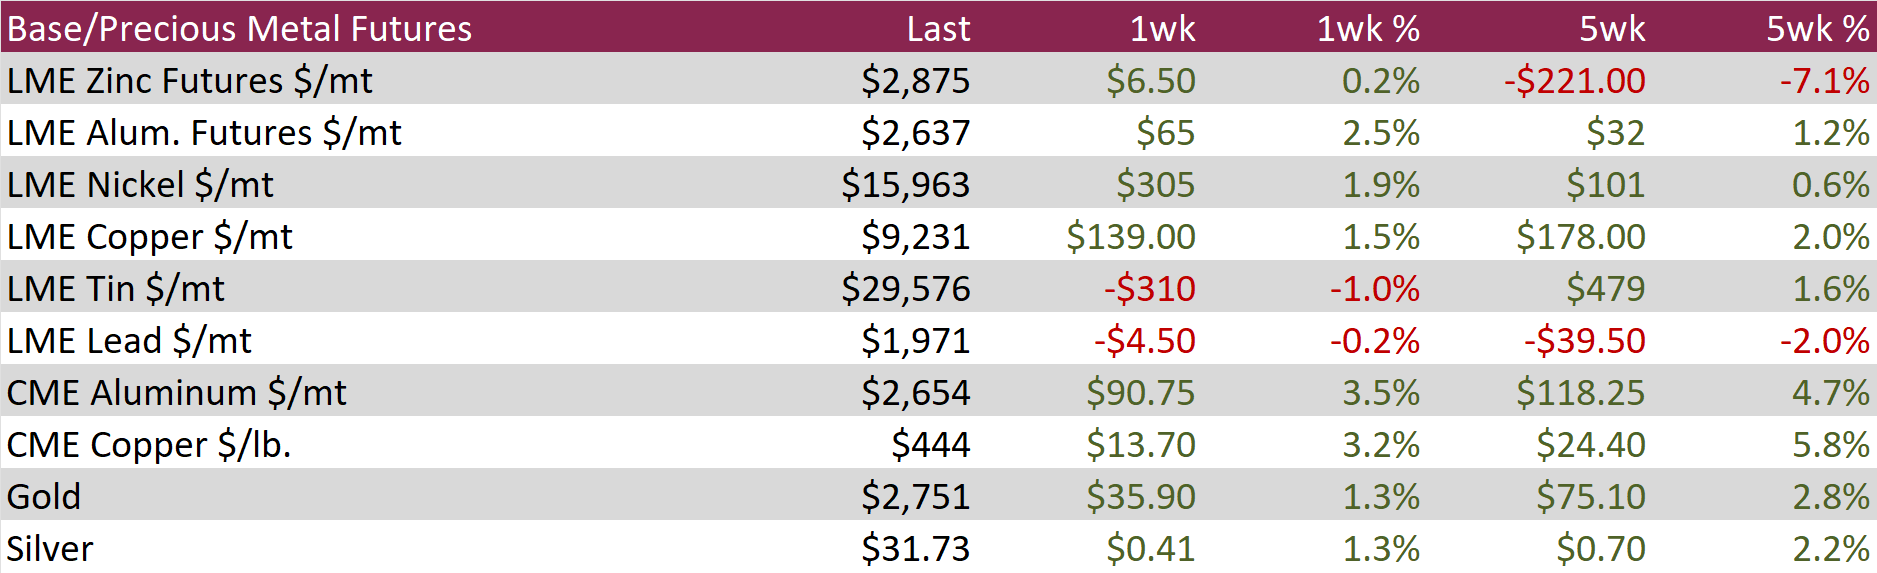
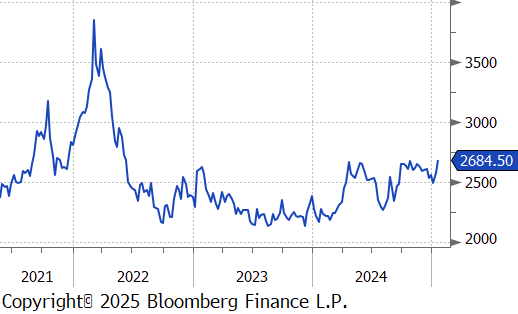
Aluminum futures jumped by $65 or 2.5% to $2,637, continuing their recovery from a four-month low of $2,490 reached on January 6th. Prices have been buoyed by expectations of tighter supply from key producers and signs of improving demand. The European Union is set to implement sanctions on Russian primary aluminum imports, formalizing a trend of manufacturers avoiding Russian goods since the 2022 invasion of Ukraine. This move is expected to tighten global aluminum supply further. Meanwhile, China produced a record 44 million tons of aluminum in 2024, approaching its government-imposed cap of 45 million tons set in 2017 to control oversupply and support carbon emissions targets. On the demand side, China’s industrial output accelerated sharply in December, and credit aggregates improved, signaling that the People’s Bank of China’s aggressive monetary stimulus measures are beginning to stimulate economic activity.
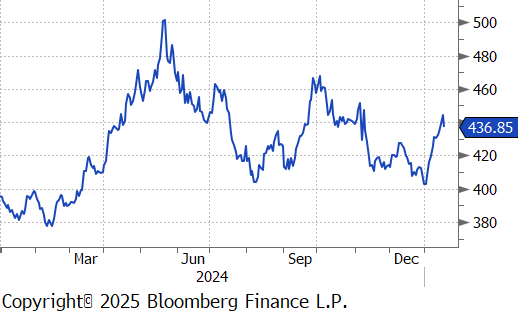
Copper futures increased by $13.70 or 3.2% to $444. China’s central bank kept key lending rates unchanged for the third straight month, despite pledges to boost consumption. The decision dampened hopes for immediate stimulus, though optimism lingers as state media suggest the People’s Bank of China may cut banks’ reserve requirement ratios ahead of the Spring Festival to spur economic activity. Market caution also prevailed ahead of Donald Trump’s inauguration, with uncertainty surrounding his potential trade policies, particularly tariffs, weighing on sentiment. On the supply front, Chile revised its long-term copper production forecast, reducing its estimate for 2034 output to 5.54 million tons, down from a prior projection of 6.34 million tons, underscoring potential supply constraints.
Precious Metals
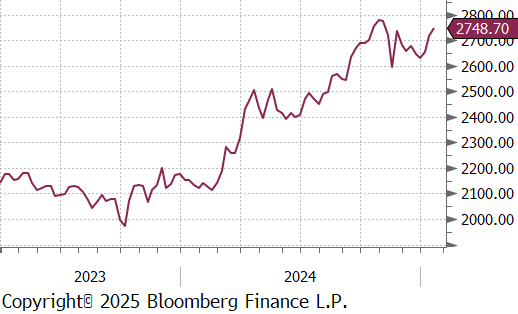
Gold rose by $35.90 or 1.3% to $2,751, as investors positioned ahead of President-elect Donald Trump’s inauguration. His proposed trade tariffs are expected to stoke inflation and heighten the risk of trade conflicts, bolstering gold’s appeal as a hedge against economic uncertainty. Support for gold also came from last week’s softer U.S. economic data, including a benign core inflation reading and weaker-than-expected retail sales and producer price inflation. These indicators have revived market expectations of further Federal Reserve rate cuts this year, enhancing gold’s attractiveness by lowering the opportunity cost of holding non-yielding assets. However, easing geopolitical tensions in the Middle East capped gains. Israel’s release of 90 Palestinian prisoners in exchange for three hostages freed from Gaza marked the beginning of a ceasefire after 15 months of conflict, reducing demand for safe-haven assets.
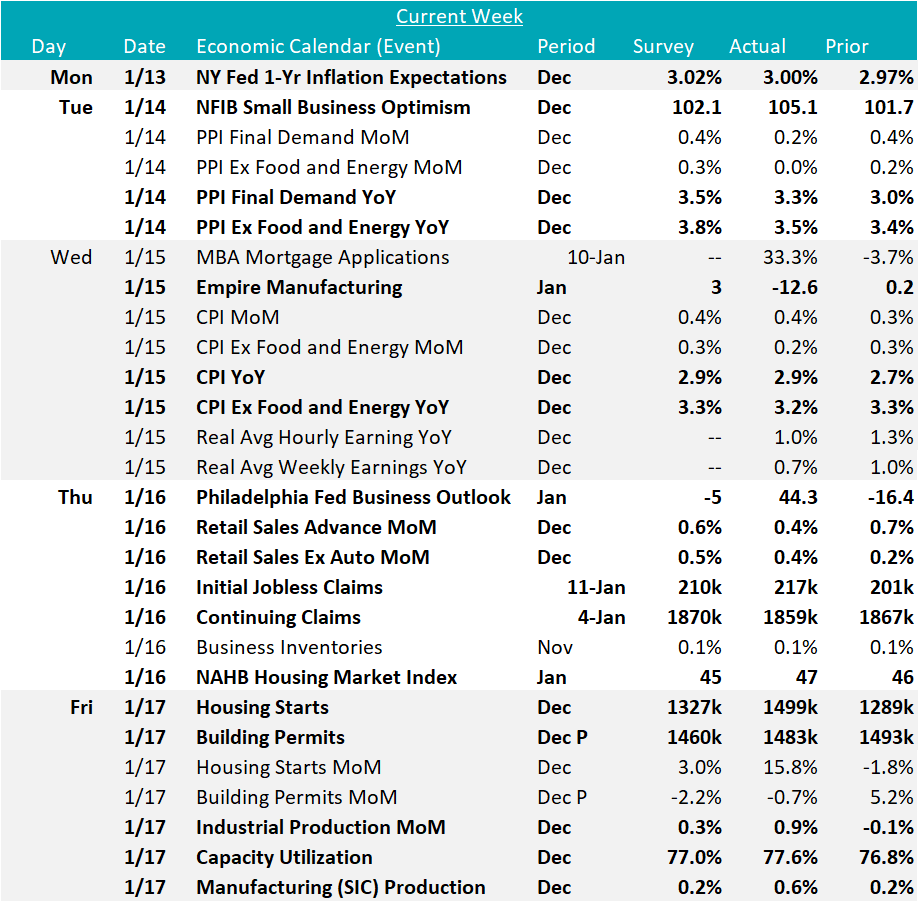
On the industrial side of data, there was a lot to get hopeful about going into 2025. First and foremost, the FED’s Industrial production index showed a 0.9% increase in December, well above the expected increase of 0.3% – the highest level of output since June. Capacity utilization also rose to 77.6%. As we mentioned in yesterday’s FFI Live, we expect that the incredible amount of investment in the U.S. manufacturing base over the last 2-3 years will result in a new all-time high level in industrial production output, previously set in September 2018.
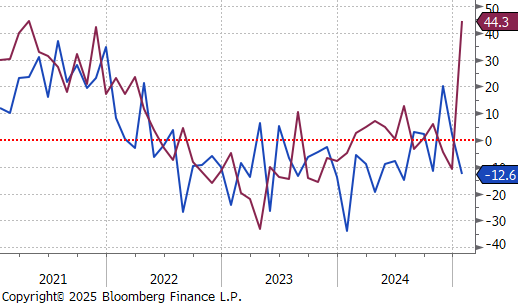
The FED Manufacturing surveys were mixed, with Empire (NY) printing at -12.6, below the expected increase to 3. However, the more reliable Philadelphia index jumped to 44.3, it’s highest level of expansion since April 2021.
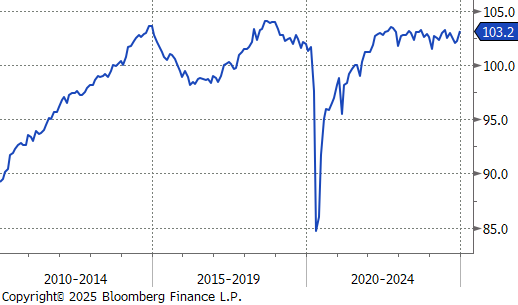
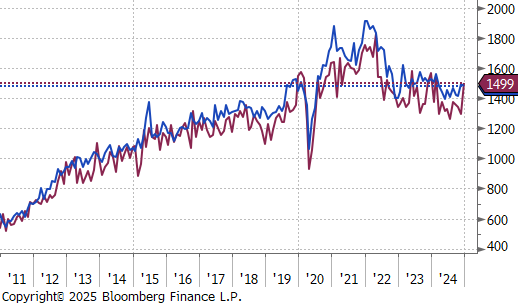
This was also coupled with a much better than expected NFIB (National Federation of Small Businesses) Optimism Index jumping to 105.1, it’s highest level since October 2018. Furthermore, the NAHB (National Association of Homebuilders) Housing Market Index increasing to 47, versus the expectation of a decline to 45. Optimism in the housing sector was then confirmed by an impressive mix of housing starts and building permits, with both coming in above expectations – starts rose to 1,499k, versus the expected increase to 1,327k (highest level since February), while permits decreased to 1,483k, better than the expected decline to 1,460k.
Finally, December inflation data came in mostly below expectations, while remaining elevated for YoY readings. Core CPI (Consumer Price Index) eased to 3.2%, below the expected 3.3% and down from 3.3%, where it has been sitting for the previous three months. Core PPI (Producer Price Index) on the other hand rose to 3.5% but came in below the expected 3.8% print. The market is currently pricing in only one rate cut for next year (currently in June). Over the last month, the market has moved more in line with our thinking of no rate cuts in 2025.