Flack Capital Markets | Ferrous Financial Insider
January 19, 2024 – Issue #415
January 19, 2024 – Issue #415
Overview:

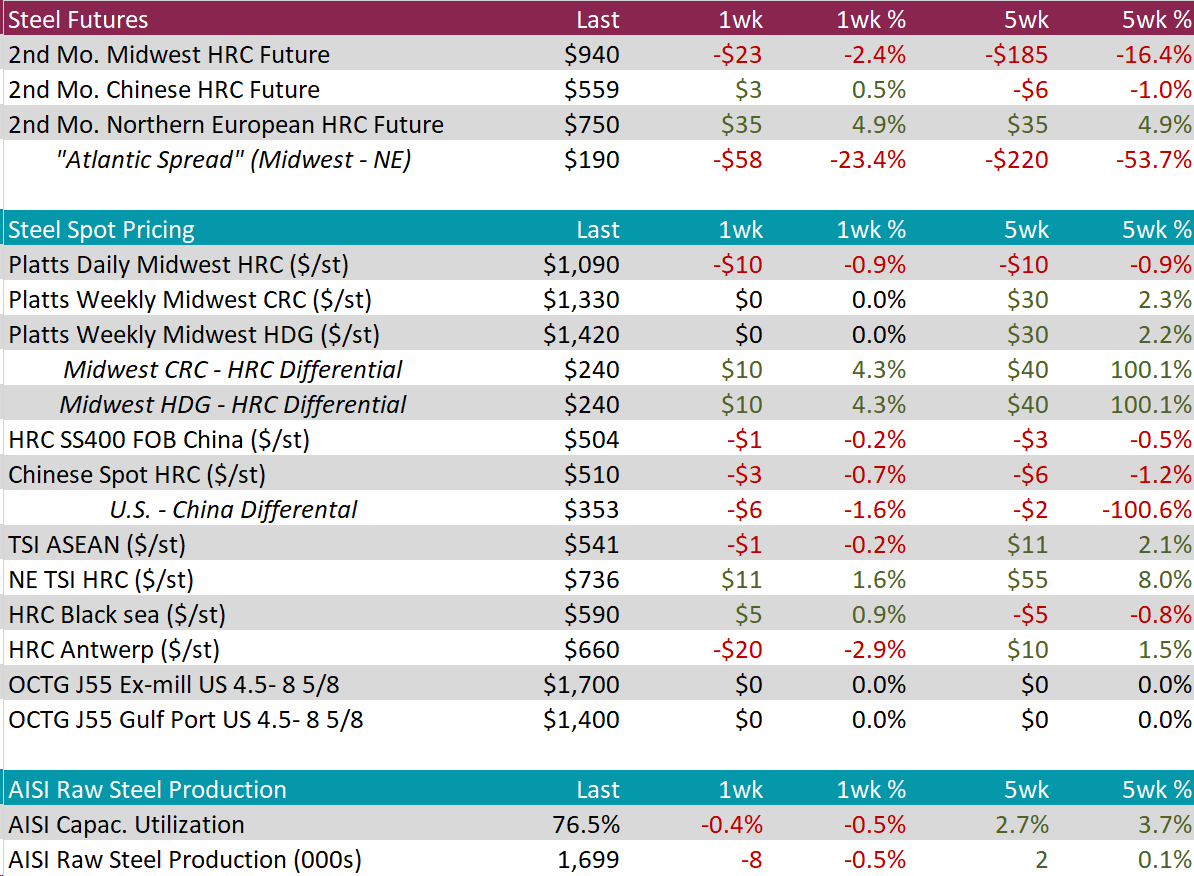
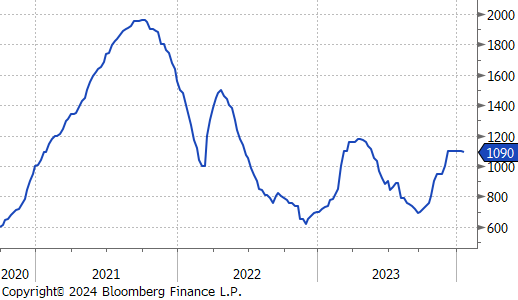
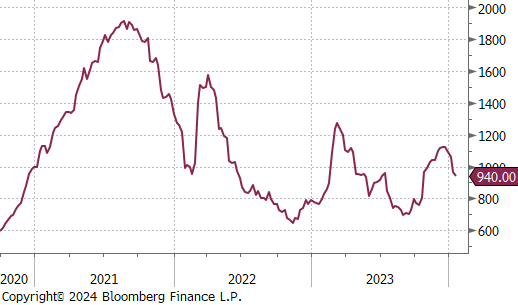
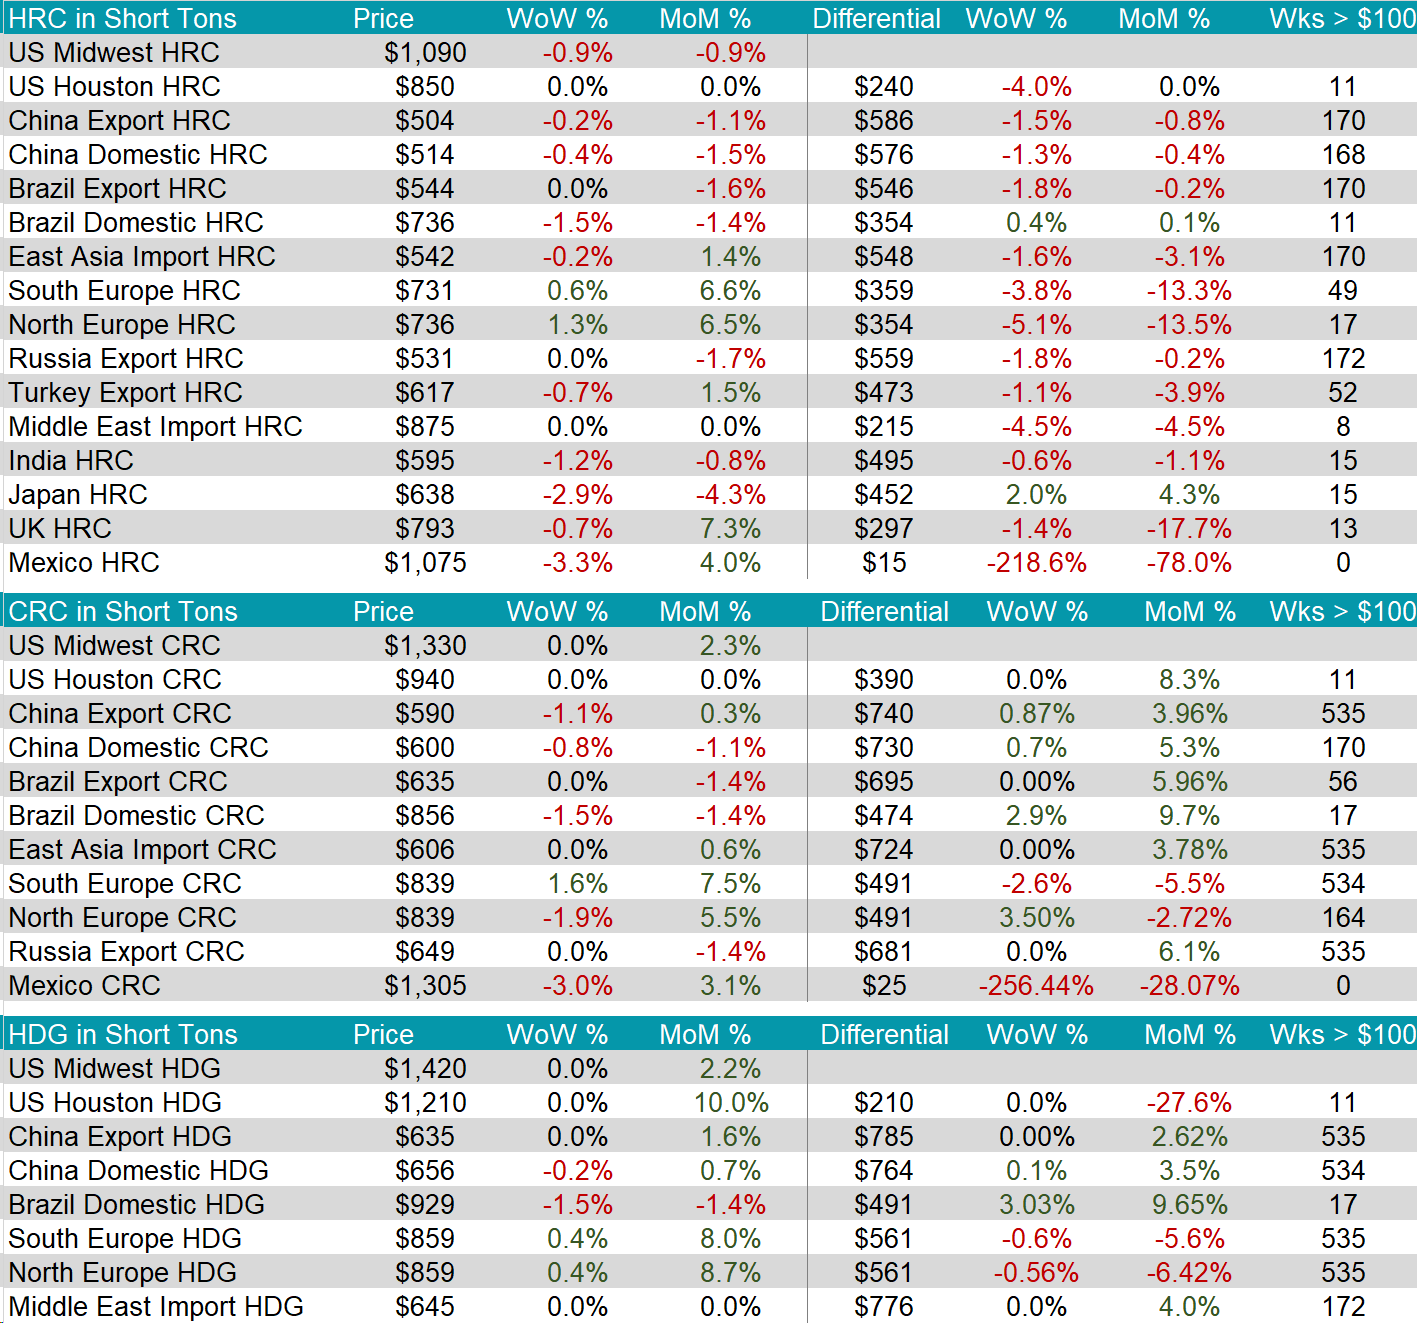
The HRC spot price fell by $10 or -0.9% to $1,090, after remaining stagnant at $1,100 for six weeks. At the same time, the 2nd month future fell by $23 or -2.4% to $940, continuing its downward trend.
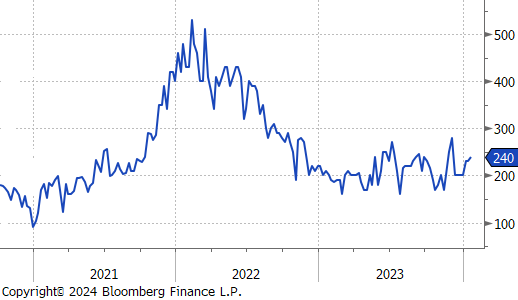
Tandem products both remained unchanged, resulting in the HDG – HRC Differential to increase by $10 or 4.3% to $240.
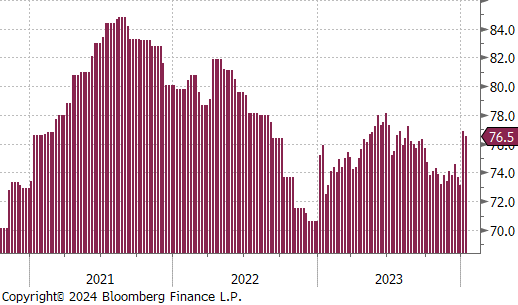
Mill production remains relatively low, with capacity utilization ticking down by 0.4% to 76.5%, bringing raw steel production down to 1.699m net tons.
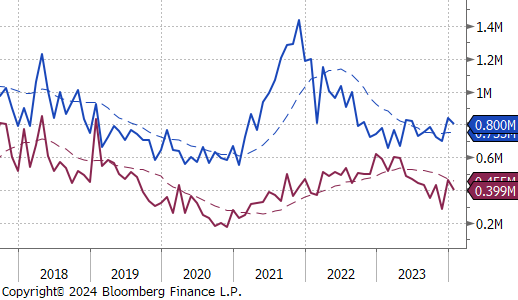
January Projection – Sheet 800k (down 37k MoM); Tube 399k (down 60k MoM)
December Projection – Sheet 836k (up 138k MoM); Tube 459k (up 176k MoM)
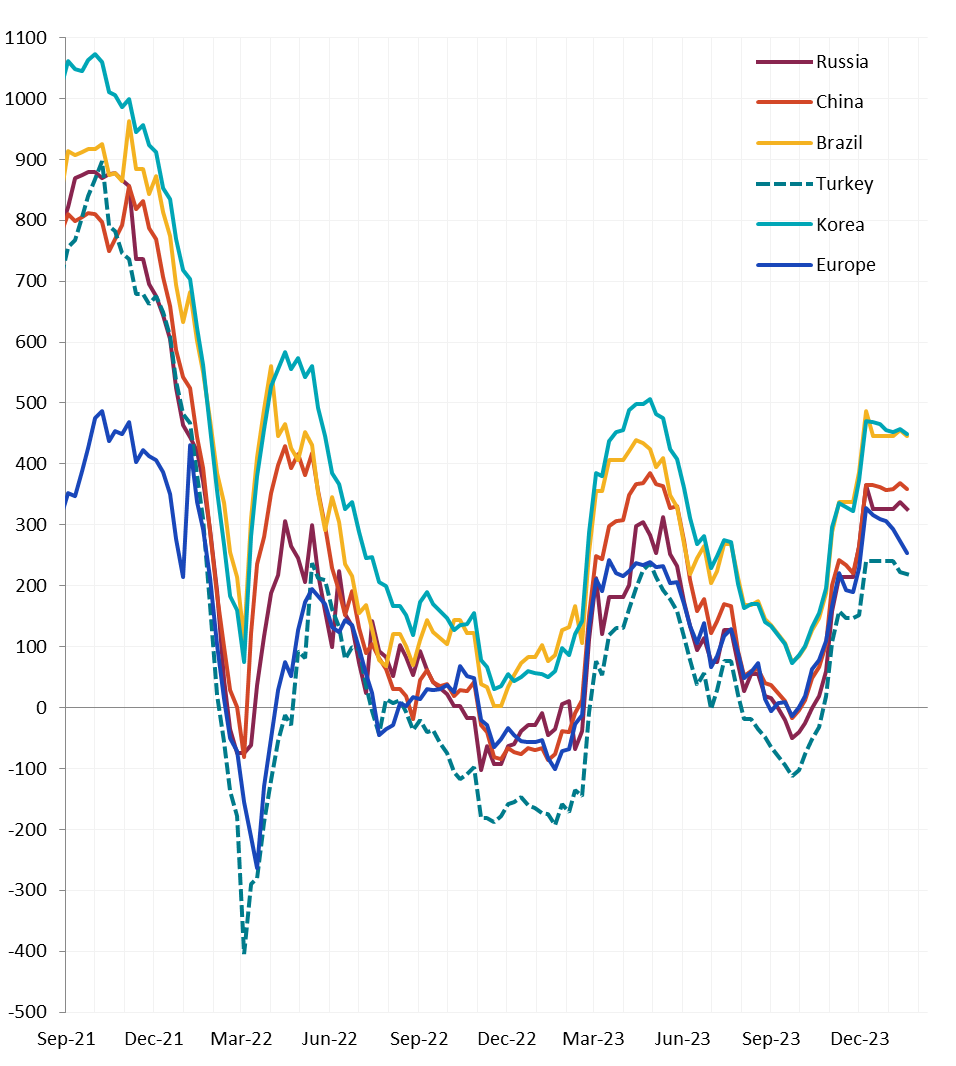
Watched global differentials were all mainly down, with Brazil Domestic HRC down by 1.5% and Europe continuing to climb with their HRC increasing by 0.6%.
Scrap
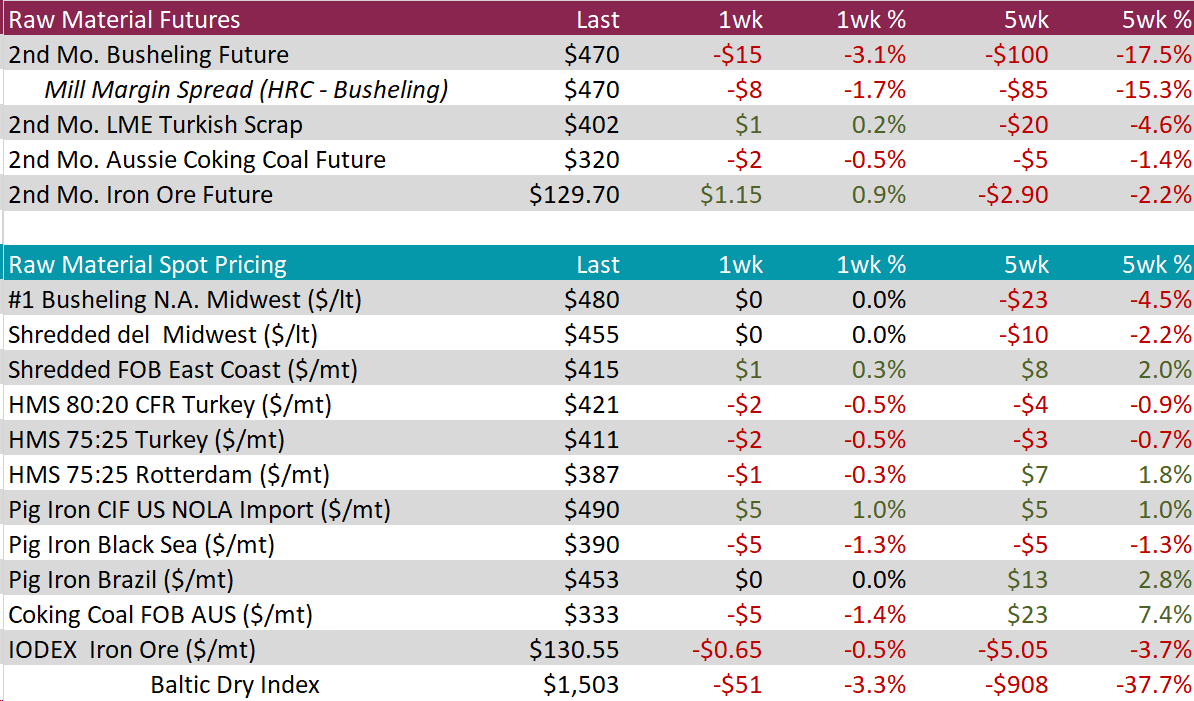
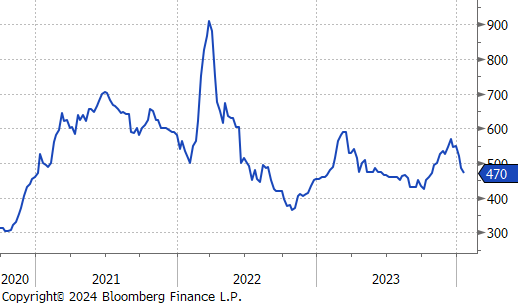
The 2nd month busheling future fell by $15 or -3.1% to $470, marking the third week of declines. Meanwhile the busheling spot price remained unchanged at $480.
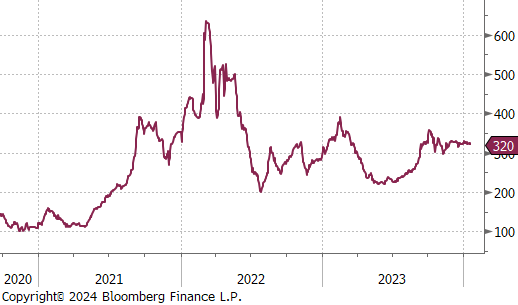
The 2nd month Aussie coking coal future fell by $2 or -0.5% to $320, continuing to stay above the $300s level. At the same time, the spot price fell by $5 or -1.4% to $333.
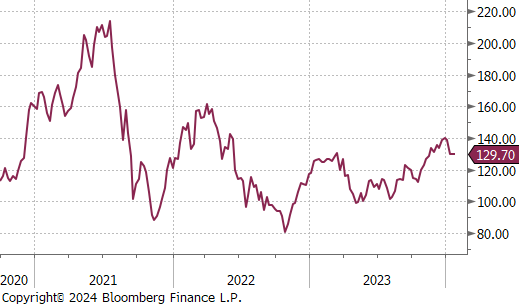
The 2nd month iron ore future rose by $1.15 or 0.9% to $129.70, leveling off after falling from recent price high of $138.70.
Dry Bulk / Freight
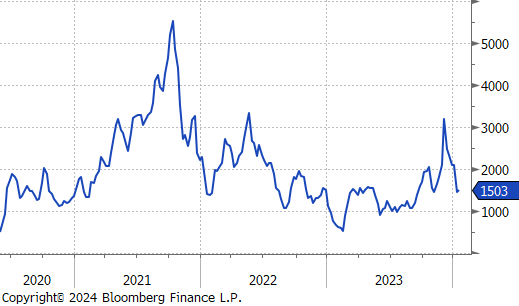
The Baltic Dry Index continued to fall, dropping by $51 or -3.3% to $1,503. The five-week change is now down by $908 or -37.7%
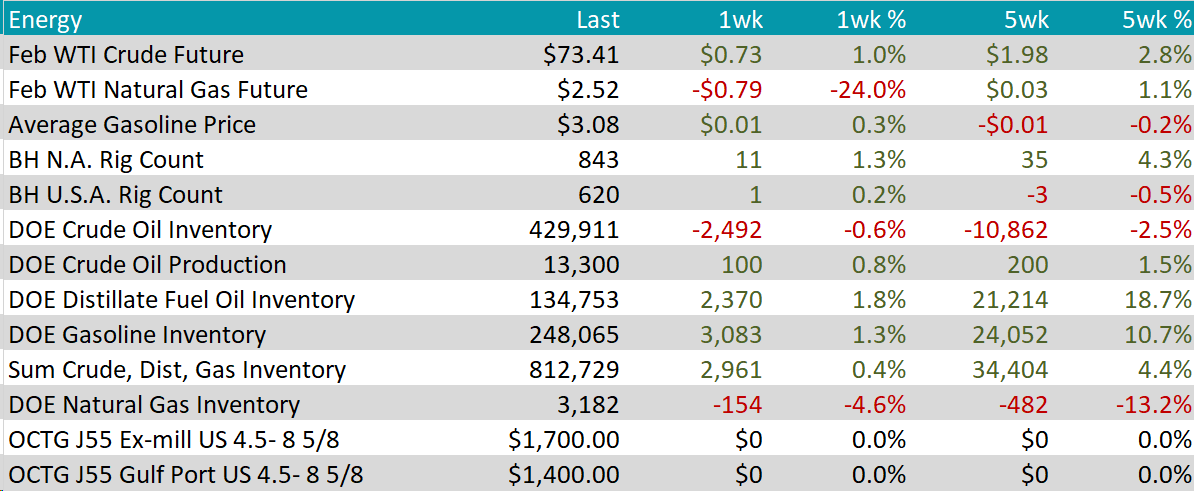
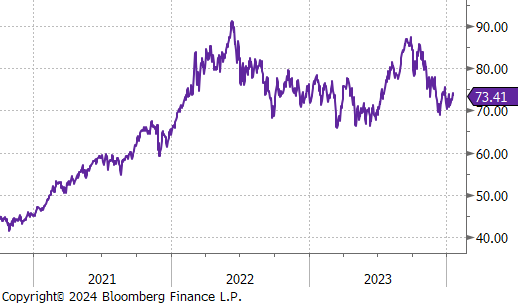
WTI crude oil future gained $0.73 or 1.0% to $73.41/bbl, maintaining above the $70s level.
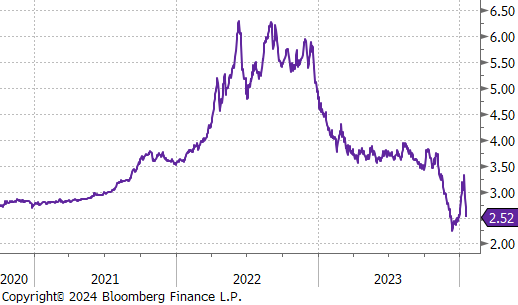
WTI natural gas future lost $0.79 or -24.0% to $2.52/bbl, dropping back down after its recent rebound in price.
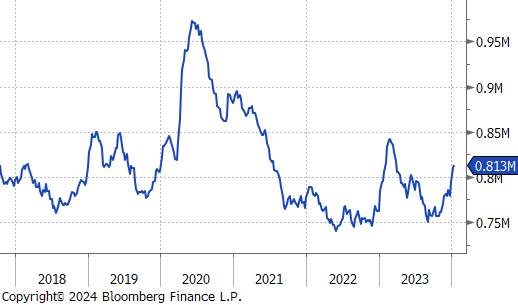
The aggregate inventory level ticked up by 0.4%
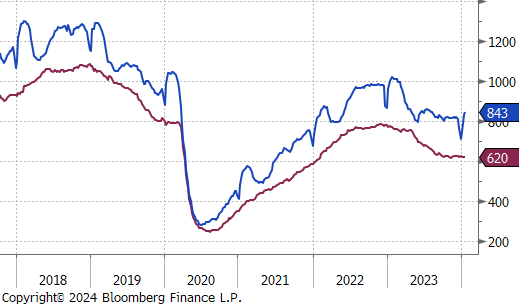
The Baker Hughes North American rig count continued to rebound, increasing by 11 rigs, bring the total count to 843 rigs. Meanwhile, the US rig count increased by 1, bringing the total count to 620 rigs.
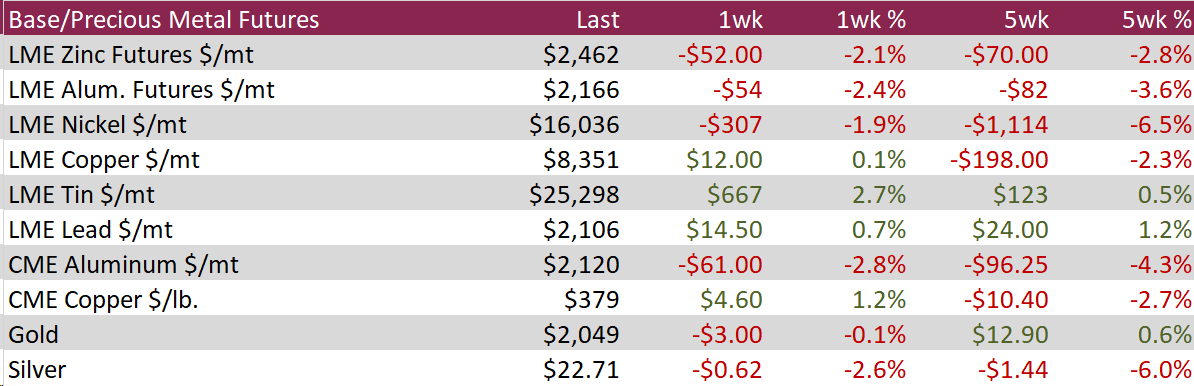
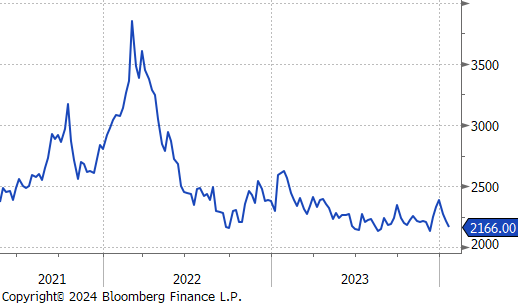
Aluminum dipped further, falling by $54 or -2.4% to $2,166. This decline follows a period of abundant supply of crucial raw materials. The descent began after an explosion at a Guinean fuel depot, which briefly spiked prices. However, a recent infusion of investments from the UAW into Guinea’s bauxite infrastructure has eased fears of a supply shortage, causing prices to fall again at the year’s start.
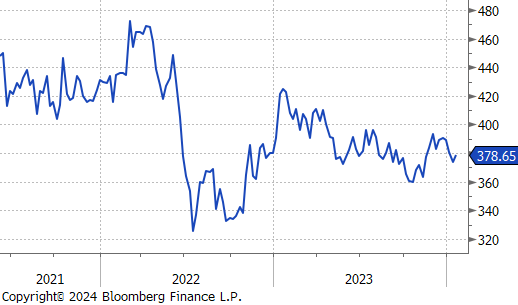
Copper recovered a bit, rebounding by $4.60 or 1.2% to $379. This uptick follows a slight weakening of the US dollar amidst a balance of subdued short-term demand and ongoing worries about future shortages. The critical role of copper in electrification and its potential supply constraints continue to underpin its price. Notably, this concern was highlighted by the production stoppage at First Quantum’s Cobre mine in Panama and Anglo American’s 25% reduction in its yearly copper production forecast due to rising operation costs.
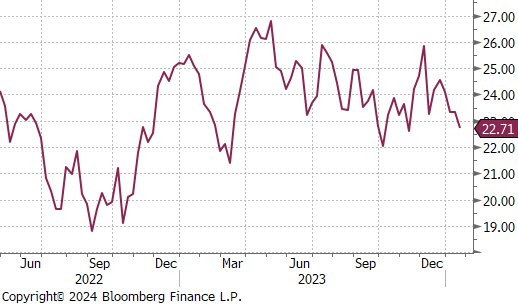
Silver fell by $0.62 or -2.6% to $22.71, influenced by investors reevaluating their expectations for immediate monetary easing from the Fed. This reassessment follows stronger than anticipated US retail sales data in December, suggesting robust economic health and reducing the likelihood of a rate cut in March. Adding to this sentiment, Federal Reserve Governor Christopher Waller expressed his view against rapid rate reductions. Investors are now keenly awaiting further comments from Fed officials to gain clarity on future monetary policy. Concurrently, China’s GDP growth in Q4 fell short of expectations, casting a shadow over the industrial demand for metals.
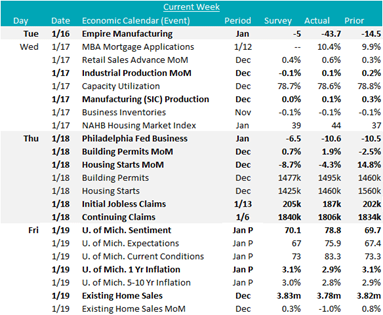
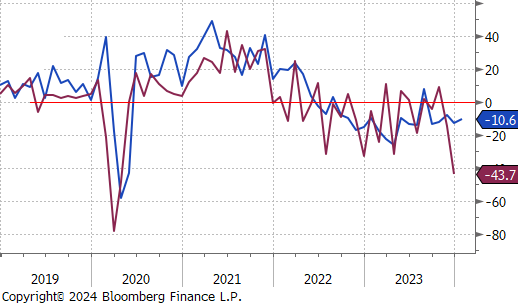
Manufacturing data provided a mixed view on the status of the recovery. The January readings for Empire (NY) & Philadelphia FED manufacturing surveys both came in below expectations, -43.7 vs -5, and -10.6 vs -6.5, respectively. The Empire print was concerning, with the lowest topline print since May 2020, while Philly showed a slight increase compared to the December print. Additionally, MoM December Industrial Production & Manufacturing Production indexes both printed slightly lower than November readings but above expectations, 0.1% vs -0.1%, and 0.1% vs 0.0%.
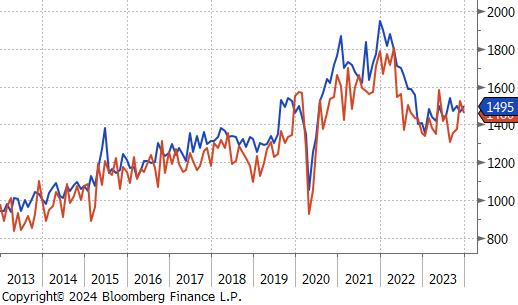
December Building permits and Housing starts both came in above expectations, 1.9% vs 0.7%, and -4.3% vs -8.7%. This was a strong signal of further activity, as the permits/starts relationship snapped back into sync. Although housing starts printed down compared to November, it is important to remember that this was a huge upside surprise. Additional signs of life come from the NAHB (Builders) Housing Market Index which printed up to 44 from 37 in January and above expectations of 39. Although it remains below 50, this is the second straight month of increases. Existing home sales were the only raincloud on the week, printing -1% in December compared to 0.8% in November, and below expectations of 0.3%.
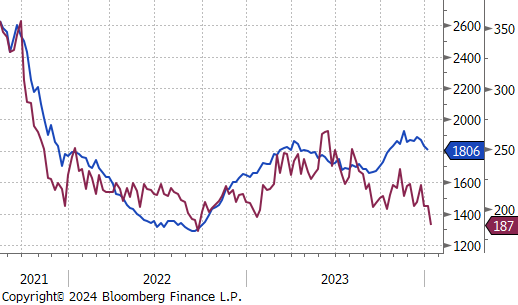
Initial and continuing claims both came in below expectations, 187k vs 205k, and 1,806k vs 1,840k, respectively. This is a clear signal that the labor market is cooling in a contained and controlled way, with initial claims down to their lowest level since September 2022.
Another impressive datapoint was the preliminary data for the University of Michigan Consumer Sentiment Survey printing 78.8 versus expectations of 70.1. If this reading holds when the remainder of the data is collected, this would be highest topline reading since July 2021. Looking more closely, expectations for 1yr inflation also improved, down to 2.9% versus 3.1% in December and “flat” expectations. This is a welcome sign after this index shot higher in October & November of last year.