Flack Capital Markets | Ferrous Financial Insider
January 26, 2024 – Issue #416
January 26, 2024 – Issue #416
Overview:

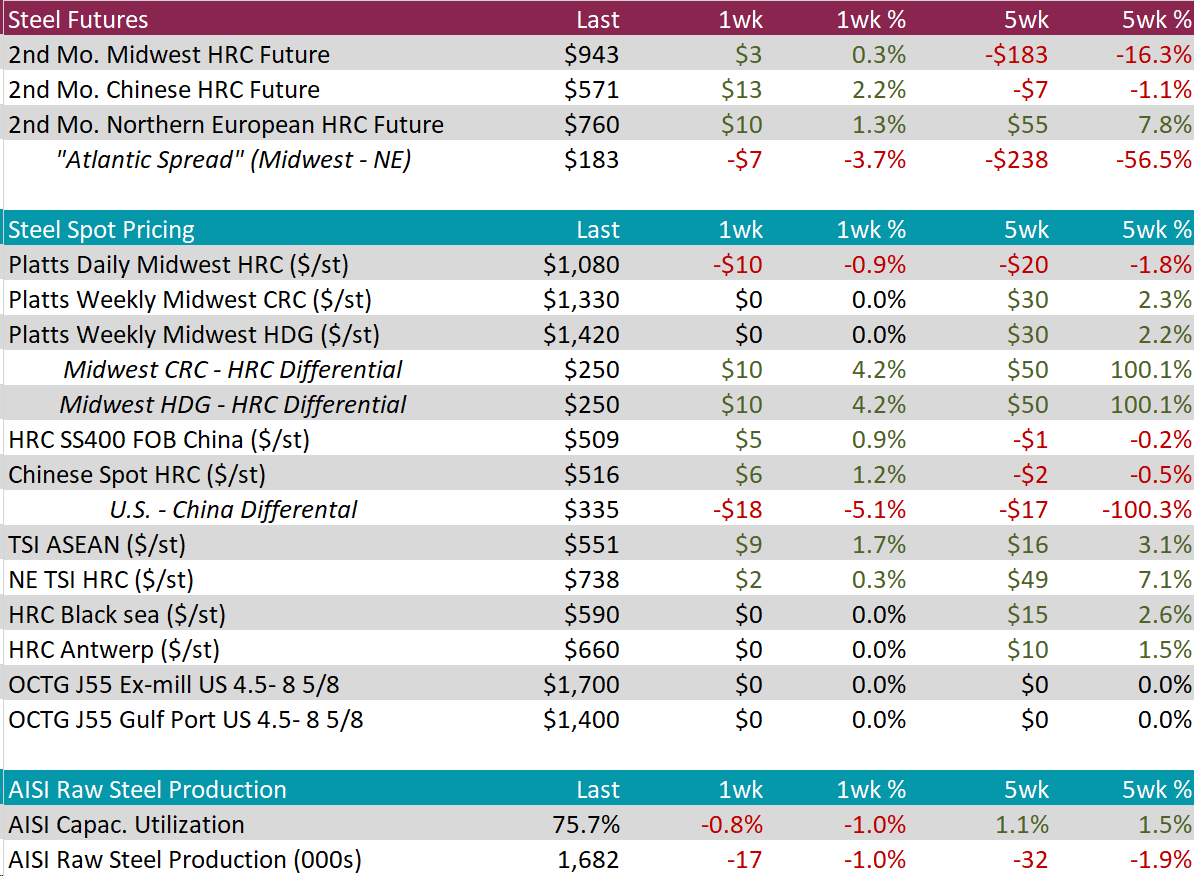
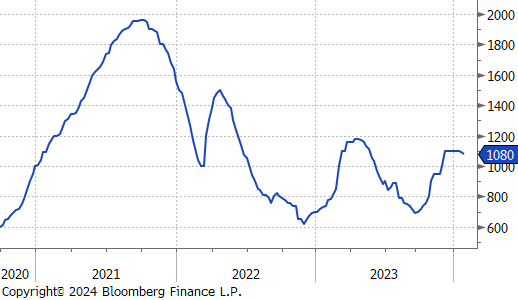
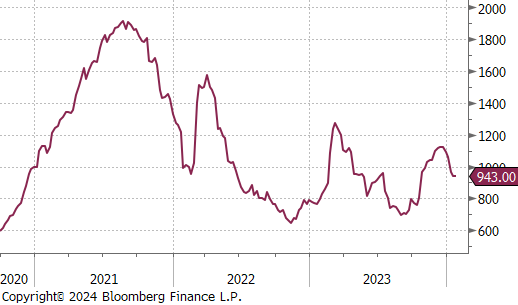
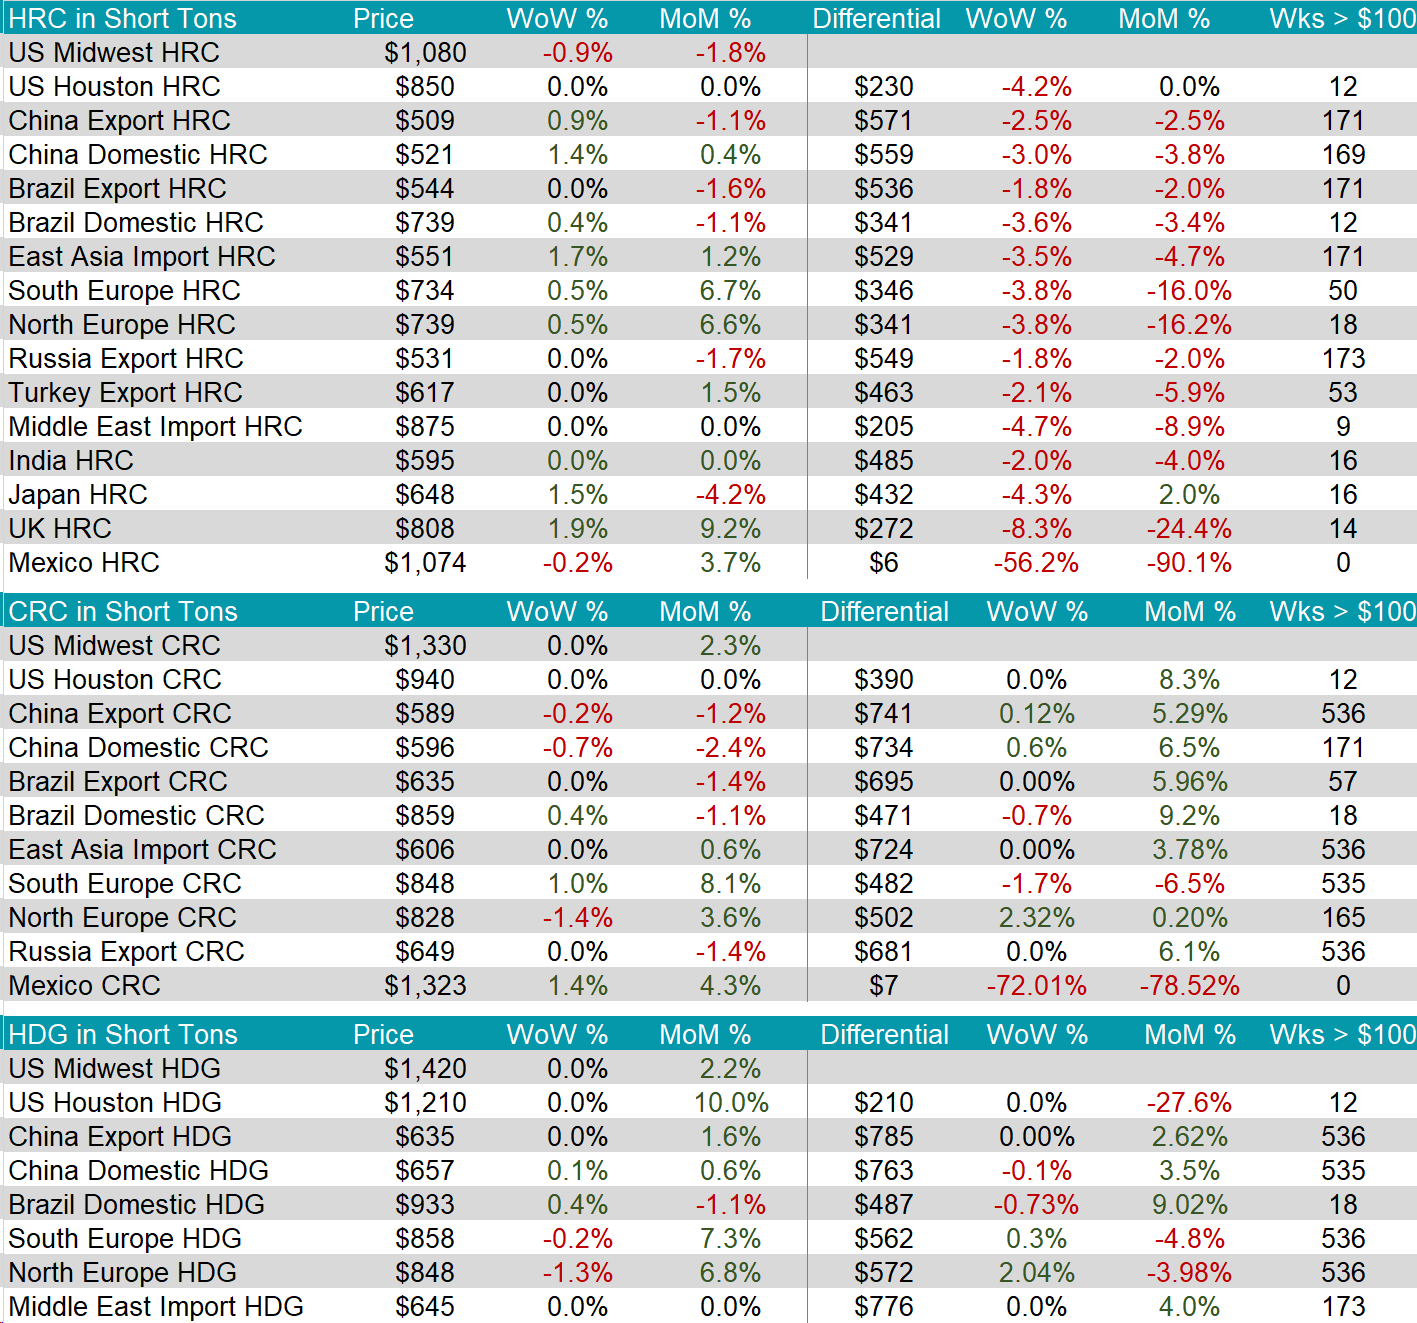
The HRC spot price fell by $10 or -0.9% to $1,080, marking the second week of declines. Meanwhile, the 2nd month future rose by $3 or 0.3% to $943, marking the first increase in four-weeks.
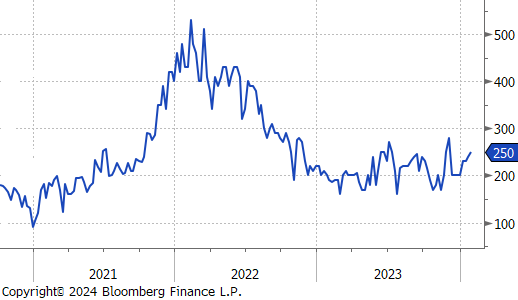
Tandem products both remained unchanged, resulting in the HDG – HRC differential to increase by $10 or 4.2% to $250.
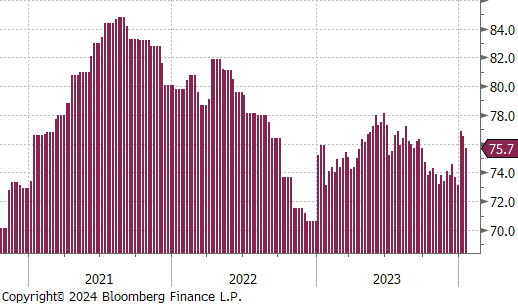
Mill production continued to remain flat, with capacity utilization ticking down by 0.8% to 75.7%, bringing raw steel production down to 1.682m net tons.
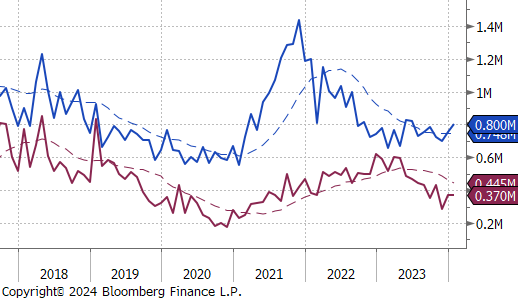
January Projection – Sheet 800k (up 47k MoM); Tube 370k (down 1k MoM)
December Projection – Sheet 753k (up 54k MoM); Tube 371k (up 87k MoM)
Watched global differentials were all down this week, with China Domestic HRC increasing by 1.4%. Other notable countries were East Asia Import HRC rising by 1.7% and UK up by 1.9%.
Scrap
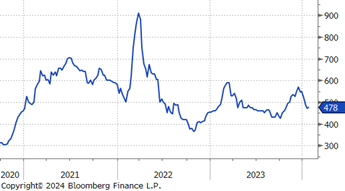
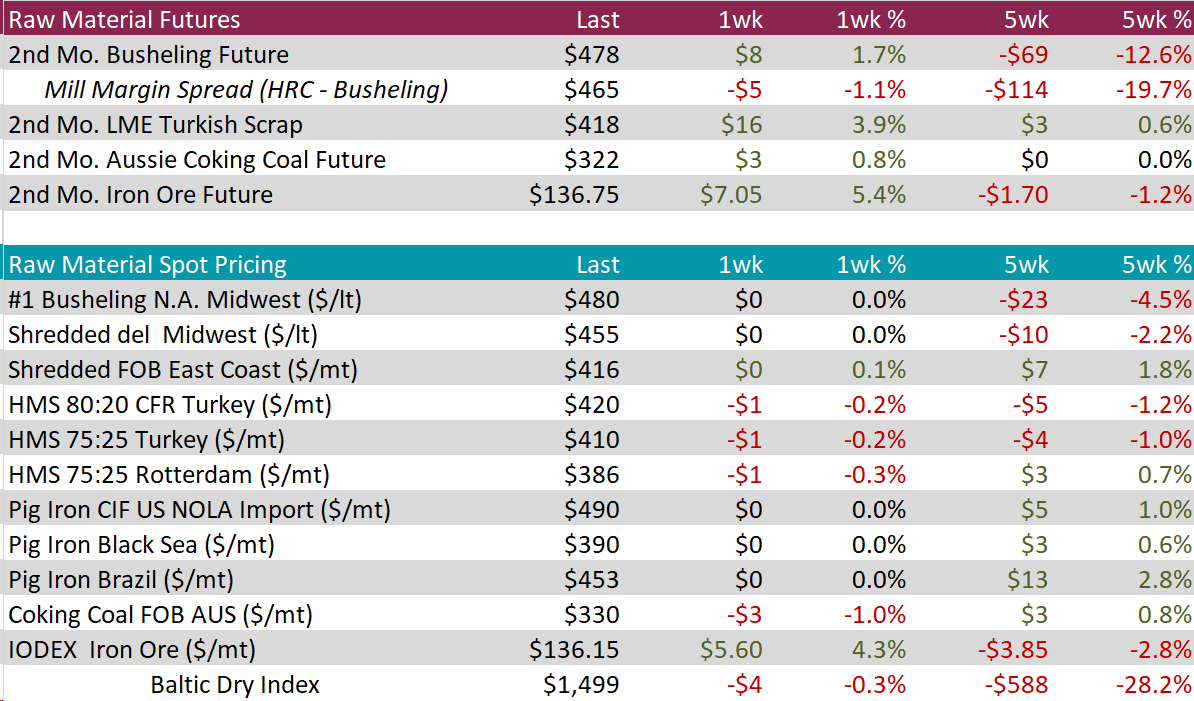
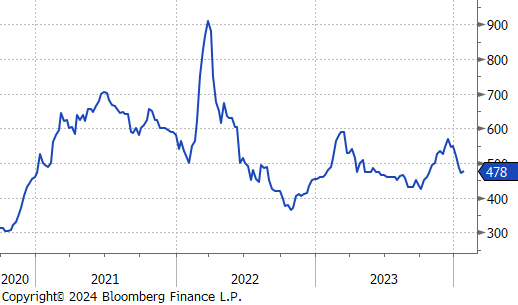
The 2nd month busheling future rose by $8 or 1.7% to $478, increasing for the first time in three-weeks. Meanwhile, the spot price remained unchanged at $480.
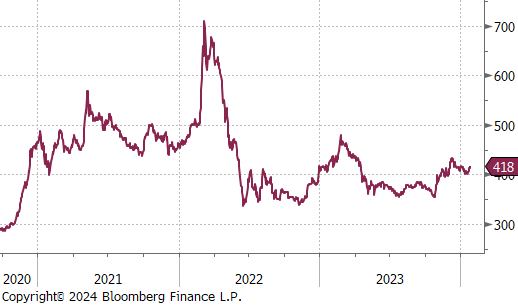
The 2nd month LME Turkish scrap future increased by $16 or 3.9% to $418, recovering from recent price fall from $415 to $401.
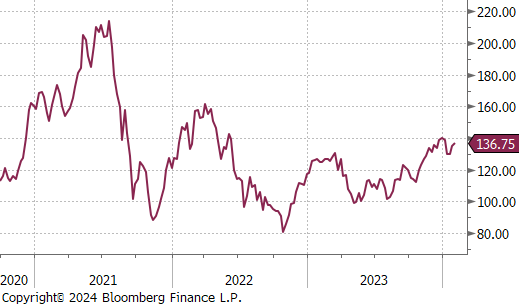
The 2nd month iron ore future was up by $7.05 or 5.4% to $136.75, continuing its rebound from recent price dip to $128.55.
Dry Bulk / Freight
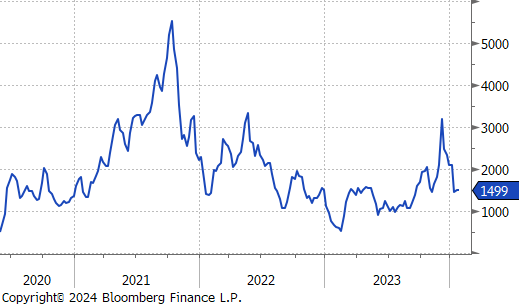
The Baltic Dry Index fell slightly by 4 points or -0.3% to $1,499, steadying after recent significant drop.
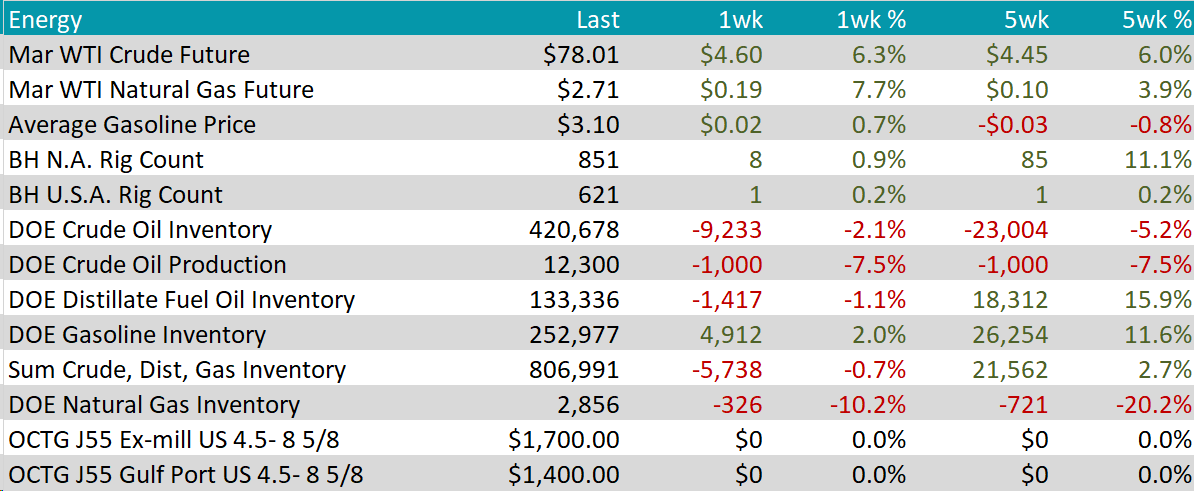
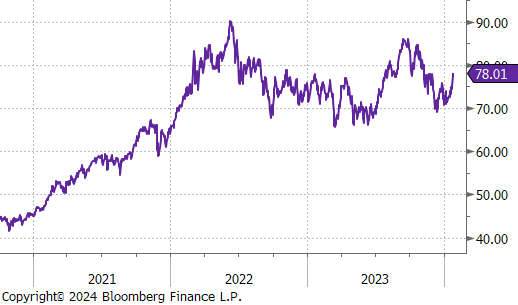
WTI crude oil future gained $4.60 or 6.3% to $78.01/bbl.
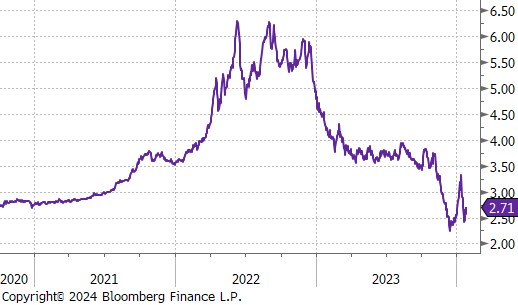
WTI natural gas future gained $0.19 or 7.7% to $2.71/bbl, rebounding from recent price drop.
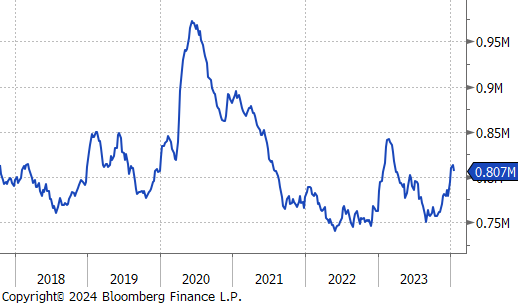
The aggregate inventory level fell slightly by -0.7%, after hitting the highest level seen since March 2023.
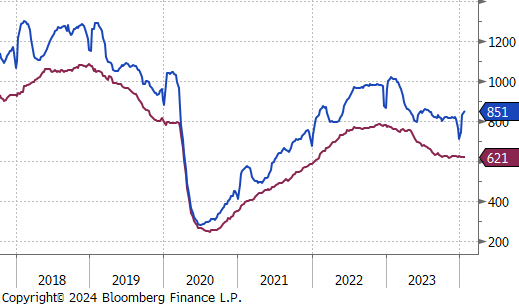
The Baker Hughes North American rig count gained 8 rigs, bringing the total count to 851 rigs. The US rig count also increased, gaining 1 rig, bringing the total count to 621.
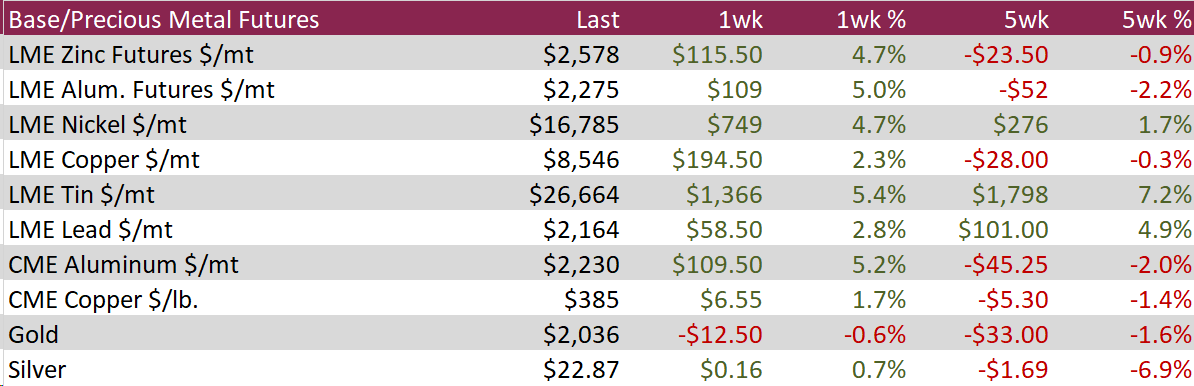
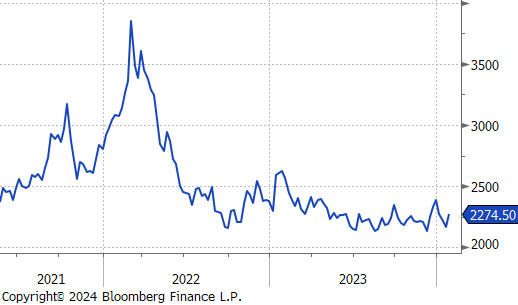
Aluminum rose by $109 or 5.0% to $2,275, recovering from a one-month low of $2,160 seen on January 22nd. This increase came amid reports that the European Union is contemplating a comprehensive ban on aluminum imports from Russia starting late February. In December, the EU had already banned the import of specific aluminum products like wires, tubes, pipes, and foil. However, these restrictions represented only 12% of the EU’s total aluminum imports, leading the industry group European Aluminum to advocate for a more extensive ban. Additionally, market optimism was fueled by China’s announcement of a potential rescue package for its ailing equity market, which is expected to boost demand for base metals.
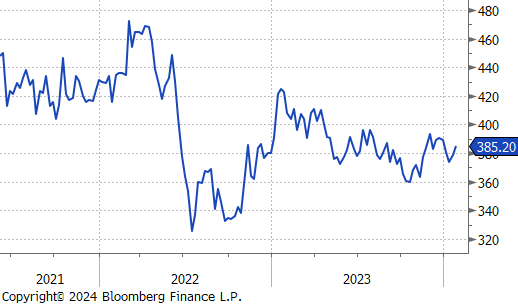
Copper jumped up by $6.55 or 1.7% to $385, the highest in three-weeks. This surge was driven by a weakening US dollar and bolstered by China’s new economic initiatives. The Chinese government announced a plan to reduce its reserve requirement ratio, freeing up approximately 1 trillion Chinese Yuan in liquidity. Furthermore, Beijing’s actions aim to mitigate the impact of diminishing demand, a challenge highlighted by a 50% increase in copper stocks at key warehouses and a significant drop in the Yangshan copper premium this year. Moreover, concerns about the long-term copper supply struggling to meet demand, especially for electrification purposes, have also contributed to the price increase.
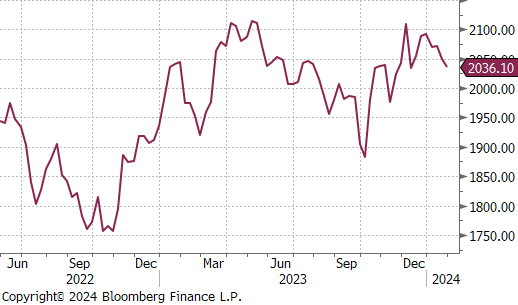
Gold fell by $12.50 or -0.6% to $2,036 as investors evaluated recent U.S. economic data to anticipate the Federal Reserve’s interest rate decisions. In December, the Fed’s primary gauge for spending, the personal consumption expenditure (PCE) index, increased by 2.6% year-over-year and 0.2% month-over-month, aligning with economists’ forecasts. Additionally, core PCE prices rose 2.9% in the year leading up to December, slightly below the predicted 3%, suggesting a slowdown in inflation. In contrast, preliminary GDP data indicated that the U.S. economy grew by an annualized 3.3% in the fourth quarter, demonstrating resilience despite high borrowing costs. While most market analysts expect the Fed to initiate a rate cut in May, they are keenly awaiting Fed Chair Jerome Powell’s upcoming comments for further insights into the potential easing of monetary policy.
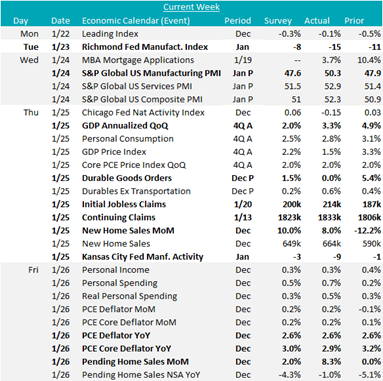
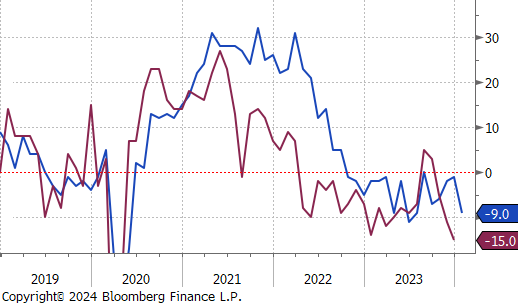
Manufacturing data continues to provided a mixed view on the potential for a near-term industrial recovery. The January readings for Richmond & Kansas City FED Manufacturing Surveys both came in below expectations, -15 vs -8, and -9 vs -3, respectively. The Richmond print was concerning, with expectations of an improvement versus an actual print at its lowest level since February 2023, while KC, which had been showing signs of recovery, fell much further than anticipated. On the other hand, January’s preliminary S&P Global US Manufacturing PMI index printed significantly above market expectations and improved from the prior month, 50.3 vs 47.6, and 50.3 vs 47.9.
The housing market was further buoyed by December’s New Home Sales and Pending Home Sales, which both showed increased growth, 8.0% vs -12.2%, and 8.3% vs 0.0%. This was a strong signal for future activity, with pent-up demand clearly coming to the market as the 30-year rate continues to ease.
Another blockbuster datapoint was the preliminary data for 4th Quarter GDP Annualized QoQ, which showed an expansion of 3.3%, far surpassing the anticipated 2.0% growth. While this represents a decrease from the previous 4.9%, it still indicates significant economic growth. Furthermore, the PCE Core Deflator, a key inflation indicator, rose by just 2.9%, below the forecasted 3.0% and reaching its lowest rate since March 2021. In contrast, the preliminary December Durable Goods Orders was less encouraging, showing no growth at 0.0%. This was a stark change from the 5.4% increase seen in November and fell short of the expected 1.5%.
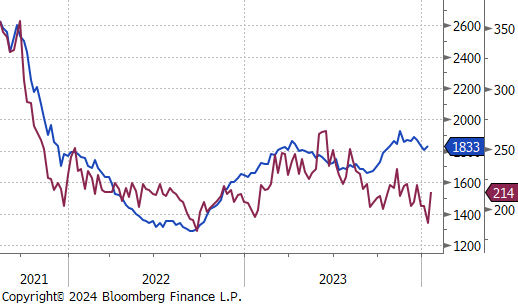
Initial and continuing claims both came in above expectations, 214k vs 200k, and 1,833k vs 1,823k, respectively. This is a clear signal that the labor market is cooling, with initial claims rebounding significantly from the 16-month low touched the prior week.