Flack Capital Markets | Ferrous Financial Insider
January 31, 2025 – Issue #469
January 31, 2025 – Issue #469
Overview:
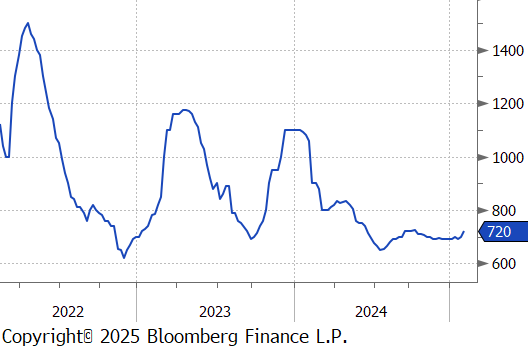
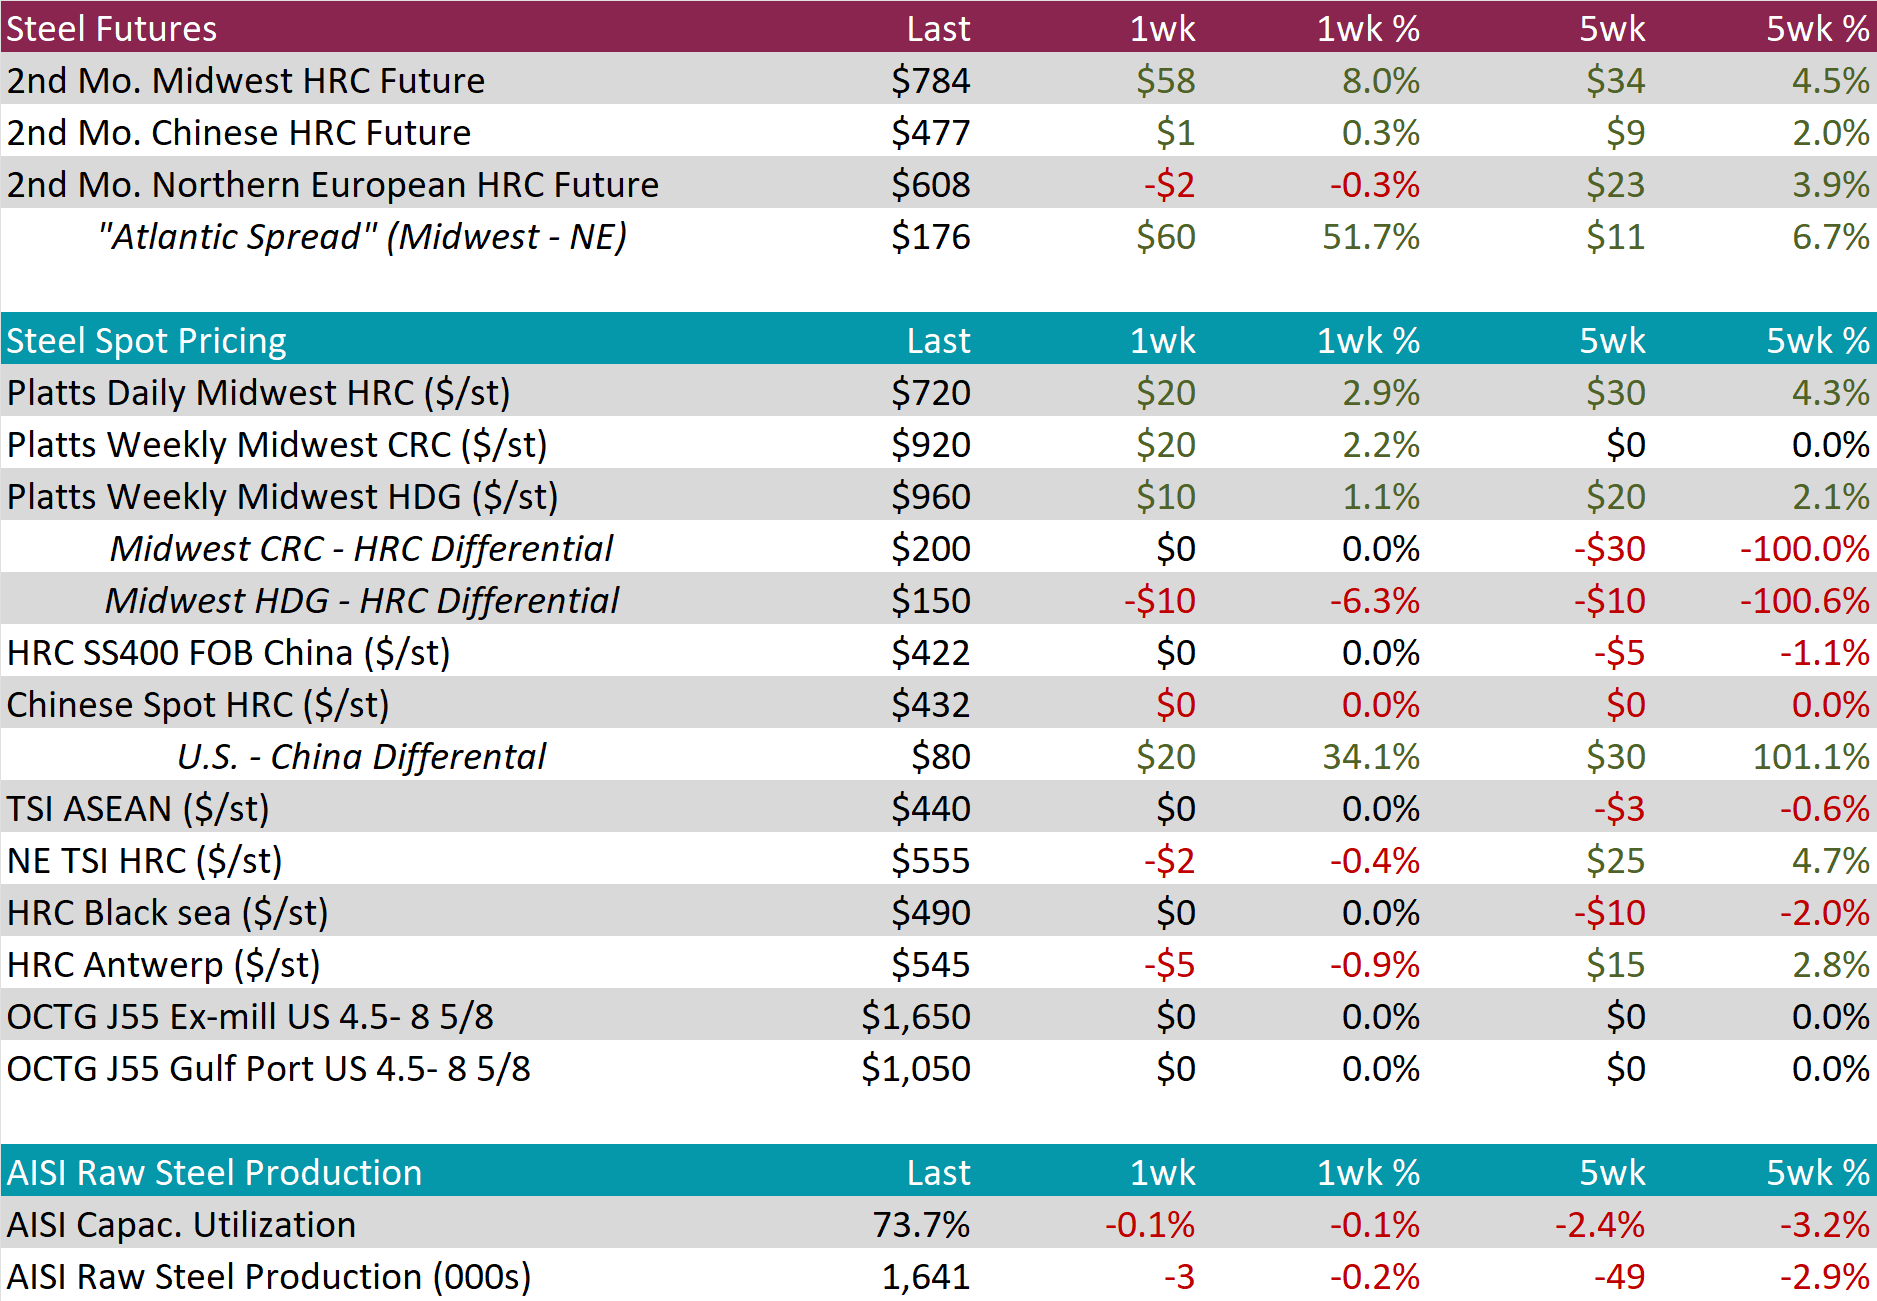
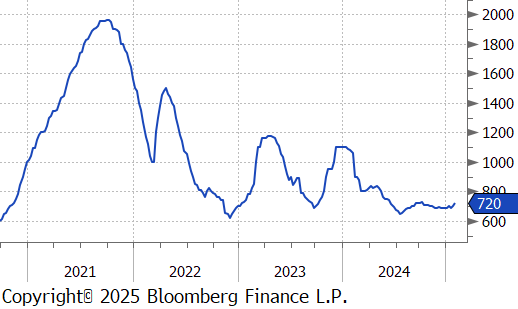
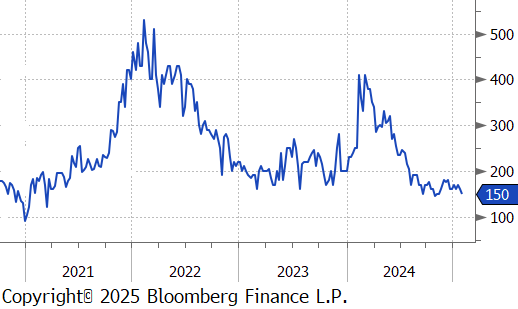
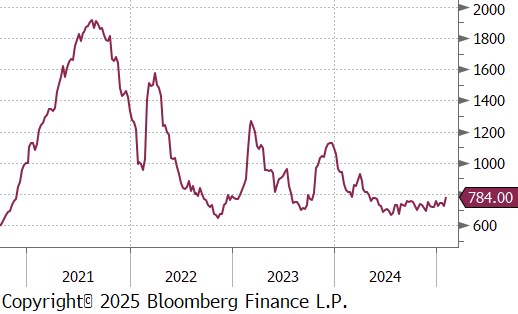
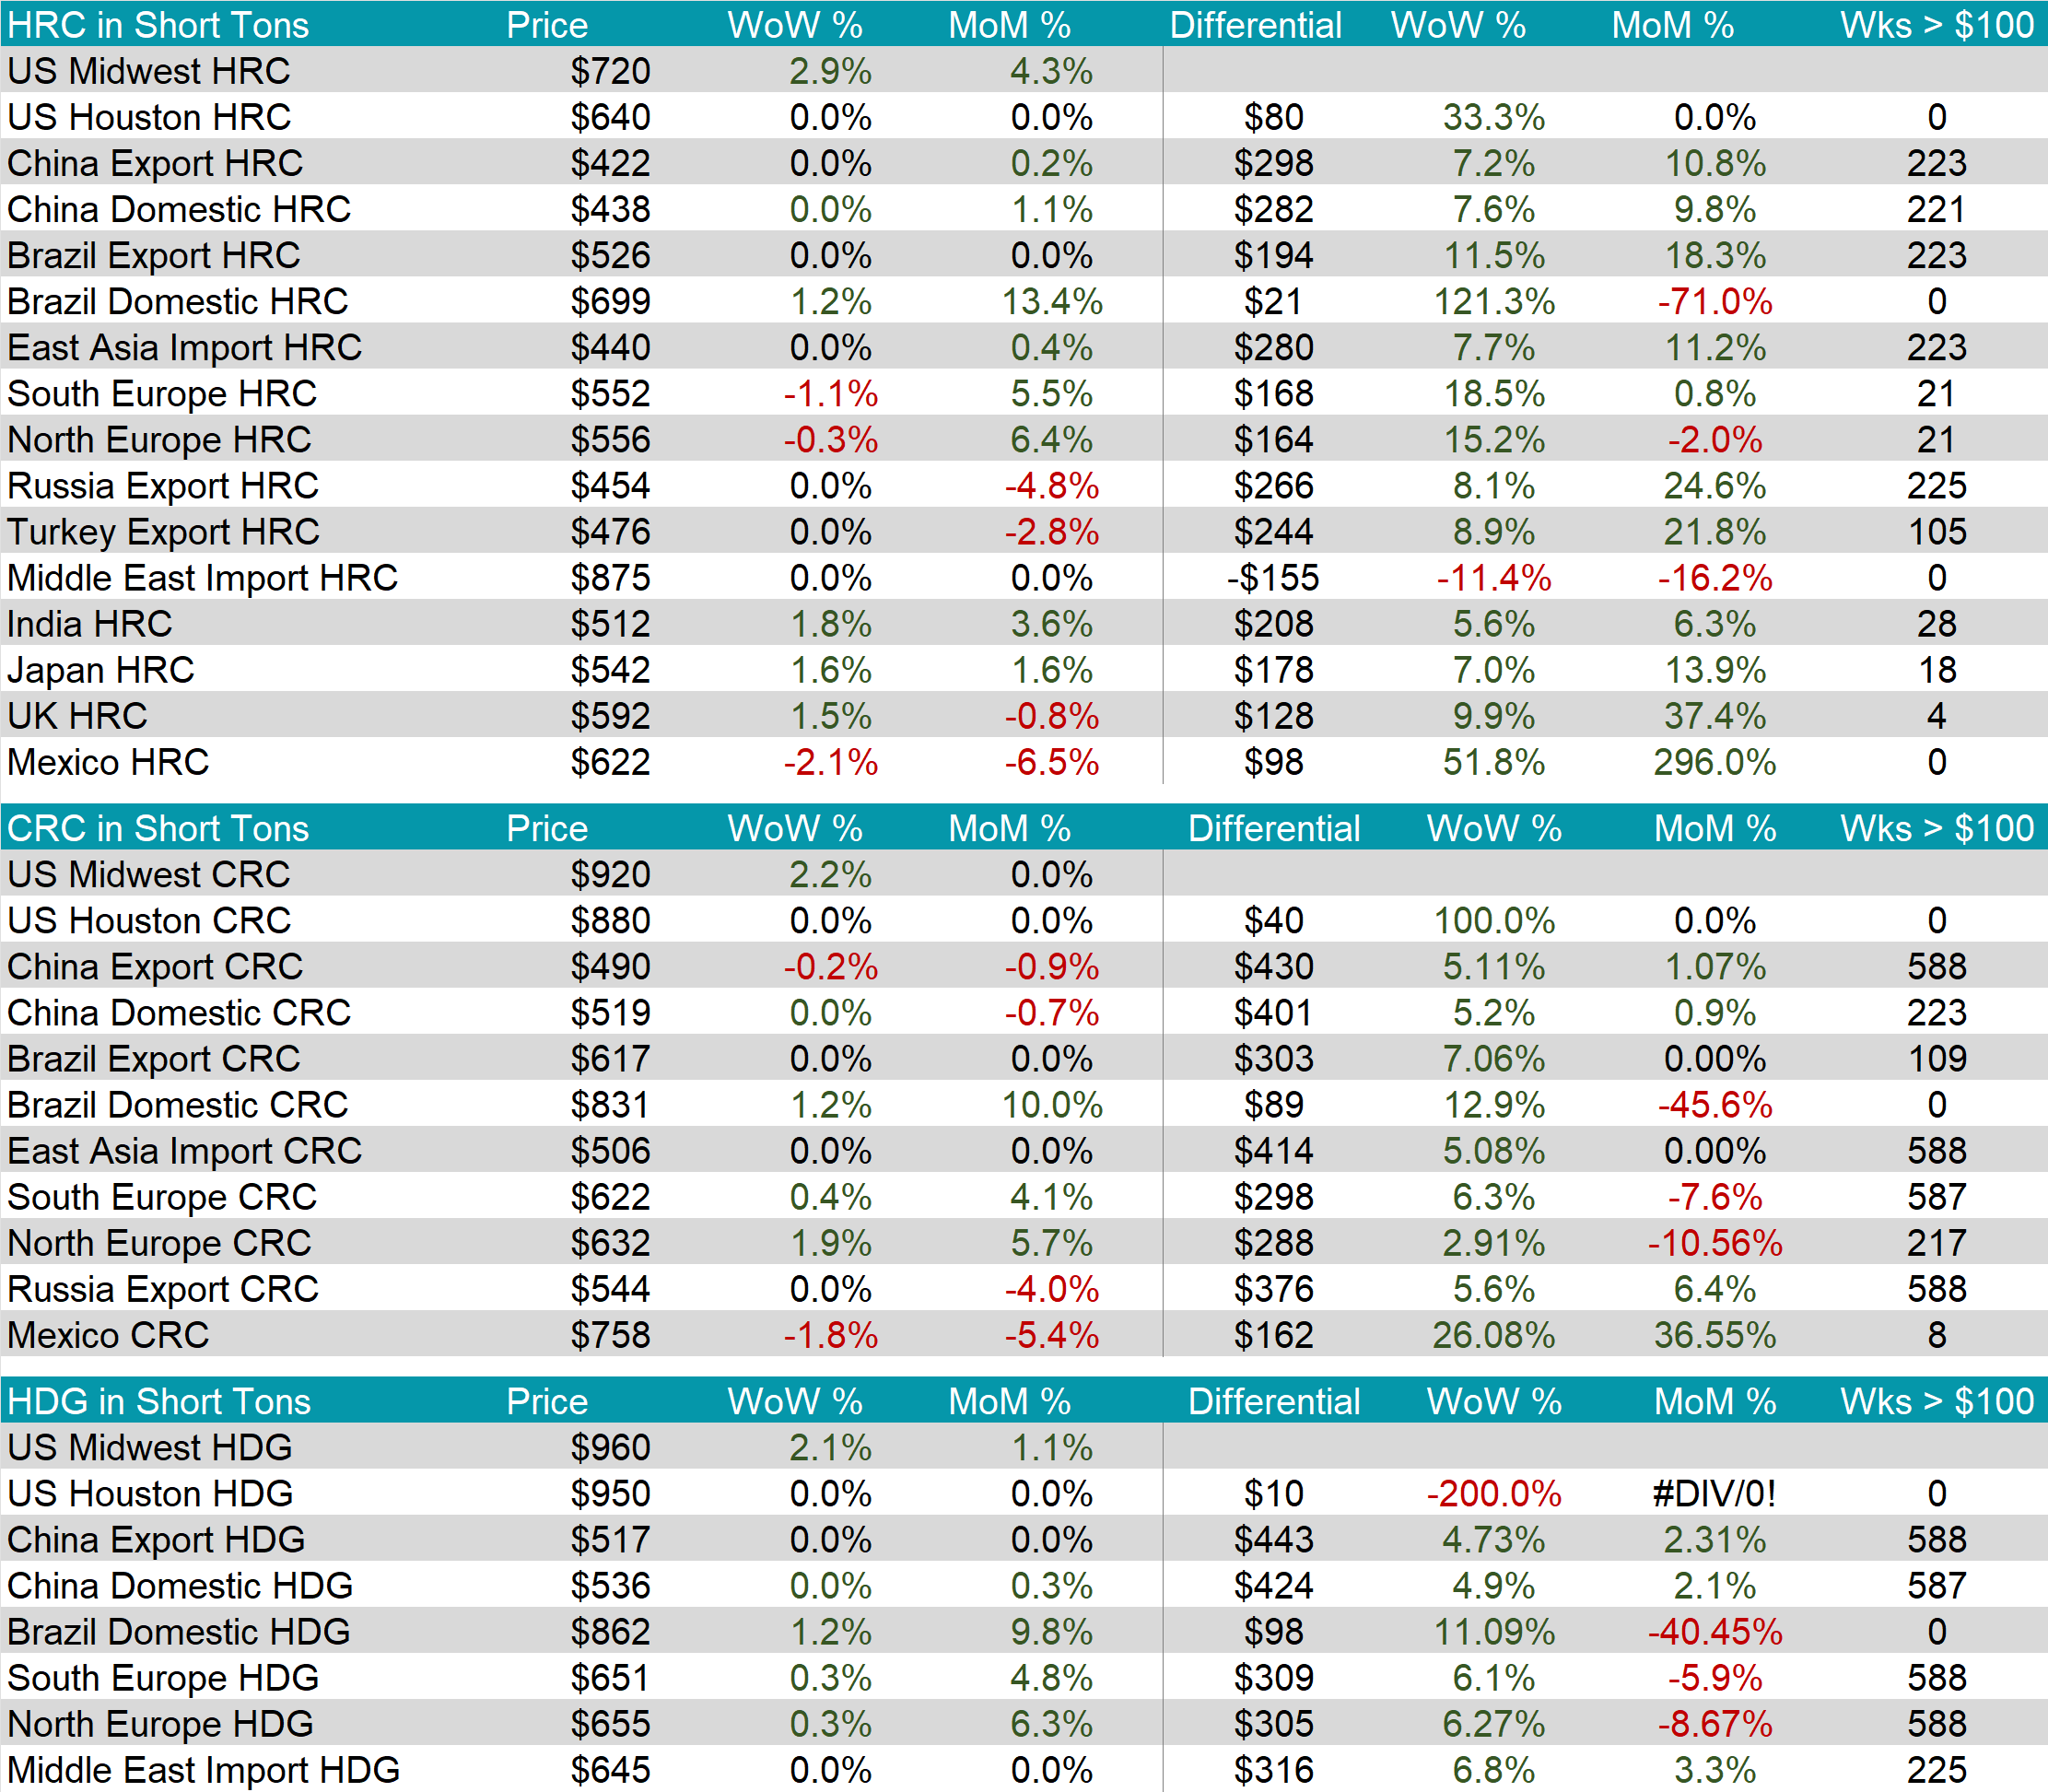
The HRC spot price jumped by $20 or 2.9% to $720, marking the second consecutive week of increases and the highest price since October. At the same time, the HRC 2nd month future soared by $58 or 8.0% to $784, notably rebounding to the highest price since May.
Tandem products both experienced rises, CRC growing by $20, while HDG inched up by $10, resulting in the HDG – HRC differential to slip by $10 or -6.3% to $150.
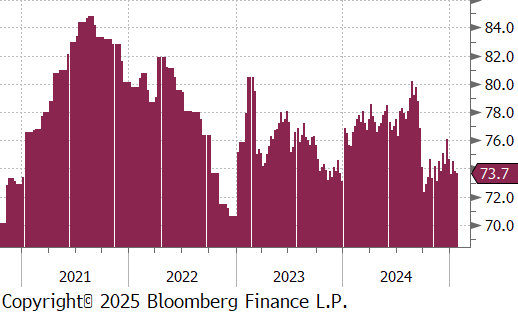
Mill production continued to ease, with capacity utilization ticking down by -0.1% to 73.7%, bringing raw steel production down to 1.641m net tons.
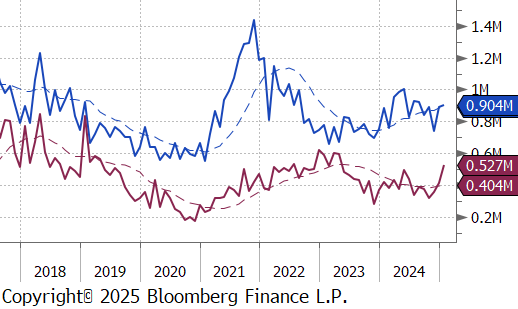
January Projection – Sheet 904k (up 12k MoM); Tube 527k (up 116k MoM)
December Census – Sheet 892k (up 150k MoM); Tube 411k (up 51k MoM)
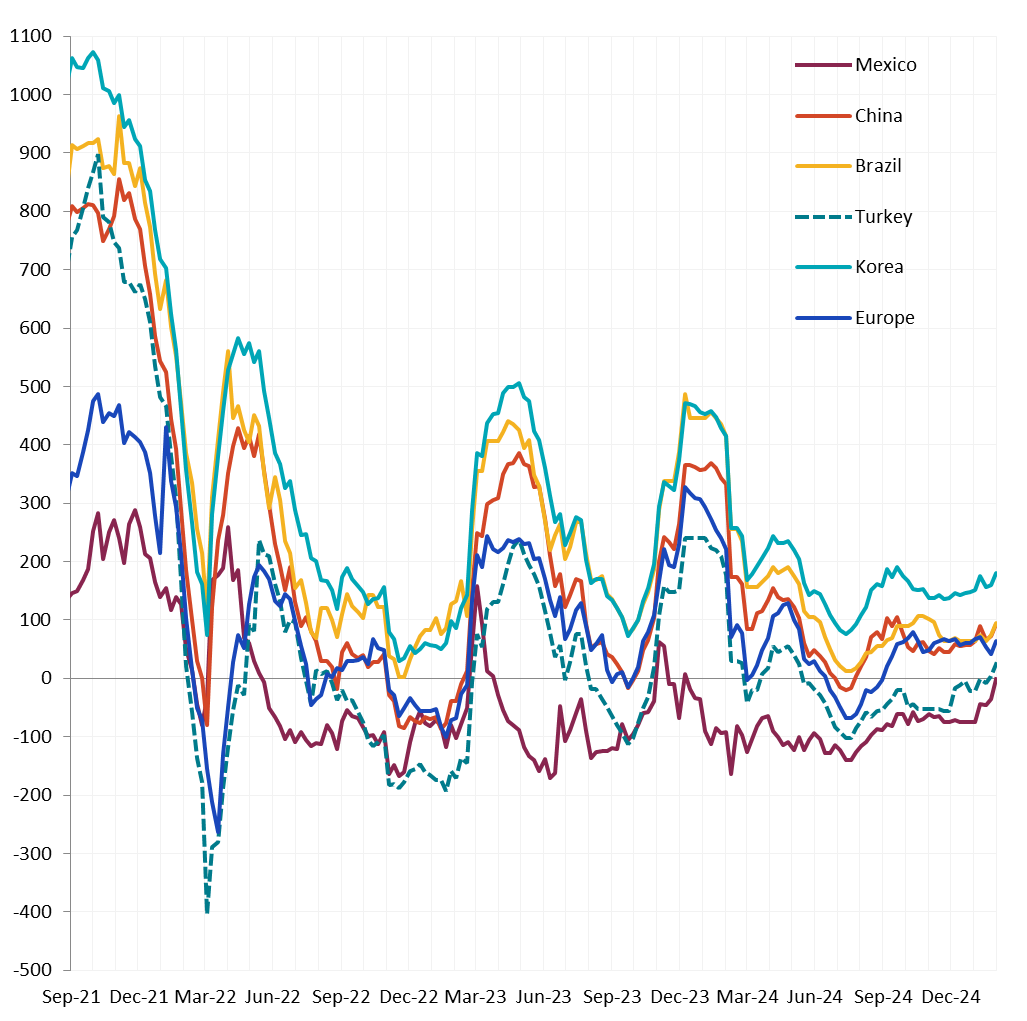
All watched global differentials expanded this week, with North Europe slipping by -0.3%, while all other held steady at the US HRC price jumped by 2.9%.
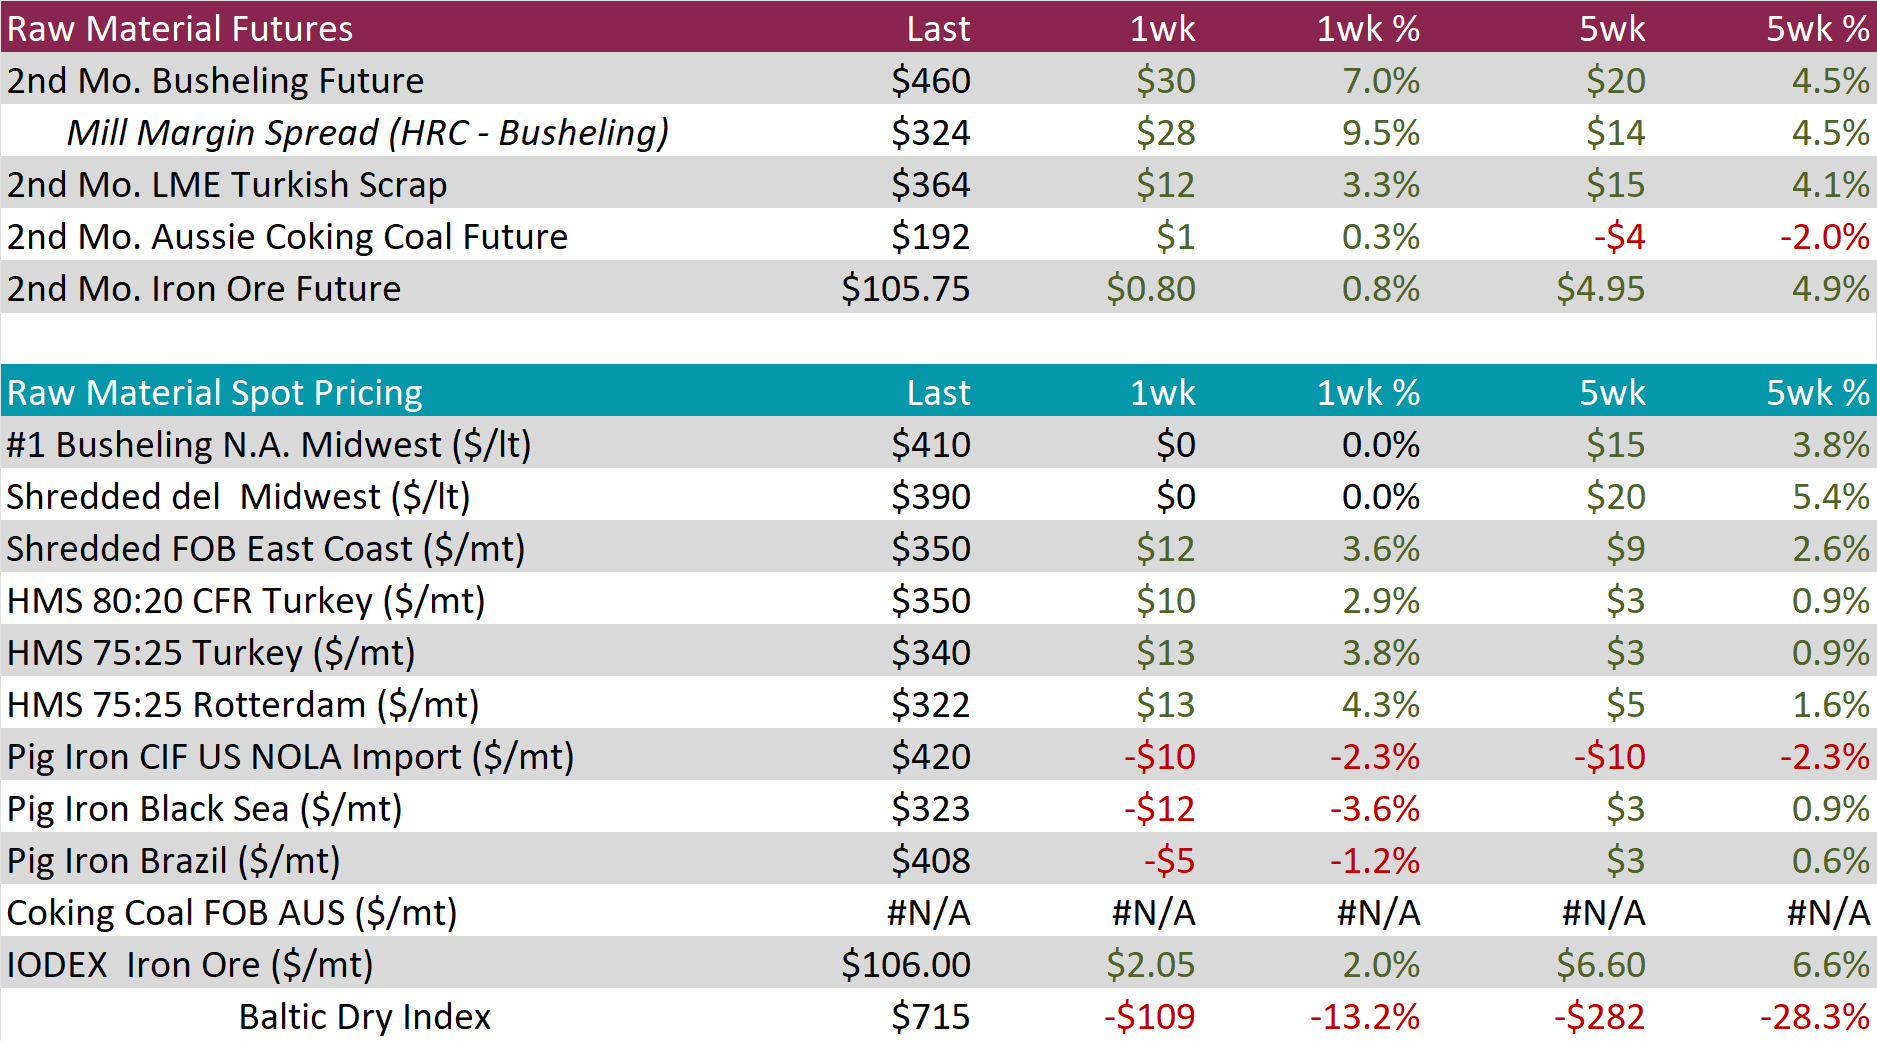
Scrap
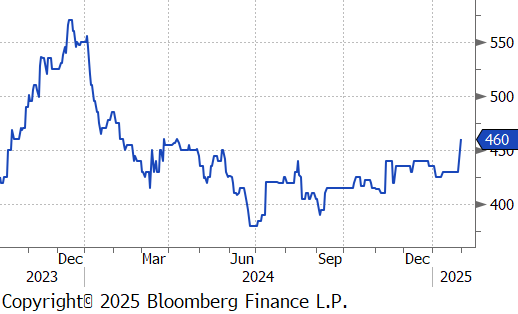
The 2nd month busheling future surged by $30 or 7.0% to $460, hitting the highest price since February.
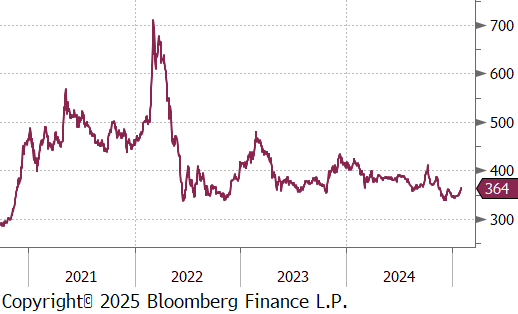
The LME Turkish scrap 2nd month future jumped by $12 or 3.3% to $364, marking the third consecutive week of increases and reaching the highest level since November.
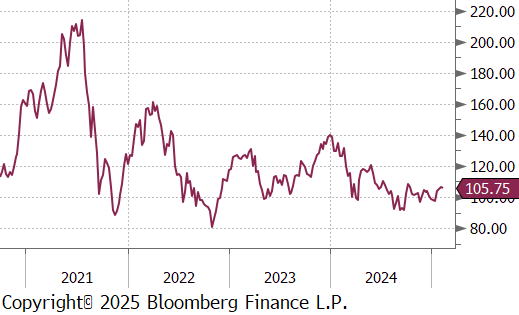
The iron ore 2nd month future inched up by $0.80 or 0.8% to $105.75, marking the third consecutive week of gains and the highest price since November.
Dry Bulk / Freight
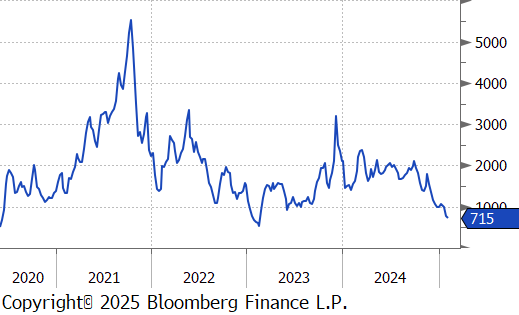
The Baltic Dry Index continued to fall, slipping by $109 or -13.2% to $715. This marks the second consecutive week of declines and the lowest level since February 2023.
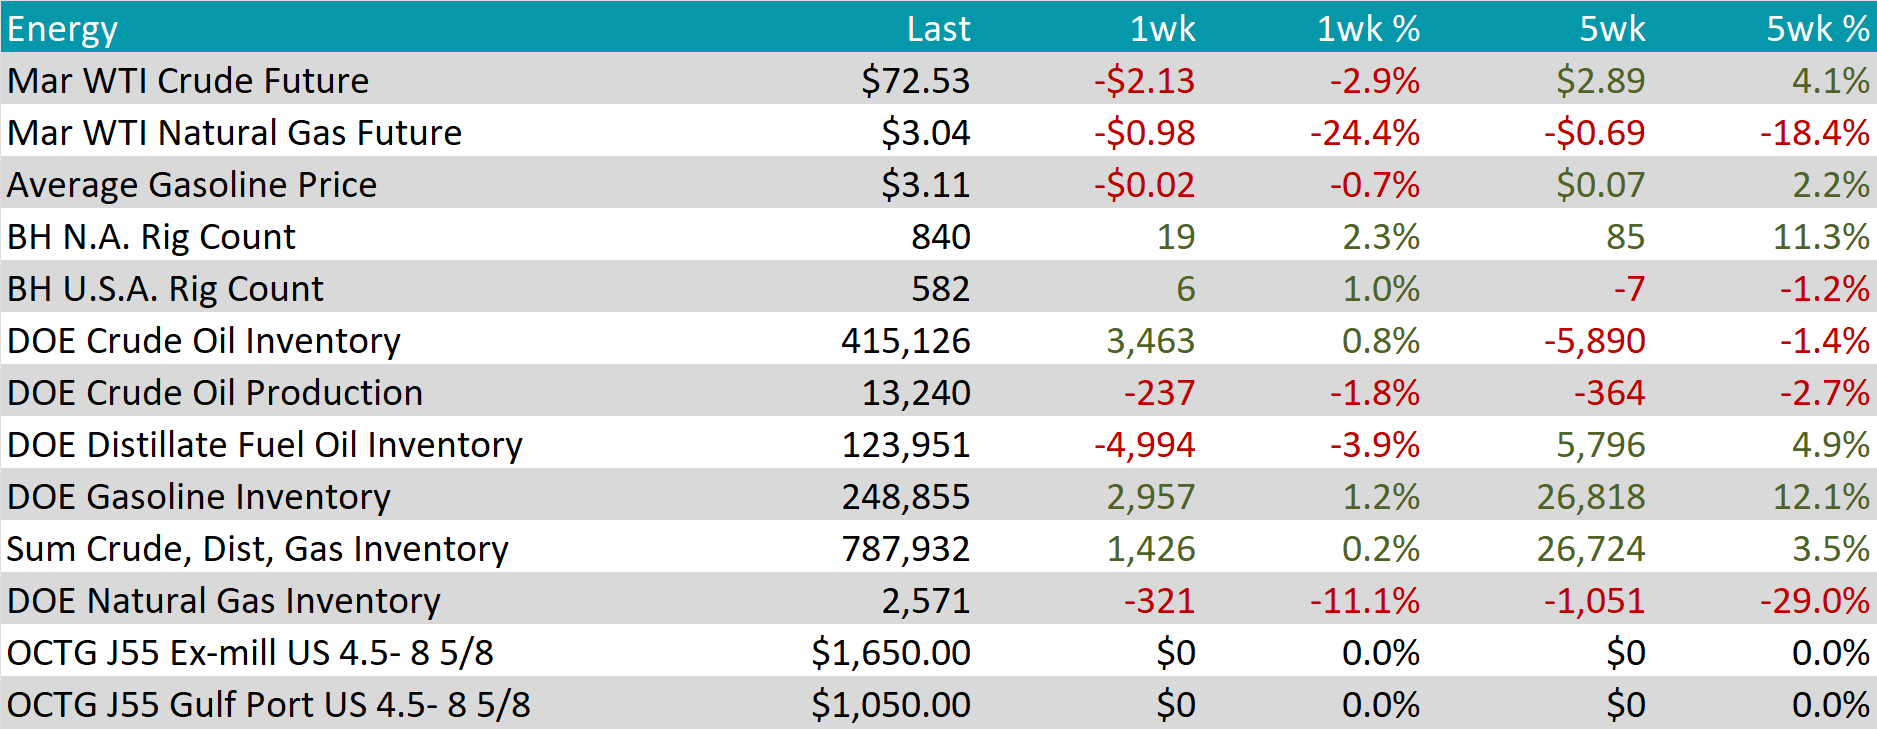
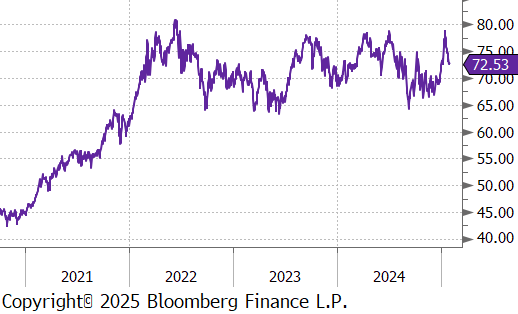
WTI crude oil future lost $2.13 or -2.9% to $72.53/bbl.
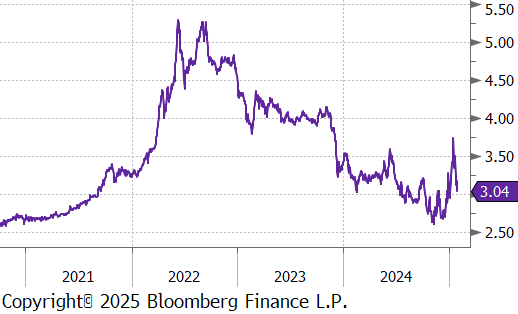
WTI natural gas future lost $0.98 or -24.4% to $3.04/bbl.
The aggregate inventory level experienced an increase of 0.2%.
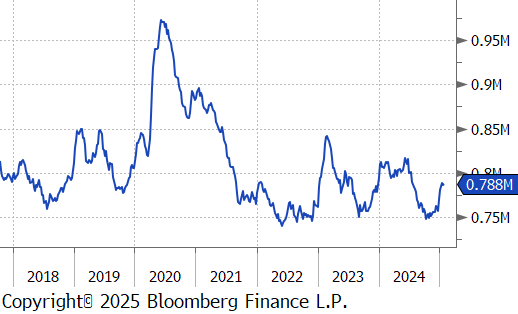
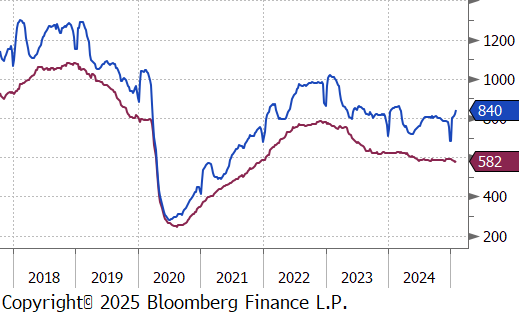
The Baker Hughes North American rig count gained 19 rigs, bringing the total count to 840. Similarly, the US rig count made gains, increasing by 6 rigs, bringing the total count to 582.
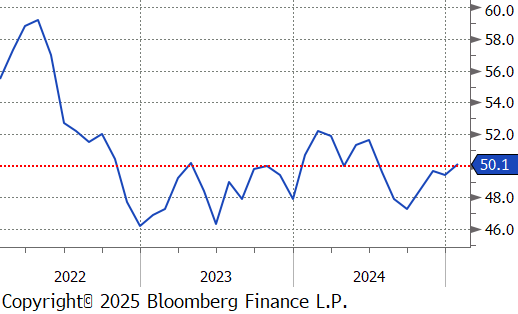
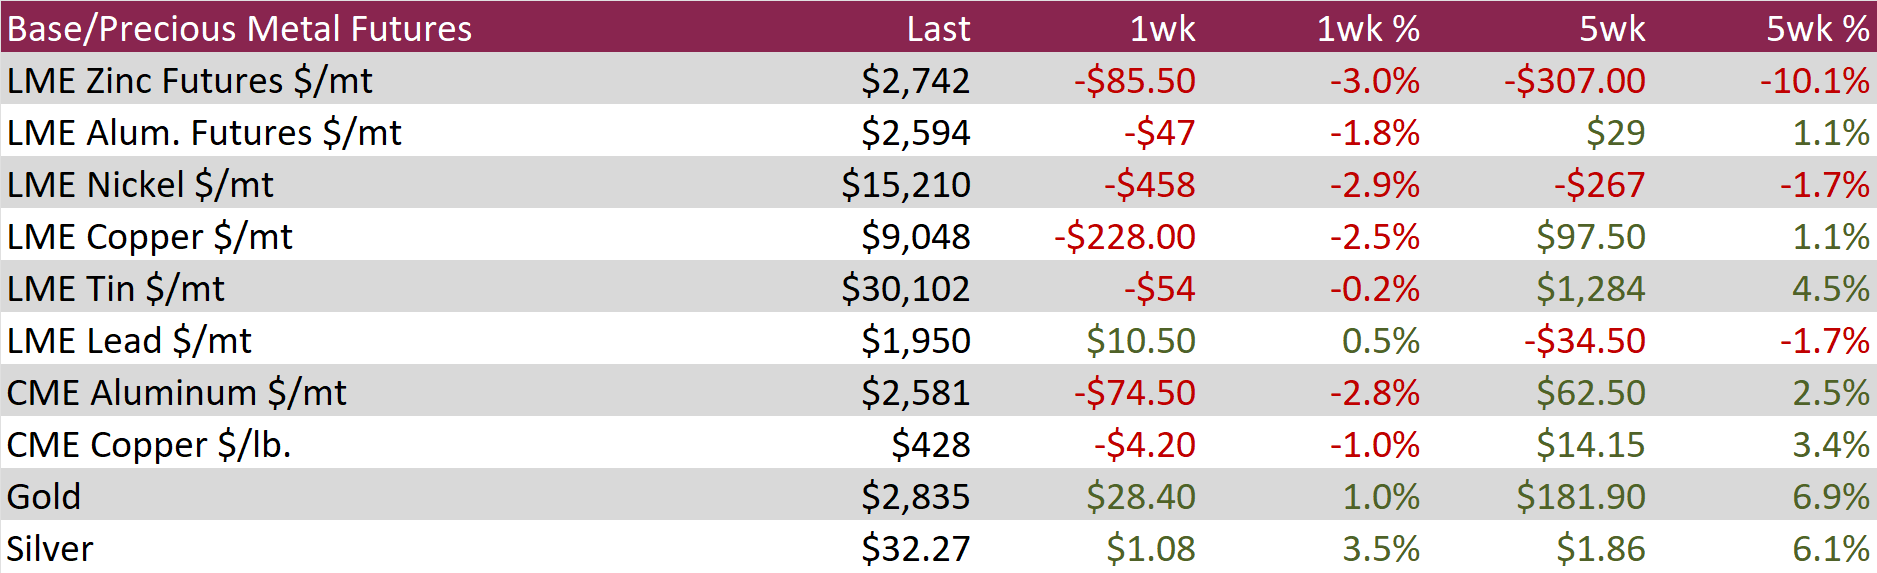
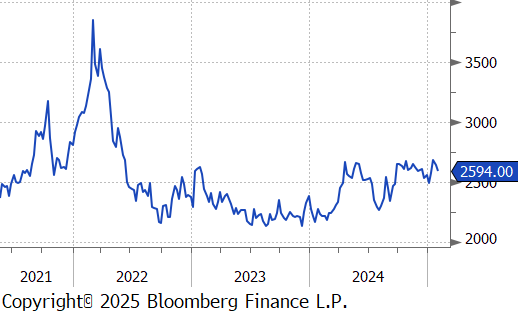
Aluminum futures declined by $47 or -1.8% to $2,594 as weak demand expectations outweighed concerns about tighter global supply. In China, the official manufacturing PMI for January showed a sharp contraction, undermining earlier hopes that improved credit conditions would drive economic activity and boost industrial metal demand. Adding to the bearish sentiment, President Trump threatened to impose tariffs on aluminum and other key base and ferrous metals, dampening the outlook for US demand. Meanwhile, on the supply side, China produced a record 44 million tons of aluminum in 2024, nearing the government-imposed 45-million-ton cap set in 2017 to limit excess supply and curb carbon emissions. Additionally, the European Union is set to sanction Russian primary aluminum imports in its upcoming package, further consolidating the phase-out of Russian metal from global markets.
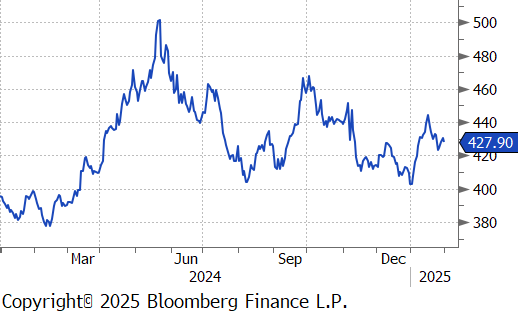
Copper futures edged down by $4.20 or -1.0% to $428 as fresh US tariffs fueled fears of global trade disruptions, triggering a broad selloff in risk assets. Over the weekend, Trump imposed 25% tariffs on imports from Mexico and Canada, along with a 10% levy on Chinese goods, prompting retaliatory measures from affected nations. These developments have heightened concerns over weaker global growth, rising inflationary pressures, and the potential for fewer interest rate cuts from the Federal Reserve. In China, the world’s top copper consumer, a private survey showed that January’s manufacturing activity expanded at a slower-than-expected pace, with foreign orders contracting amid persistent trade uncertainties. Although Chinese markets remained closed for the Lunar New Year holiday, they are set to reopen on Tuesday, potentially influencing copper price action.
Precious Metals
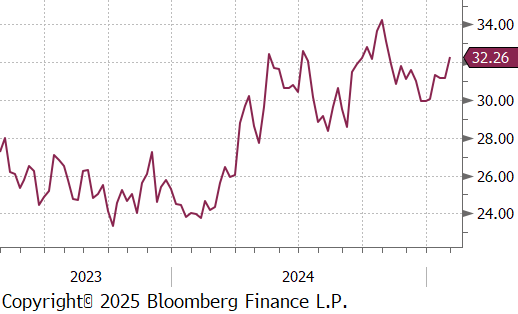
Silver jumped by $1.08 or 3.5% to $32.27, hovering near its highest level since early December. Stronger-than-expected US manufacturing data from the ISM signaled long-awaited momentum in factory activity, reinforcing the outlook for silver’s industrial demand, particularly in electrification technologies. On the supply side, the Silver Institute projected a fifth consecutive year of market deficits in 2025, driven by robust industrial usage and retail investment, outweighing weaker demand from jewelry and silverware sectors.
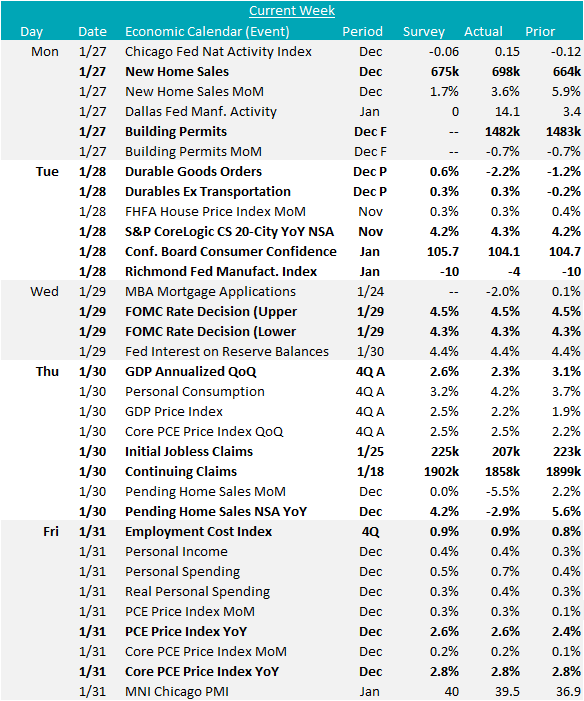
December new home sales beat the expected increase of 1.7% and rose 3.6% to 698k. Yearly home values measured by S&P CoreLogic came in at 4.3% for the 20 largest US cities, slightly above the expected flat print of 4.2%, further signaling that the underlying demand for housing is strong. On the other hand, pending home sales decreased -2.9% YoY, well below the expected increase of 4.2%. More than anything else, this underscore the fact that even though we are optimistic on new residential construction, the housing sector overall will be volatile.
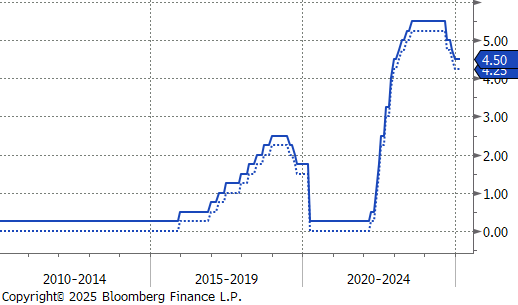
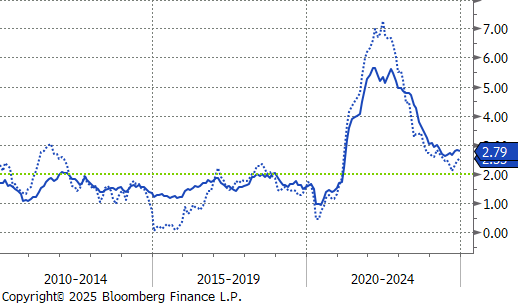
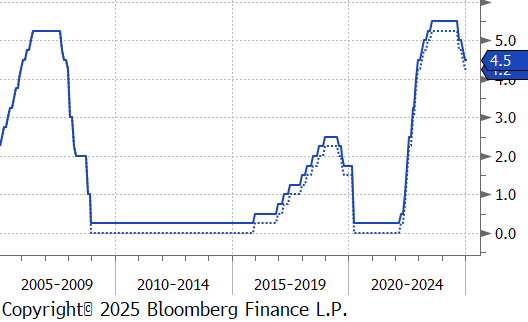
On the FOMC side, there was a unanimous vote to keep Fed Funds interest rates steady at 4.25-4.5%, and a slightly more hawkish statement compared to December. In the press conference, Chair Jerome Powell highlighted the fact that the economy and labor market is in great shape, and that they believe inflation is still on a downward trajectory. On that note, Topline PCE (Personal Consumer Expenditure) rose to 2.6% YoY, in line with market expectations, while Core PCE (ex. Food & Energy) was unchanged at 2.8% YoY.
Finally, 4Q24 GDP came in at 2.3% QoQ, slightly below expectations of 2.6%, but it continues to show above potential growth. Under the hood, the consumer continues to impress, with personal consumption driving growth at the fastest pace since 1Q23. Destocking inventories was the primary drag, pushing the topline number down by 0.9%.