Flack Capital Markets | Ferrous Financial Insider
July 21, 2023 – Issue #389
July 21, 2023 – Issue #389
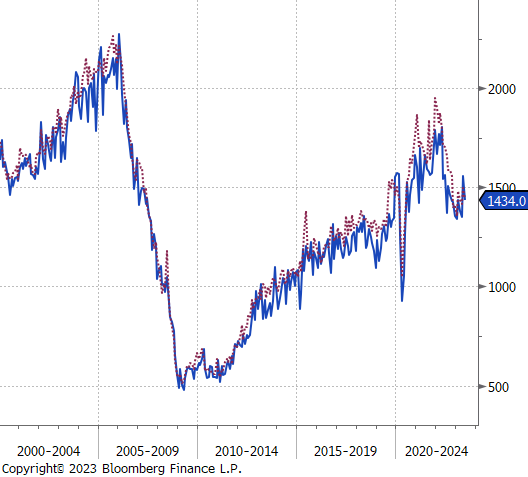
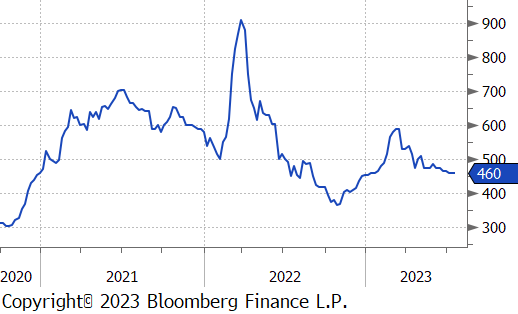
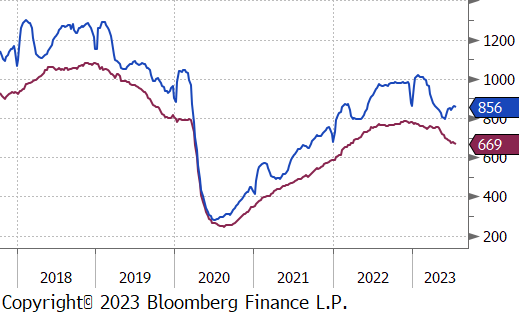
One of the most interesting market phenomena, given the rapid rise of interest rates, has been residential construction. The chart on the right shows updated data for housing starts (blue) and building permits (purple).
After it became evident that the FED was poised to embark on a significant hiking cycle, housing starts and permits were among the first market data points to show signs of decline. Given the close relationship between residential construction and interest rates, the subsequent downturn didn’t catch anyone by surprise, and many saw it as a potential indicator for the rest of the industrial sectors. However, what did surprise observers was the stabilization that occurred in 2022, followed by a noteworthy recovery.
Several factors contribute to this resilience. Firstly, there has been a notable lack of investment in new houses during the preceding decade, resulting in a substantial pent-up demand within the sector, buoyed by positive demographics. Additionally, the sharp increase in interest rates has led to a situation where many households are now locked into their existing homes, leading to record-low inventory availability. Looking ahead, we expect existing home availability to remain tight, bolstered by the broader economy’s resilience, which reduces the likelihood of significant interest rate cuts through the end of the year. As a result, our outlook remains optimistic for both housing starts and permits, as stable demand continues to outpace current supply.
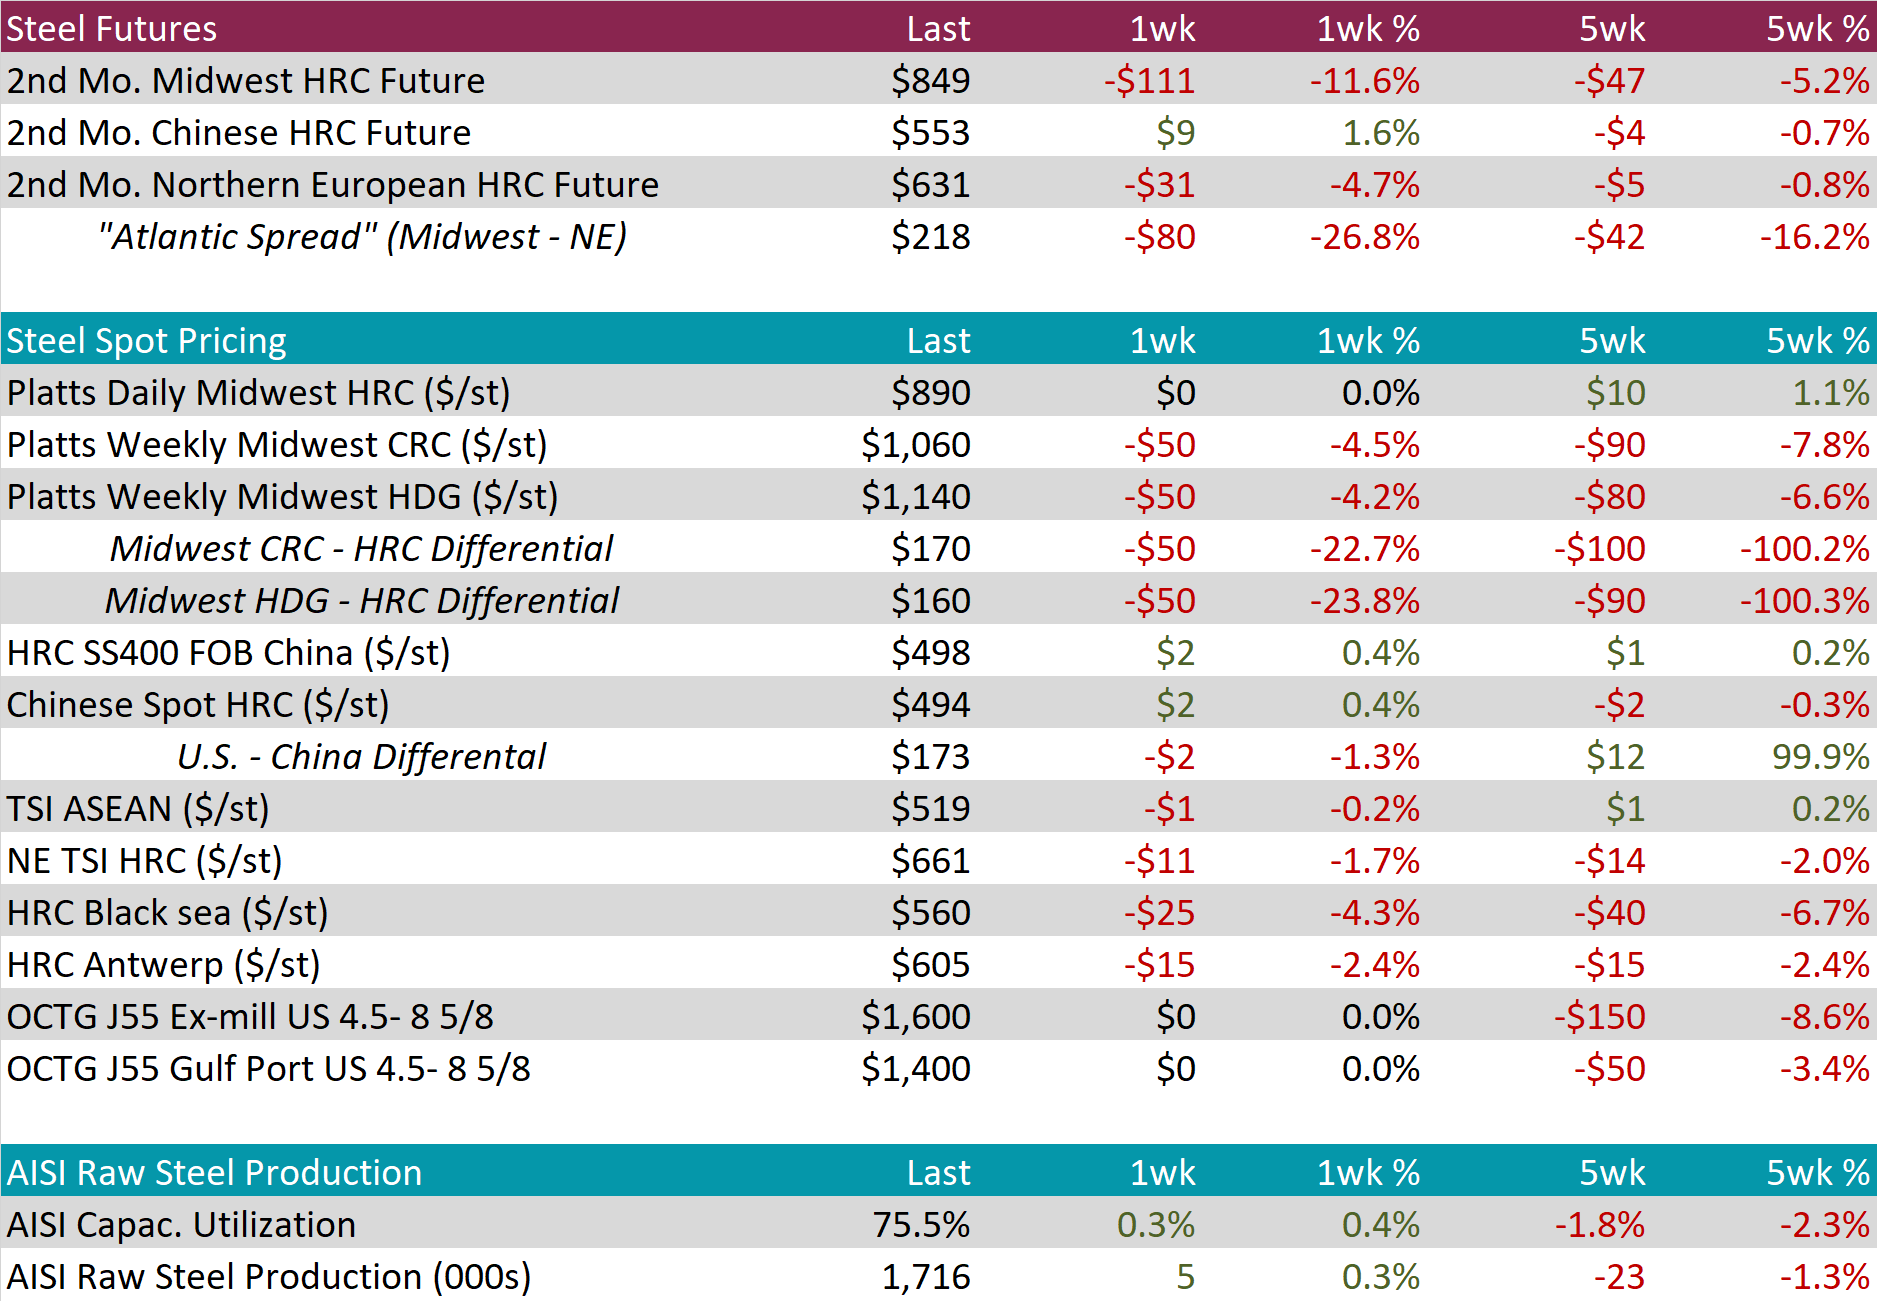
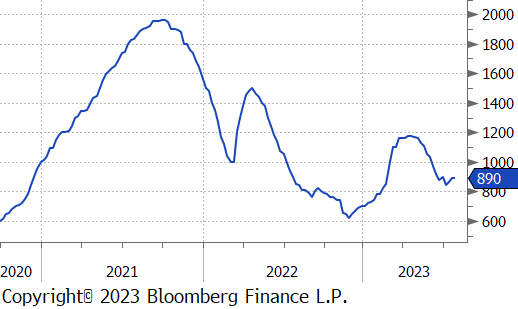
The HRC spot price was unchanged this week, however, all expectations are for lower prices in the near-term, driven by a clear signal that domestic producers were unable to achieve their target of $900-950. The futures market reacted significantly, with the 2nd month future down $111, or 11.6% on the week.
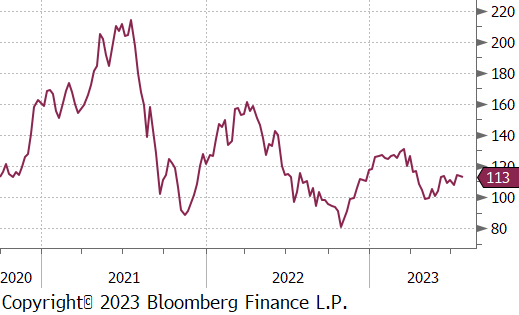
Even though the assessment for HRC held up, the same can not be said for tandem products, with CRC and HDG each down $50, respectively. This drove the HDG-HRC spread to a recent low of $160.
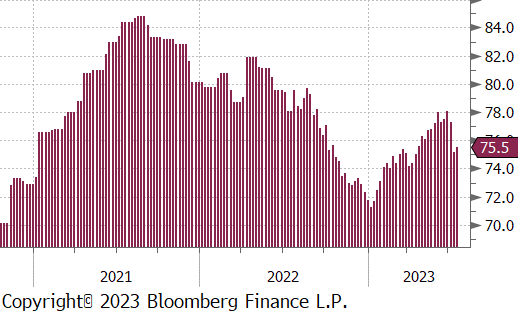
Mill production ticked higher this week, with capacity utilization up 0.3% to 75.5%. The current level remains within a neutral range, providing flexibility to increase or decrease as the demand outlook for the fall becomes clearer.
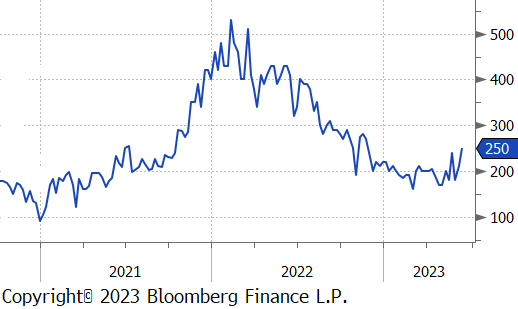
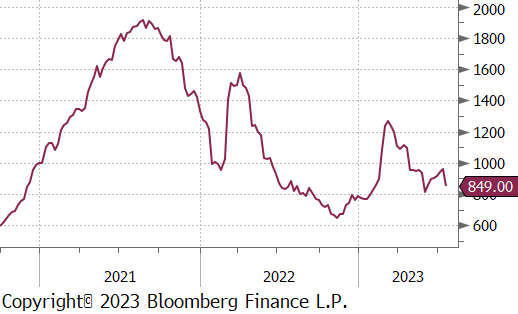
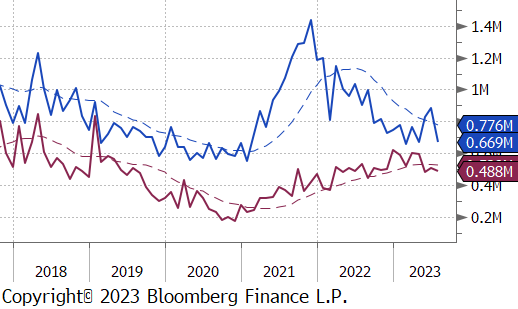
July Projection – Sheet 669k (down 214k MoM); Tube 488k (down 17k MoM)
June Projection – Sheet 882k (up 24k MoM); Tube 506k (up 54k MoM)
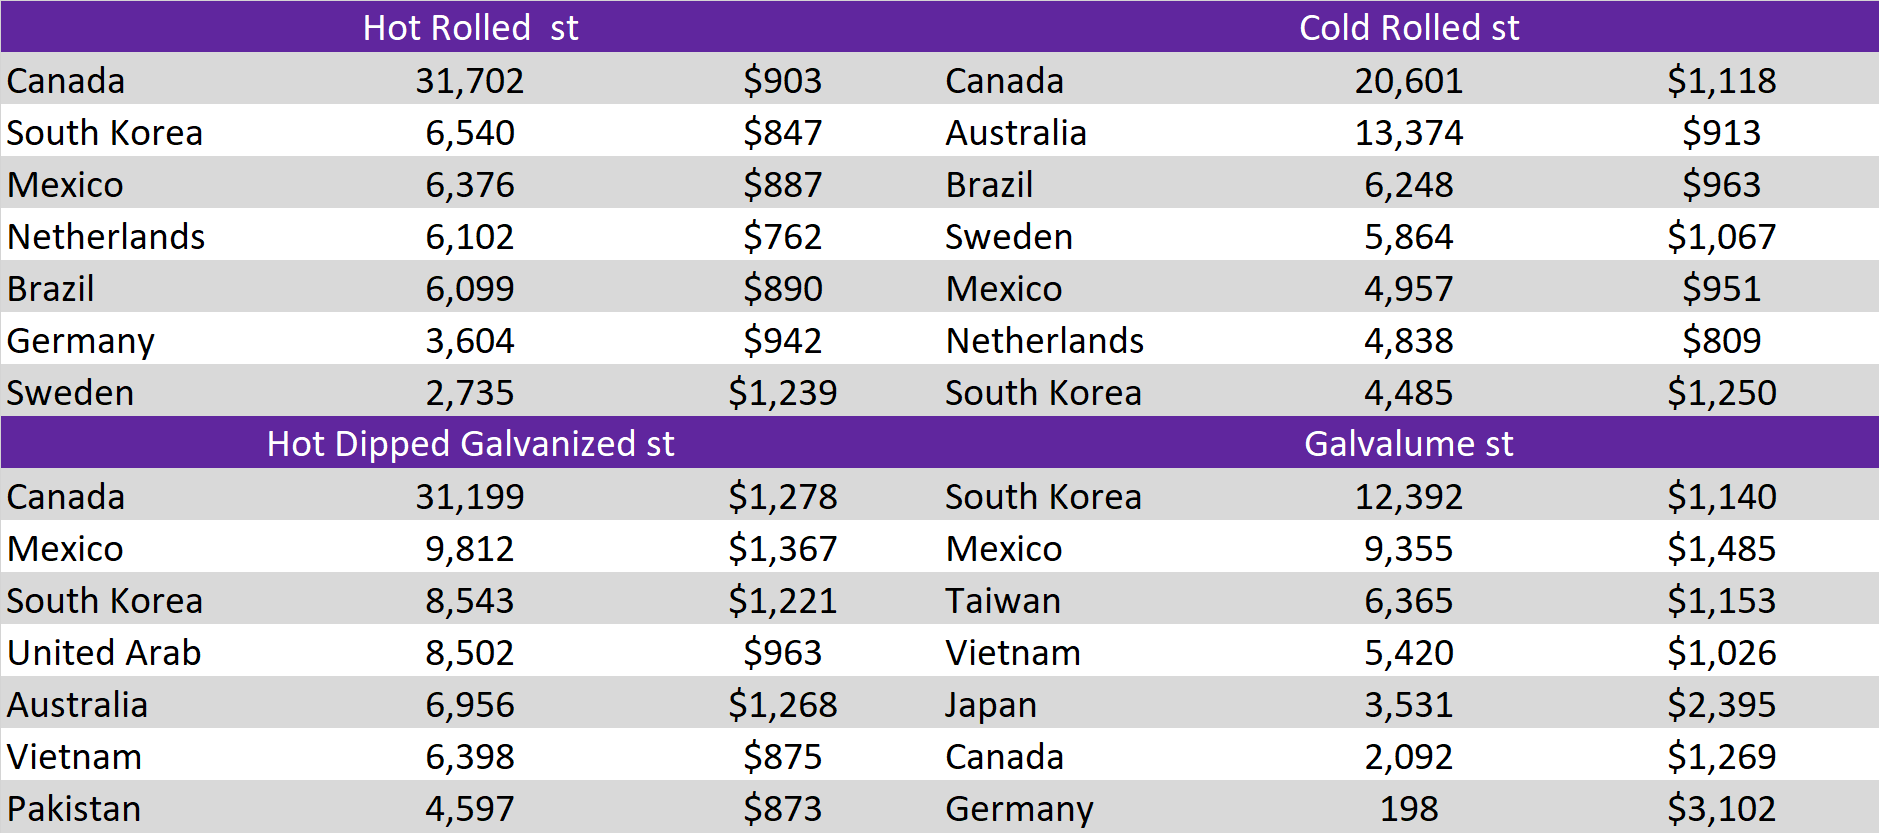
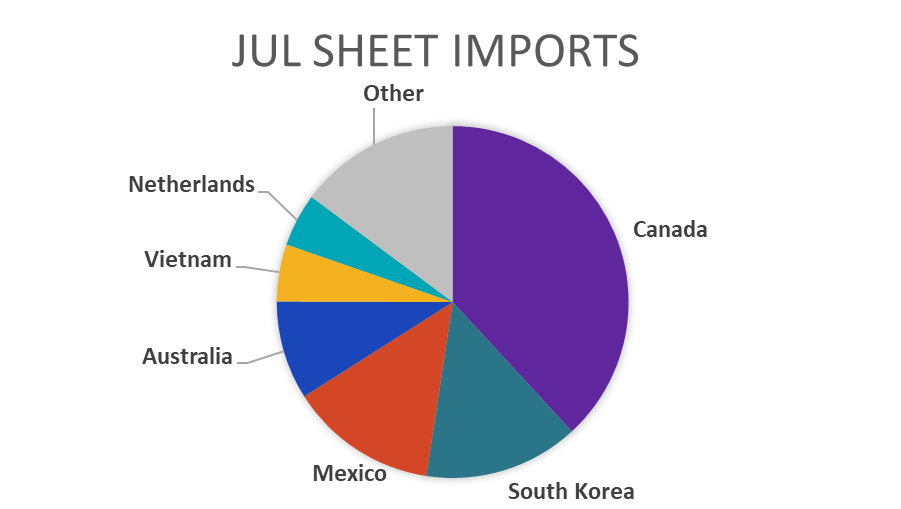
Expectations via license data for July continue to point to a sharp reversal from the uptrend, near the recent lows for Sheet arrivals.
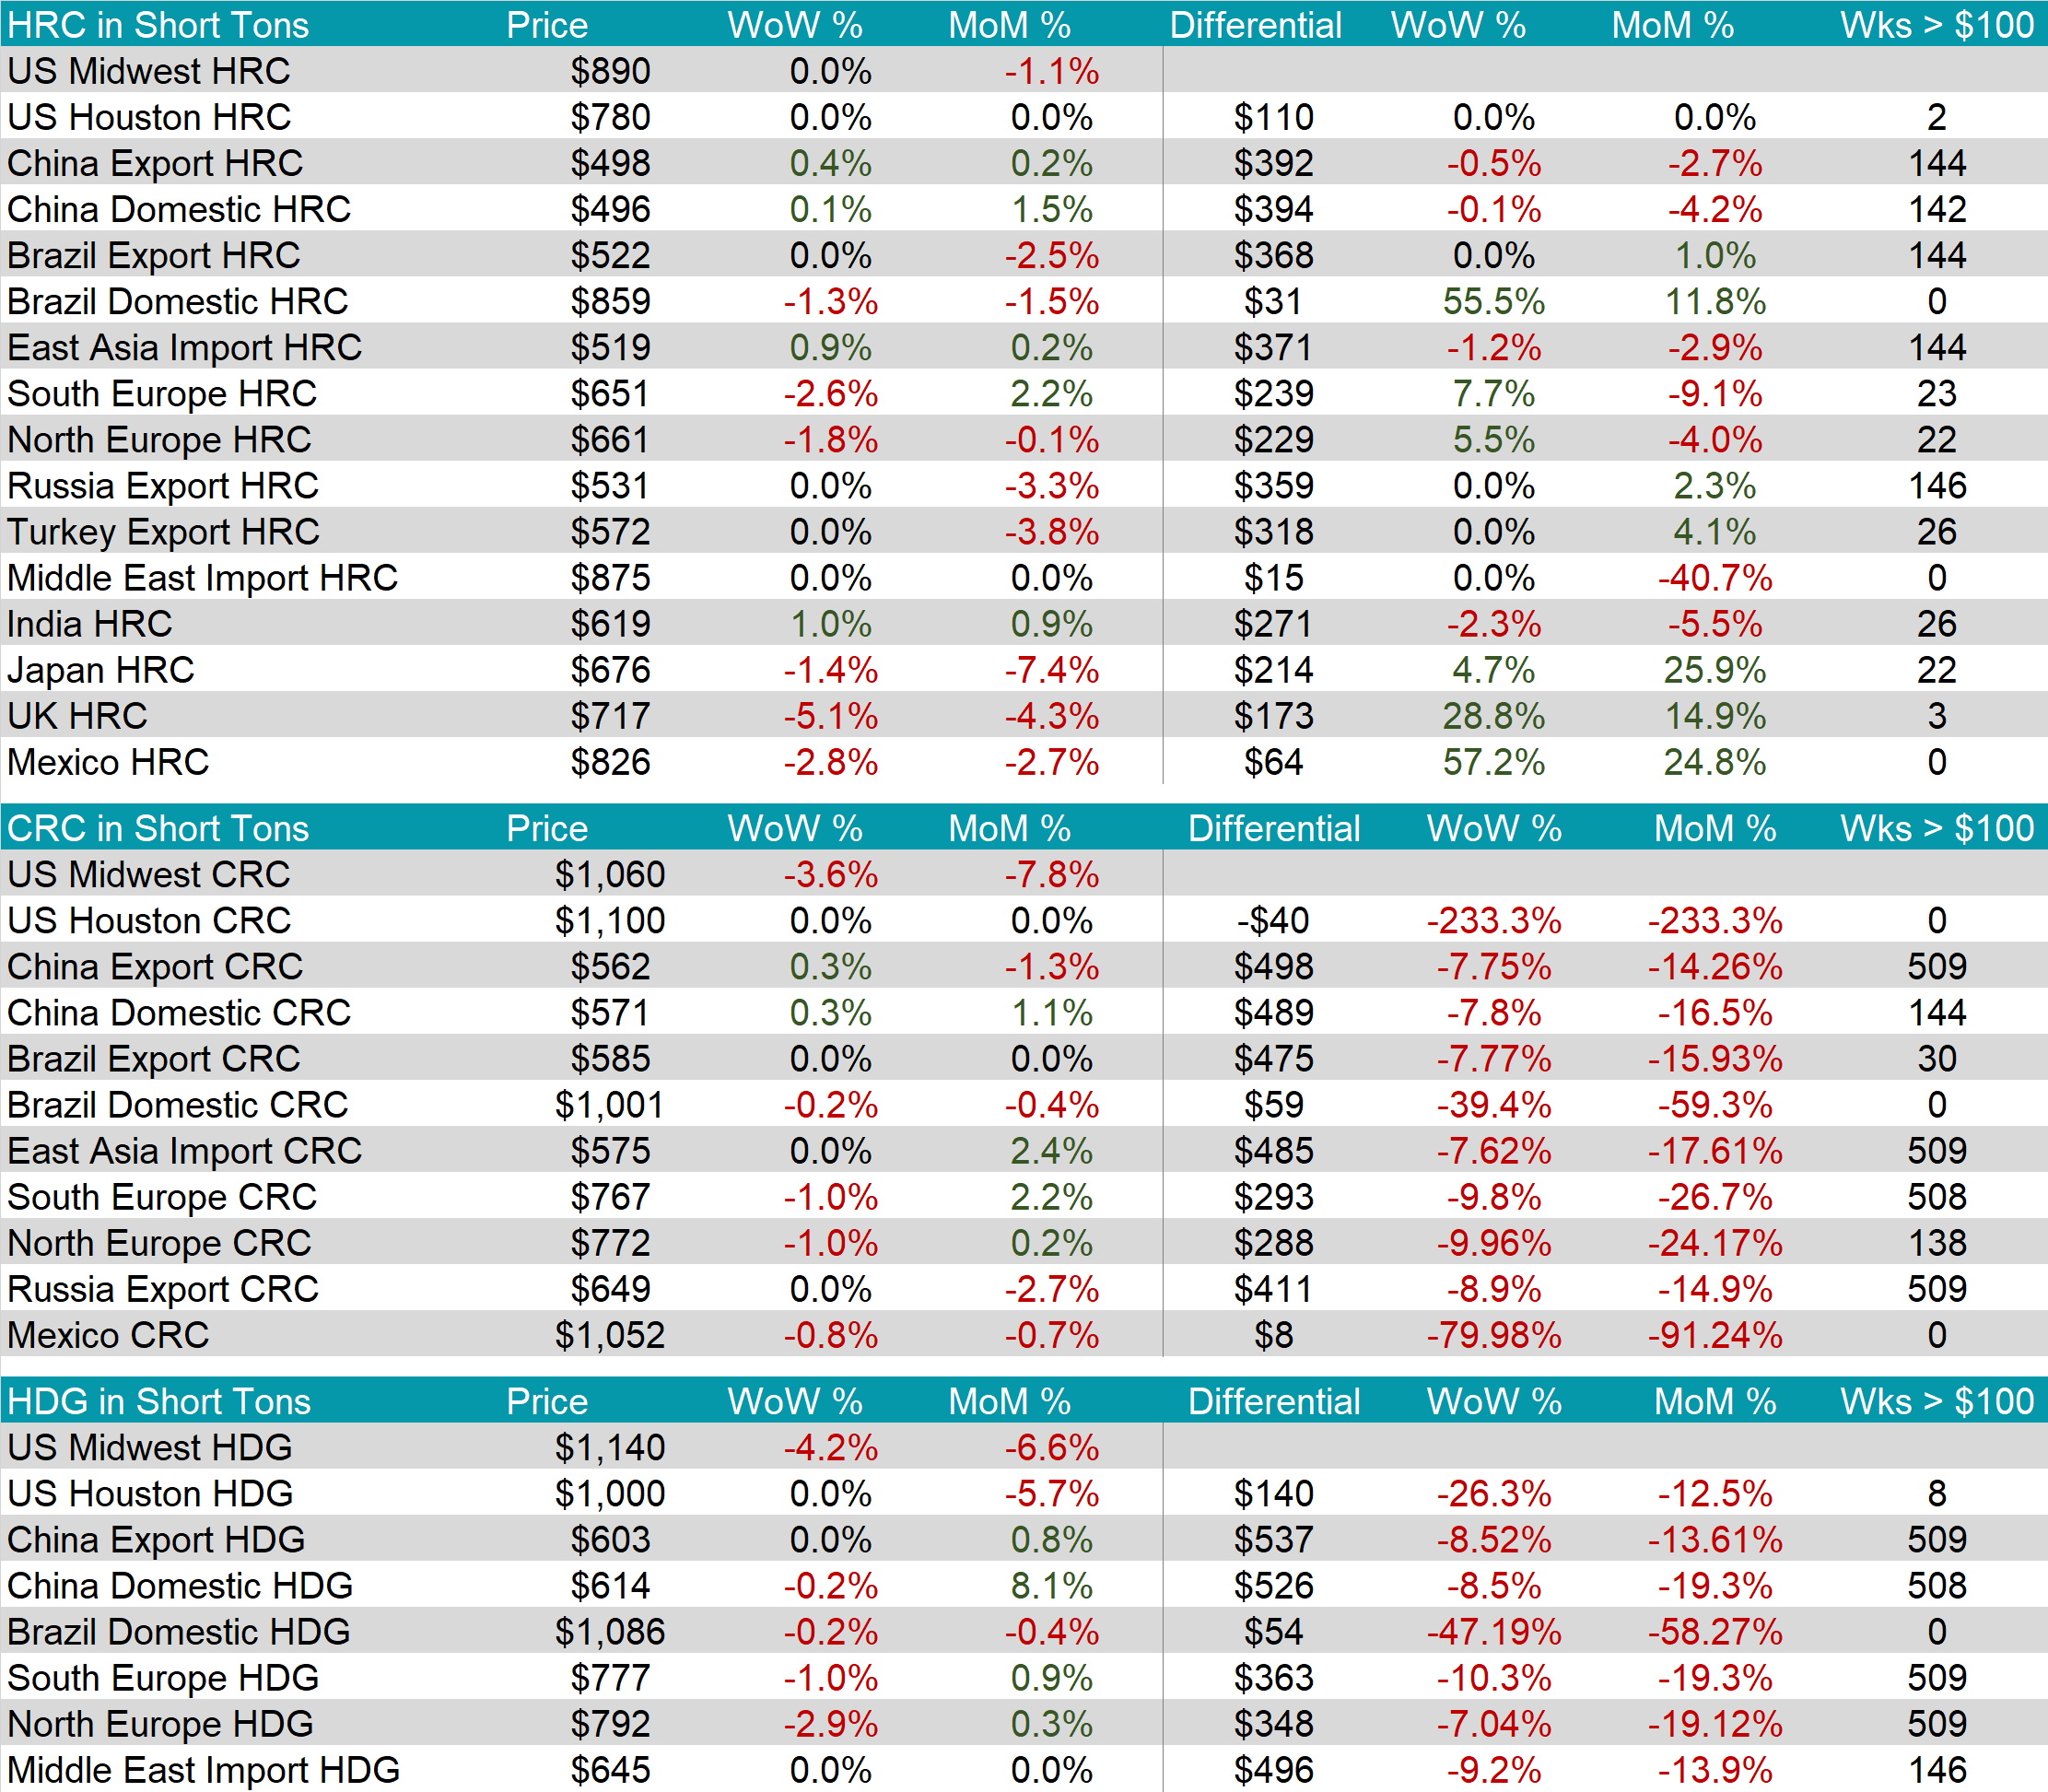
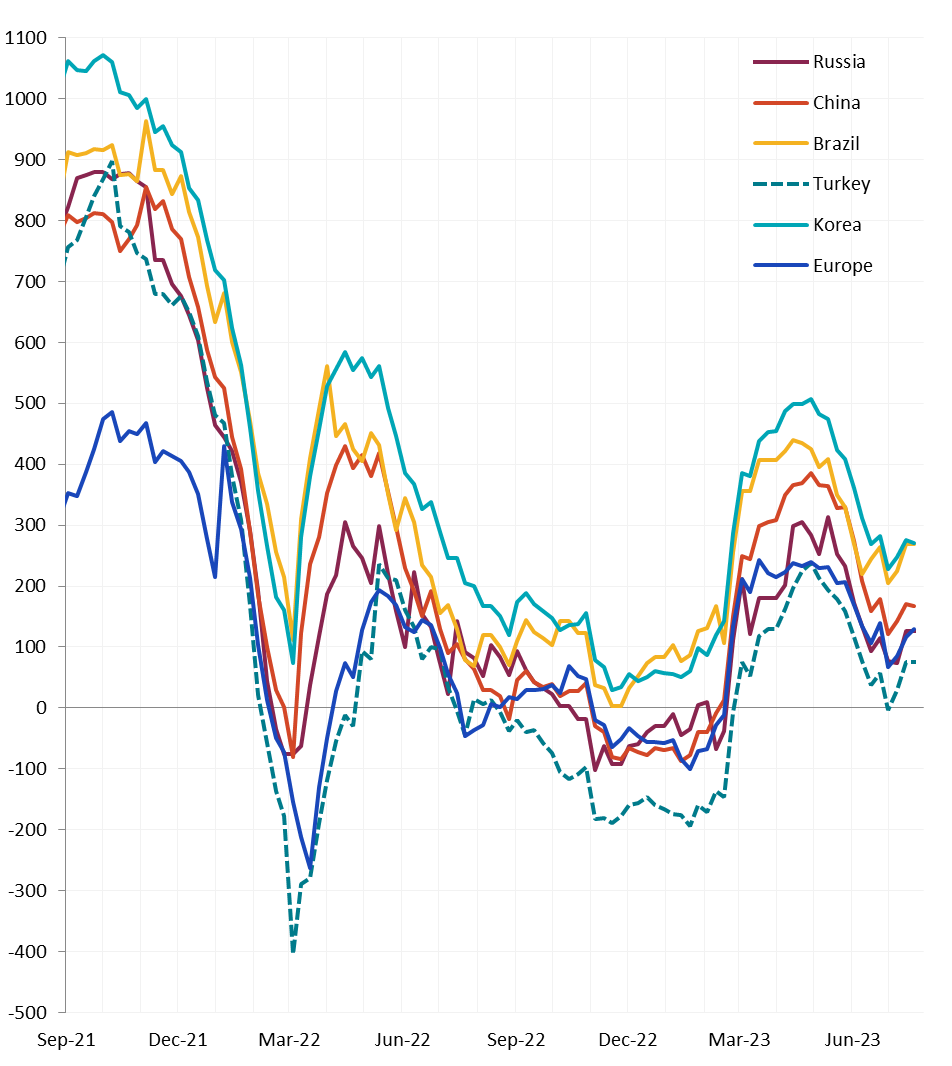
Global Differentials were mixed this week with China and Korea higher, while Europe fell, slightly. Current levels of reasonably elevated differentials would normally illicit increased demand for foreign material, however, expectations of lower domestic spot prices and the risk of holding inventory at the end of the year should keep arrivals subdued.
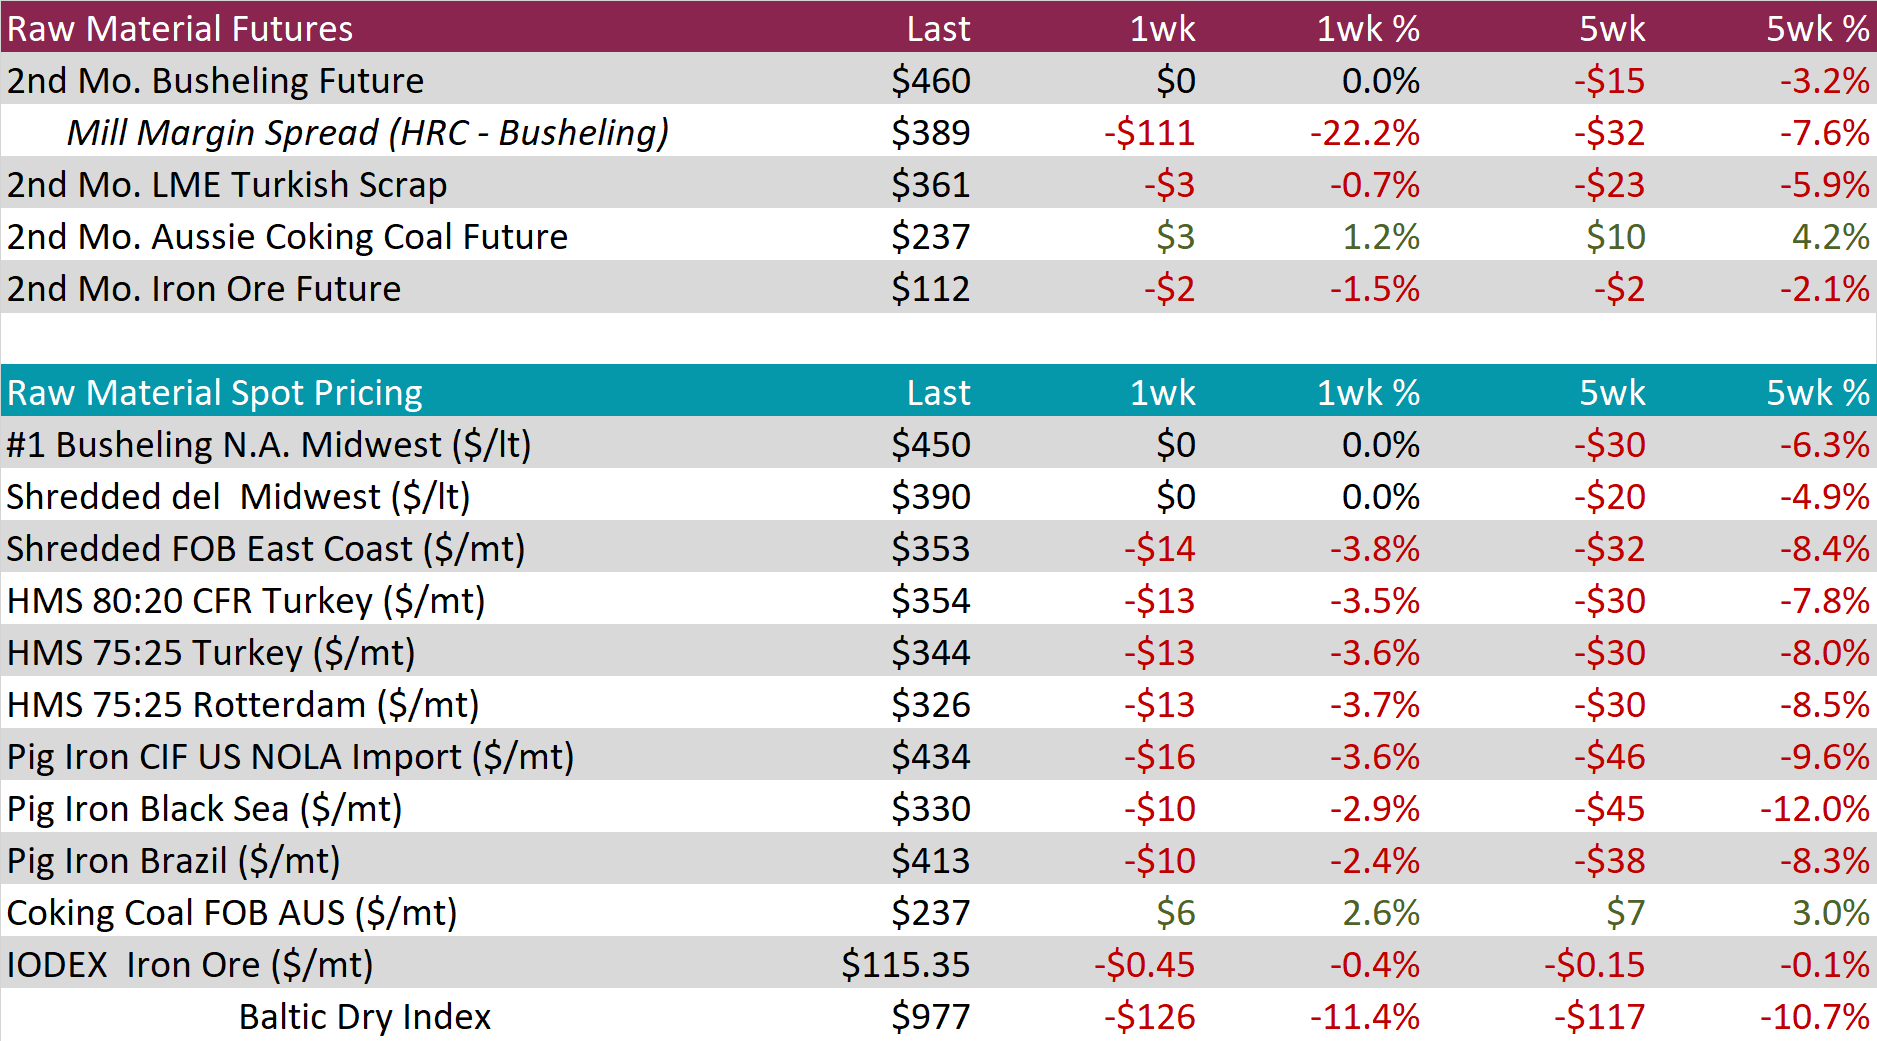
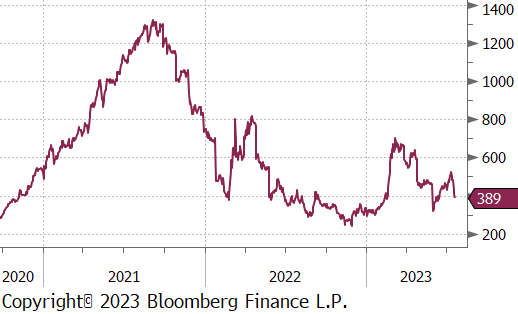
It was a quiet week in raw materials with spot and 2nd busheling month futures both unchanged. The sharp move lower in the HRC future led to a down $111 move for the mill margin spread, however, the current level of $389 remains elevated compared to the recent bottom in Q$.
The 2nd month iron ore future was down $2, or 1.5%, only slightly off its recent high.
Dry Bulk / Freight
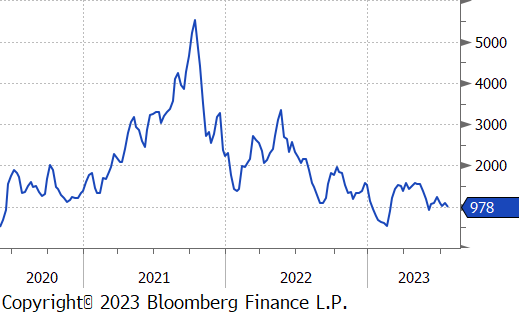
The Baltic dry index was down another $126 or 11.4% this week. It’s inability to move off the recent bottom is a concern for global demand.
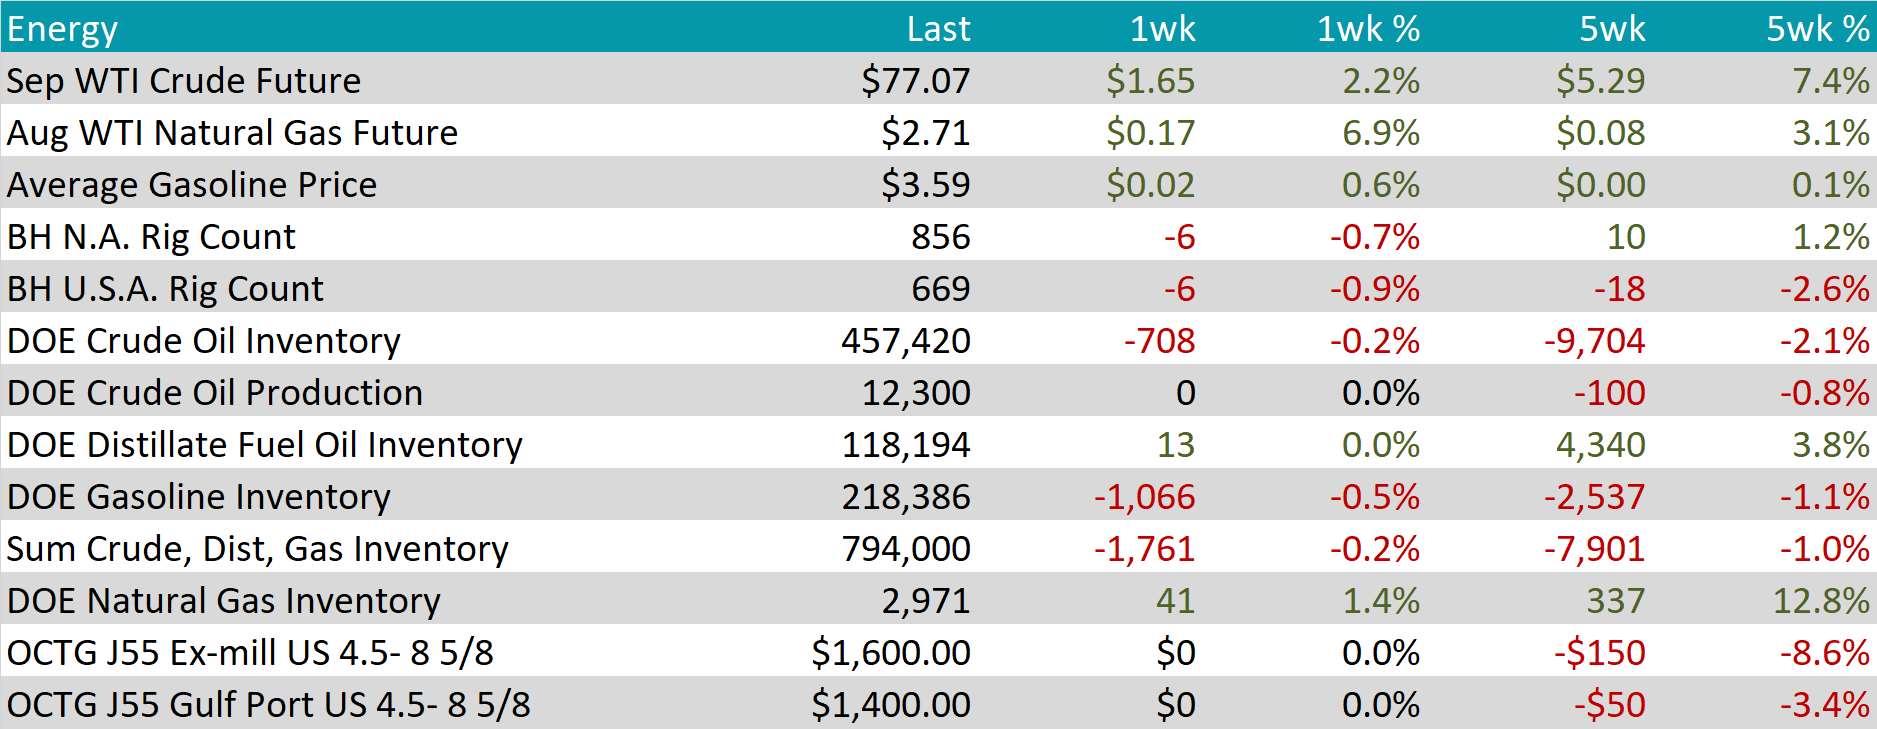
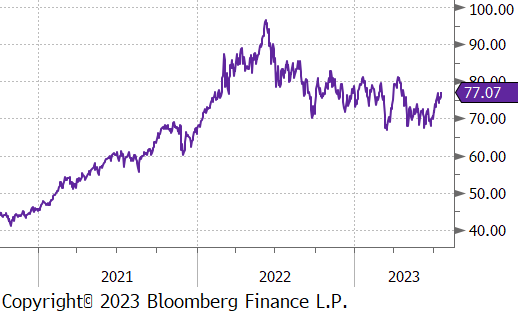
WTI crude oil future gained $1.65 or 2.2% to $77.07/bbl.
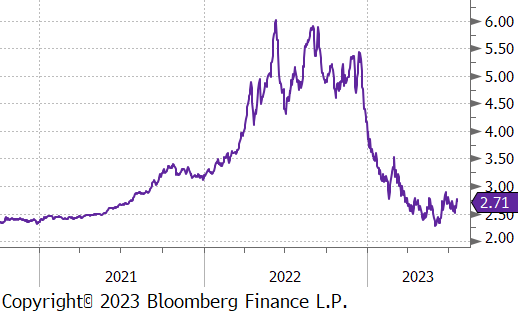
WTI natural gas future lost another $0.17 or 6.9% to $2.71/bbl.
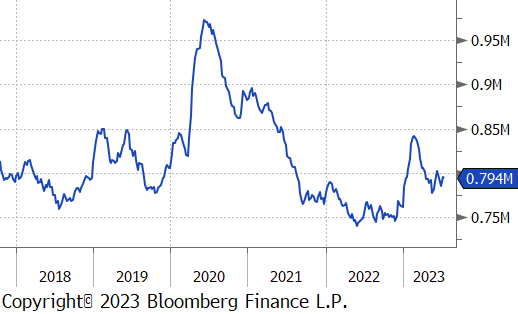
The aggregate inventory level was down slightly, 0.2%.
The Baker Hughes North American and U.S. rig counts were both down 6 rigs.
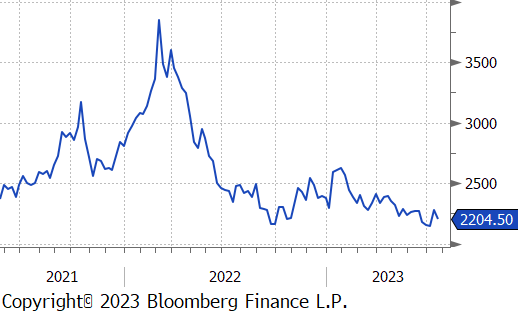
Aluminum sold off 3.2% this week, driven by a stronger dollar and a poor outlook for Chinese demand. Although there has been volatility, it remains clear that the lack of a robust recovery following the COVID-zero policy in China has negatively impacted the aluminum market, consistently reaching lower highs and lower lows since the beginning of February.
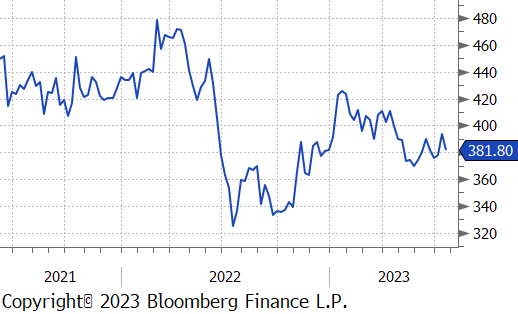
Copper was also down this week, losing 2.9% on the CME. The story here is similar to that of Aluminum, however, we have not seen a break below the end of May low in this market.
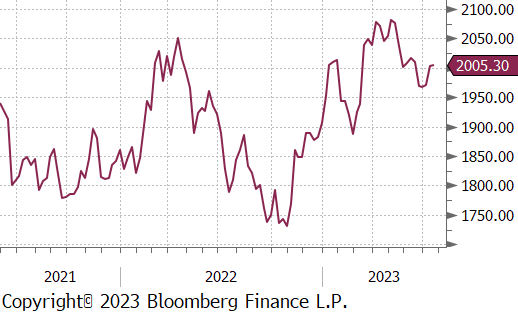
Gold was strong this week, up 2.1% and back above the $2,000 level. This week’s rally was largely driven by global weakness and a flight towards quality.

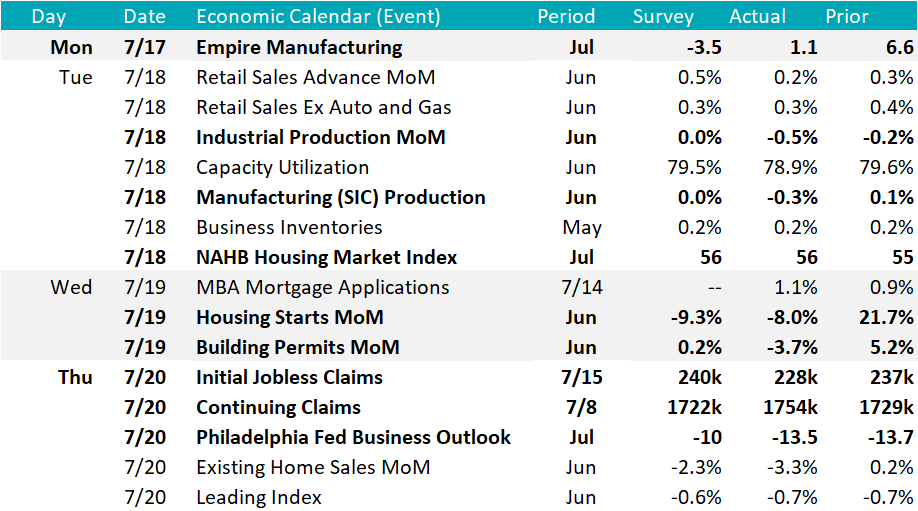
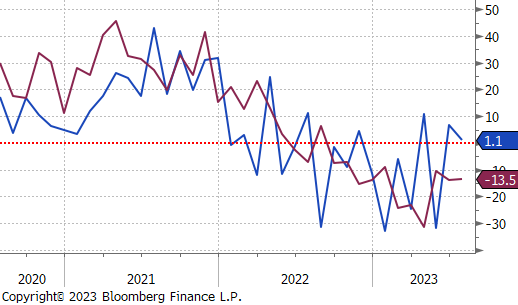
The first of the FED manufacturing surveys came out this week, with Empire (NY) showing better than expected print of 1.1, down from the June reading of 6.6, but better than the expected -3.5. The Phily FED printed at -13.5 up slightly compared to the June reading of -13.7, but well below economist expectations of -10. Given it is only two datapoints, there is not much to be gleaned, however, the underlying subcategories of new orders and backlogs appear to be rightsizing and inventories (which were measured as slightly bloated) have started to rollover. Given this data, it is starting to look like we have or are about to reach the bottom in the manufacturing contraction.
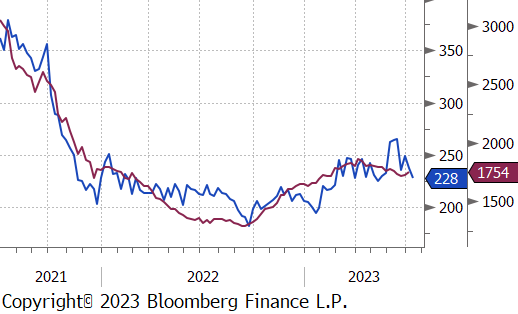
Looking to the weekly labor market data, we are continuing to see signs that the labor market cooling might be moderate. Initial jobless claims came in below expectations for the 3rd week in a row, and continuing claims remain below their recent peak.
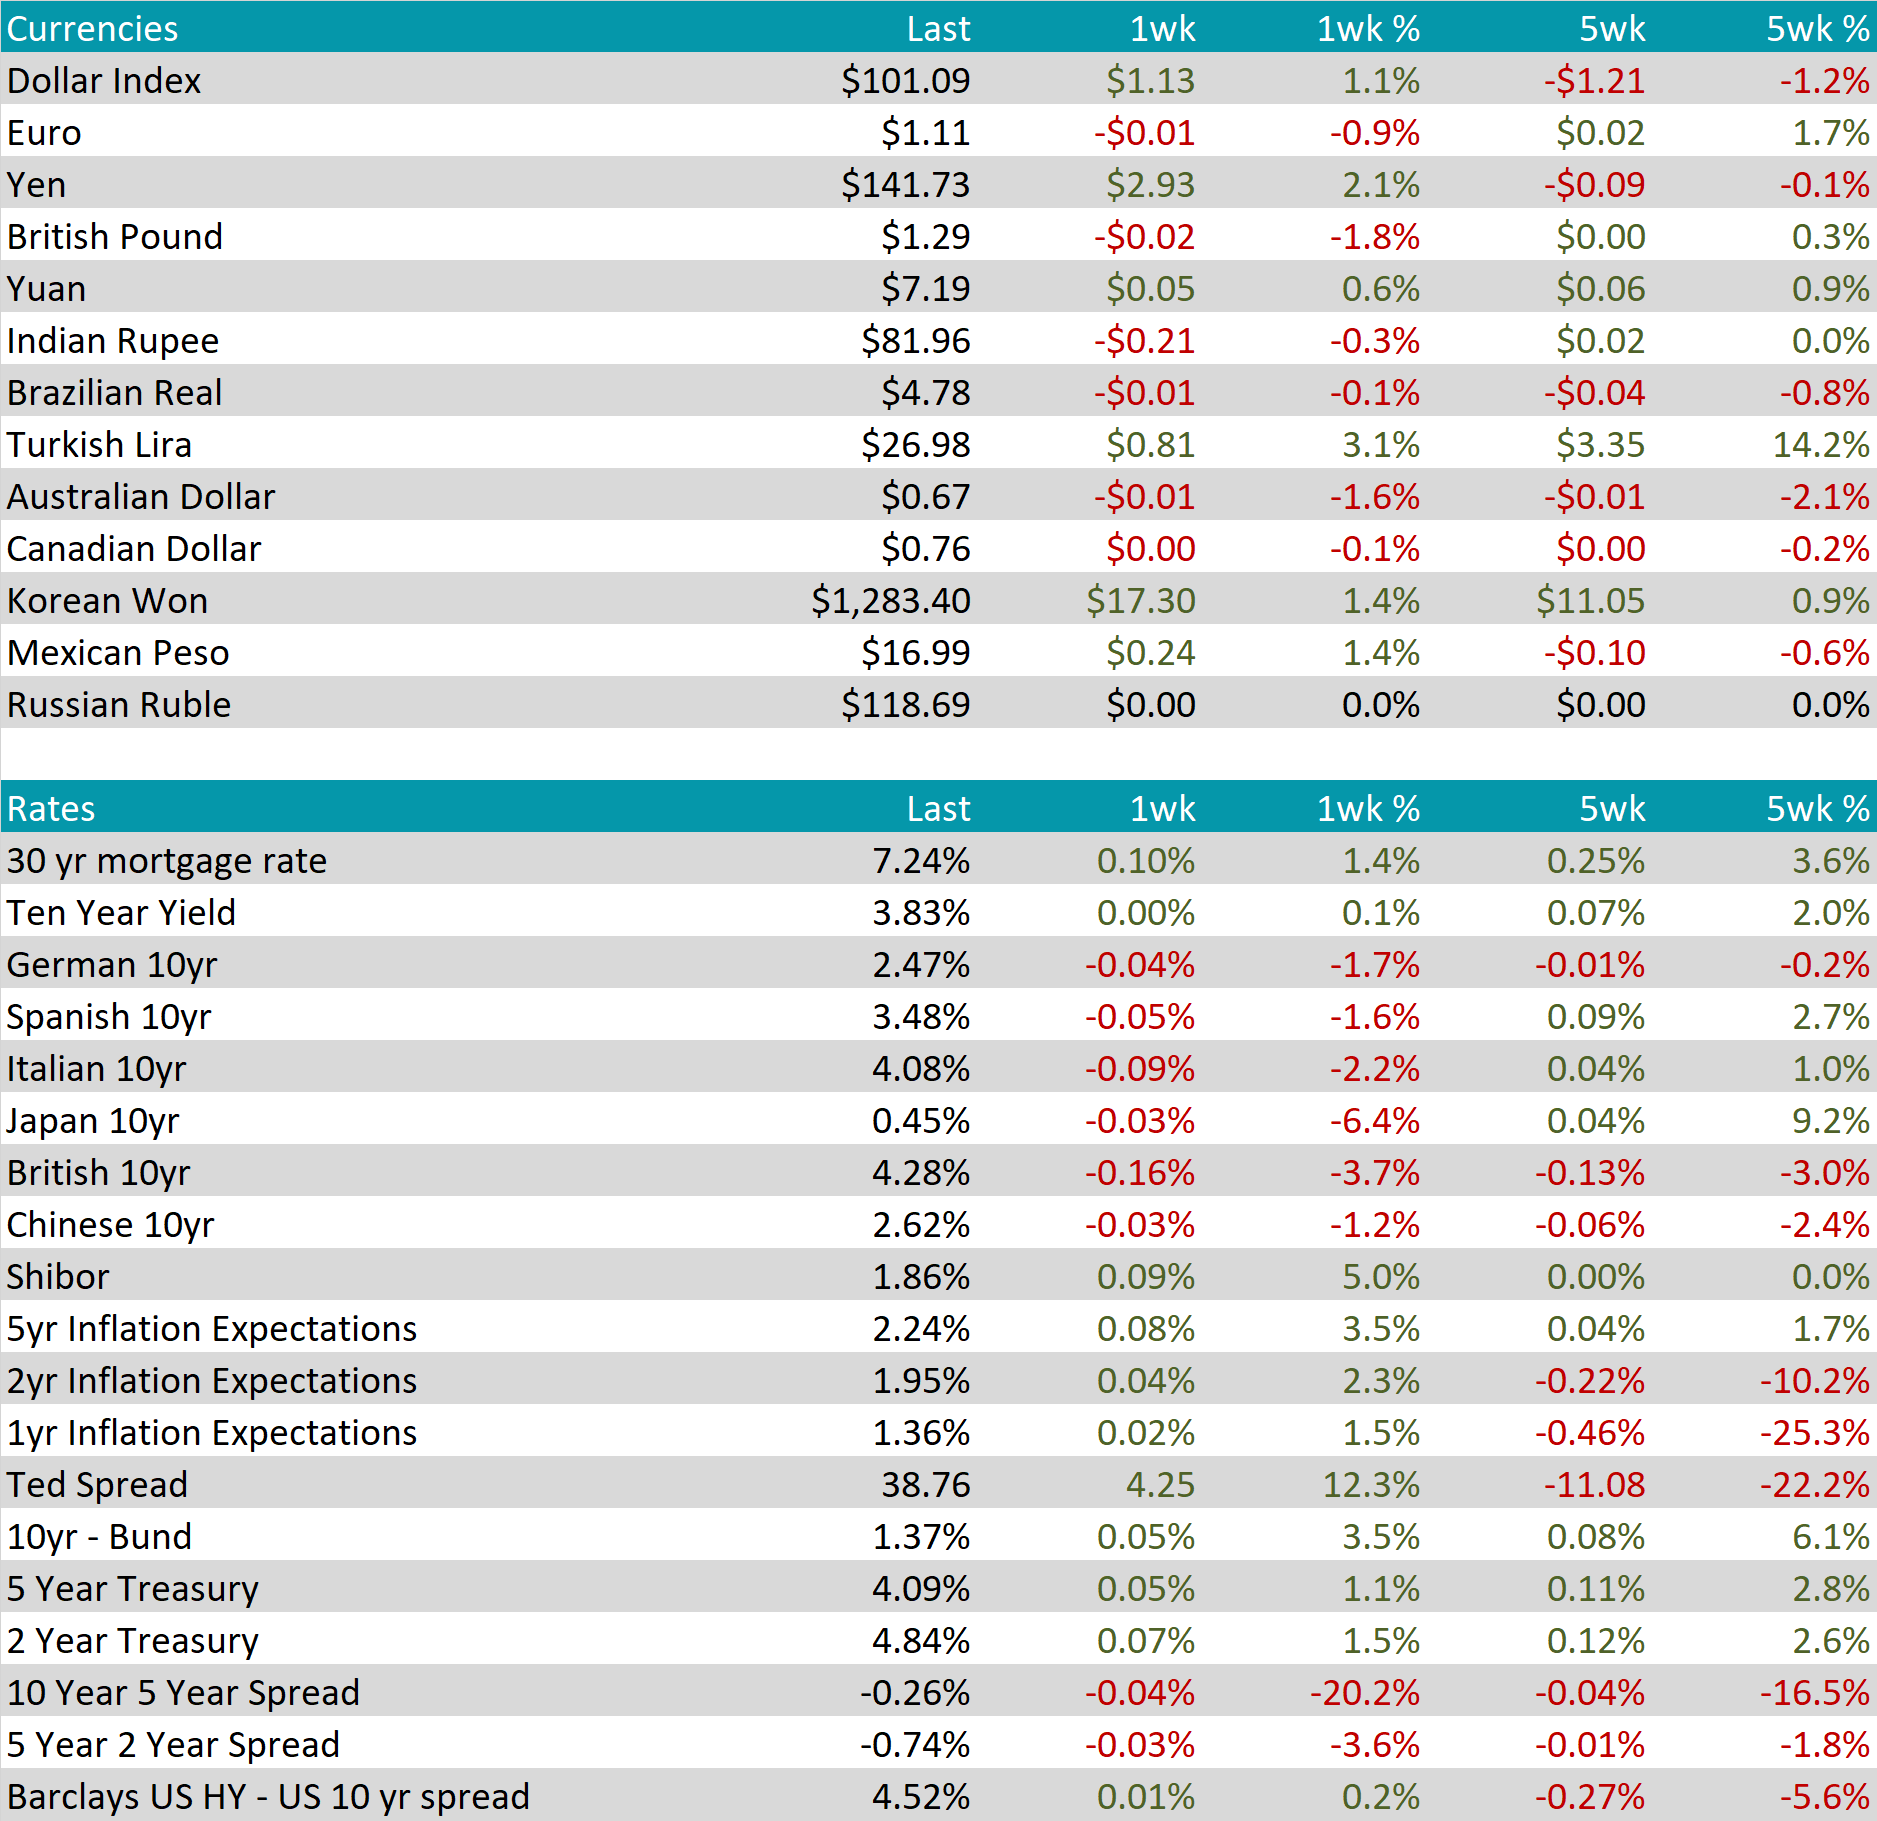
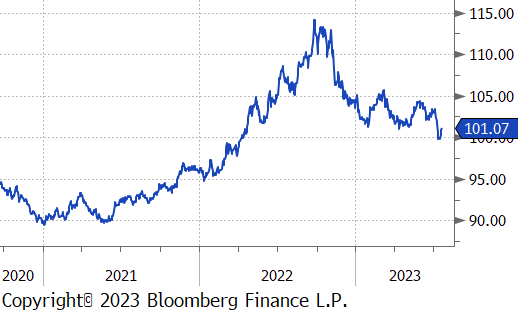
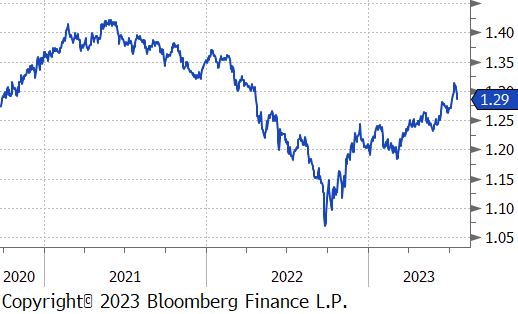
The U.S. Dollar sharply reversed its recent trend and jumped $1.13 or 1.1%. The British pound weakened most, against the USD last week, as weaker-than-expected PMI data and reduced inflationary pressures in the UK altered rate hike expectations for the Bank of England. Business activity growth slowed sharply in July, contributing to the pound’s pullback against the US Dollar.
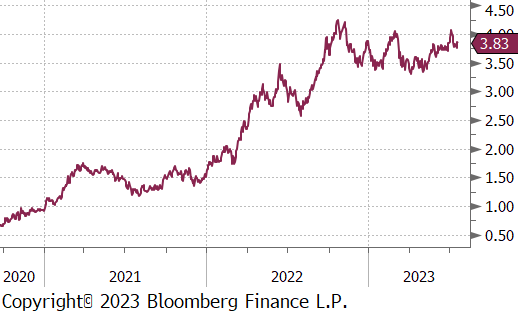
The U.S. 10yr Treasury Yield was flat on the week, which wouldn’t normally be significant news, however, compared to the rest of the major global treasuries, the U.S. was the only “non-loser”. Recent surprise strength coming from economic data has helped buoy our domestic outlook.
