Flack Capital Markets | Ferrous Financial Insider
July 7, 2023 – Issue #387
July 7, 2023 – Issue #387
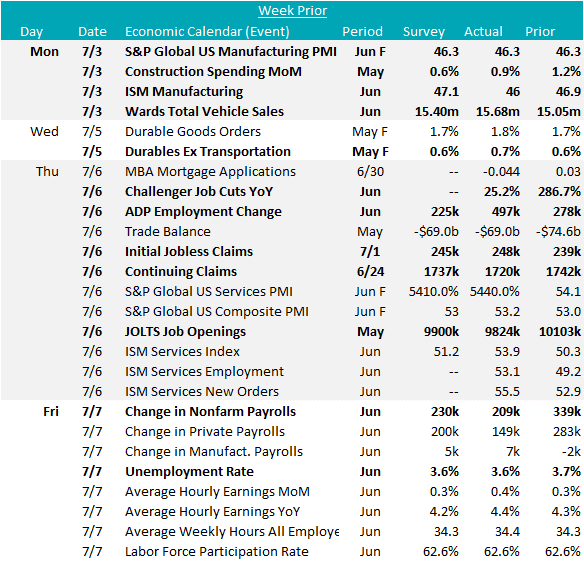
The recent release of economic data at the beginning of the month provided an updated outlook on demand prospects across various sectors. To start, the June ISM Manufacturing PMI fell short of expectations, registering a topline print of 46 compared to May’s 46.9, with forecasts pointing to a slight increase to 47.1. The underlying subcomponents of the index indicate a continued contraction in the sector, suggesting that the bottom has yet to be reached.
On a positive note, June auto sales exceeded expectations, coming in at an annualized rate of 15.68 million sales. While still in the recovery phase, this figure remains below the 10-year prior average of 16.1 million. Additionally, the CPIP (Construction-Put-In-Place) report for May delivered another strong performance, indicating positive developments in the construction sector.
Total construction spending continues to demonstrate strength and surpass expectations, up another 0.9% in May, indicating increased demand and robust spending. Nonresidential construction is gradually losing momentum, although it still exhibited year-over-year growth for the 22nd consecutive month. On the other hand, residential construction experienced a notable increase for the first time since April 2022, while year-over-year spending was negative for the sixth consecutive month.
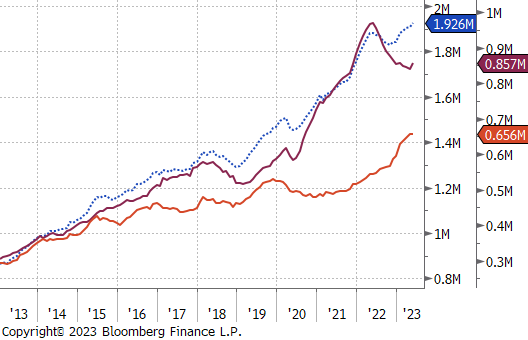
In recent months, there has been a notable disparity between the manufacturing and construction sectors. The divergence between the two is exemplified by the nonfarm payrolls data for construction and manufacturing sectors. Construction payrolls continue to exhibit strong growth, surpassing the peak seen in 2006. In contrast, manufacturing payrolls have plateaued, currently exceeding the recent peak from 2019 but falling significantly short of the overall peak witnessed in 2006.
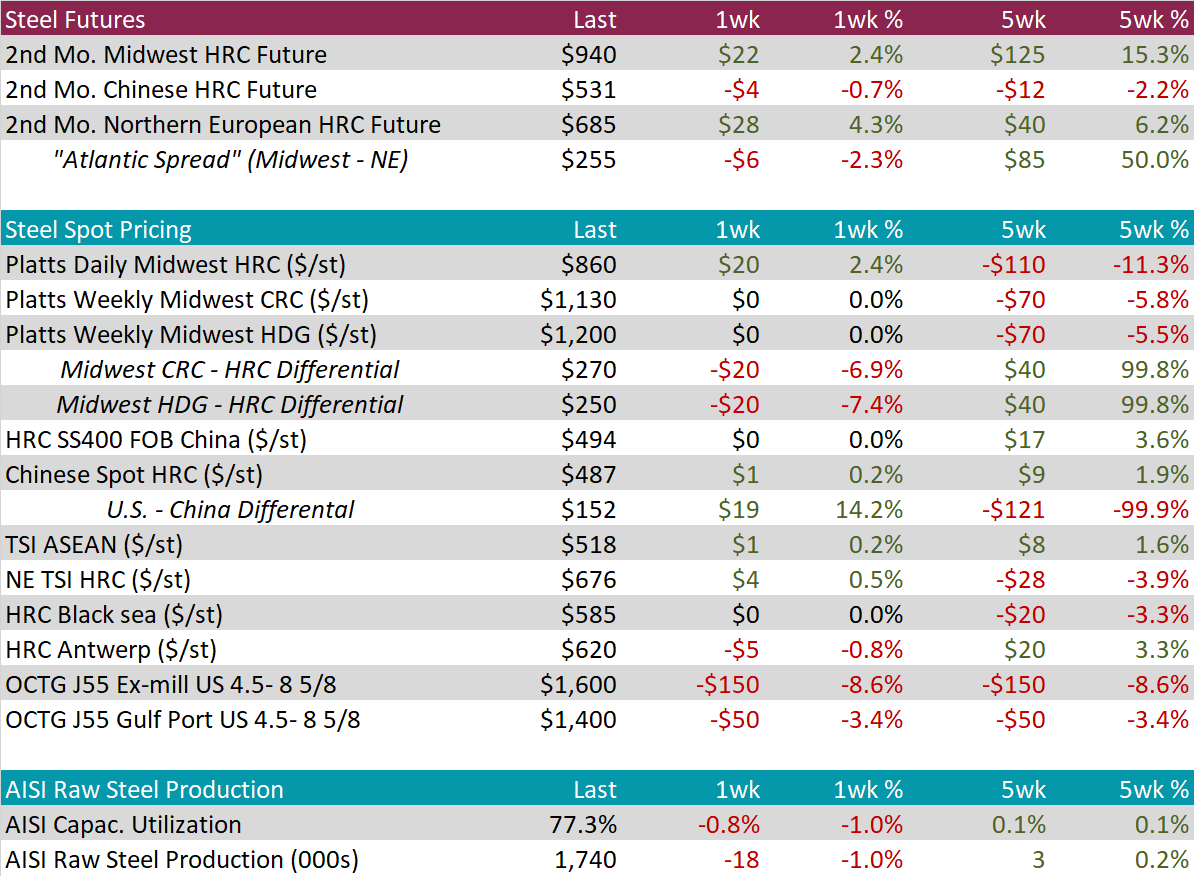
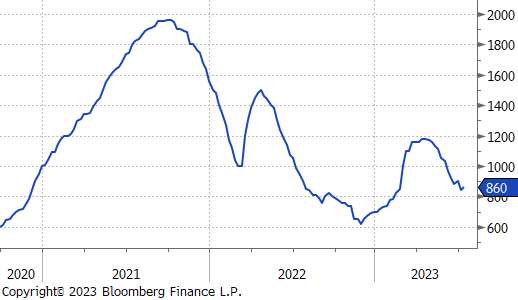
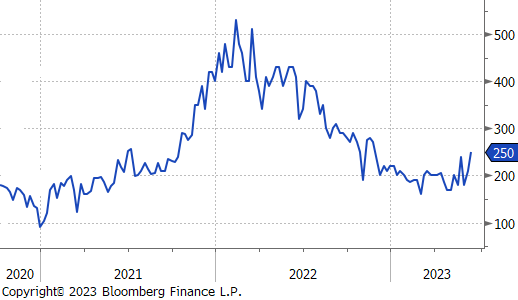
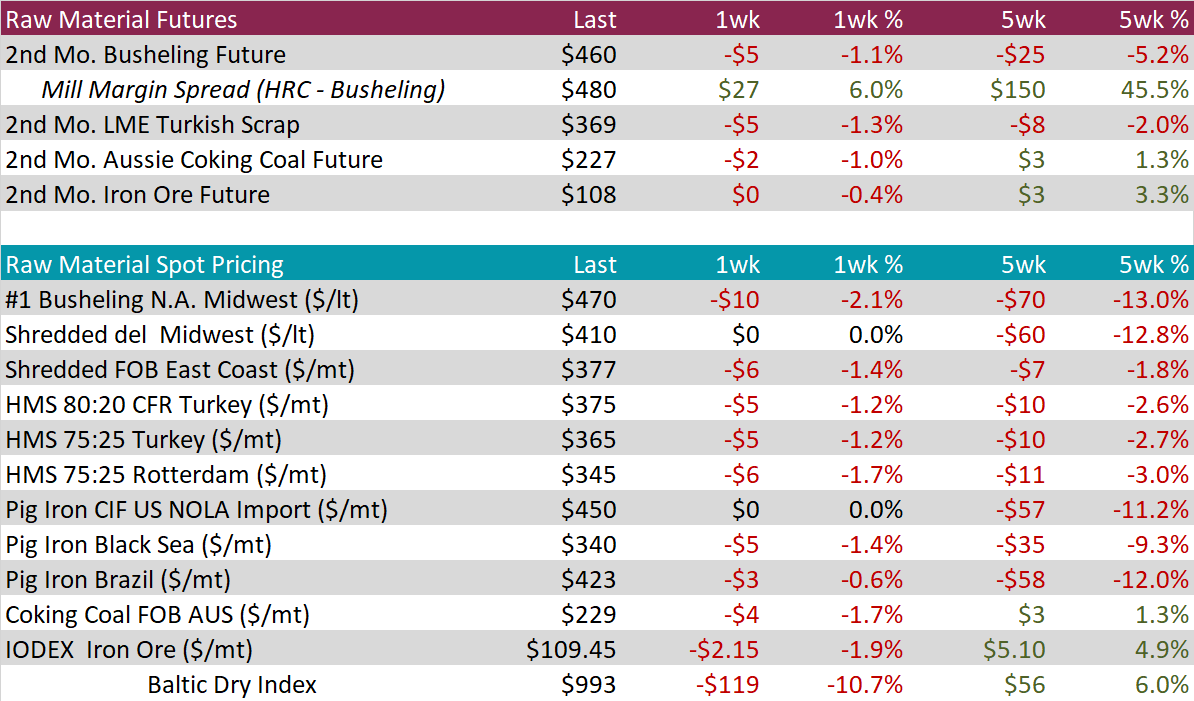
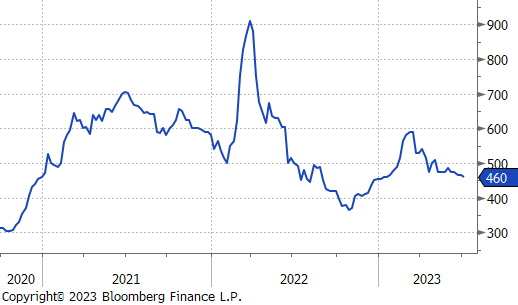
The HRC spot price and 2nd month future both increased by 2.4% this week, as price increase announcements continue to reverberate through the market. That said, assessed spot prices are still below the $900-950 levels which were announced, suggesting that the market has not fully bought in to mill demand.
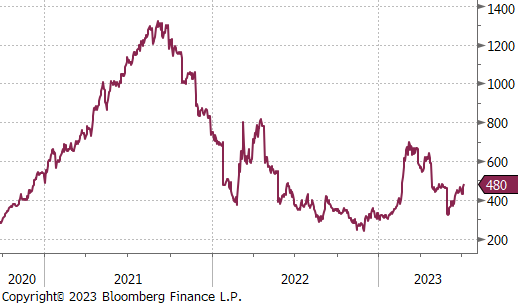
Tandem products were unchanged again this week, causing the HDG-HRC spread to slightly contract.
Mill production retraced, slightly, with capacity utilization falling 0.8% to 77.3% last week.

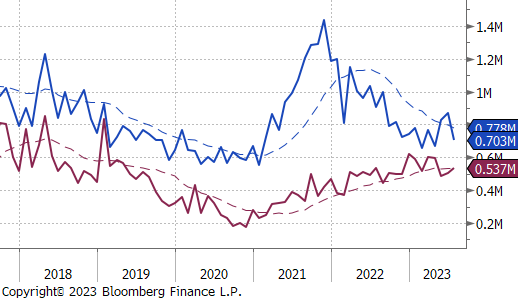
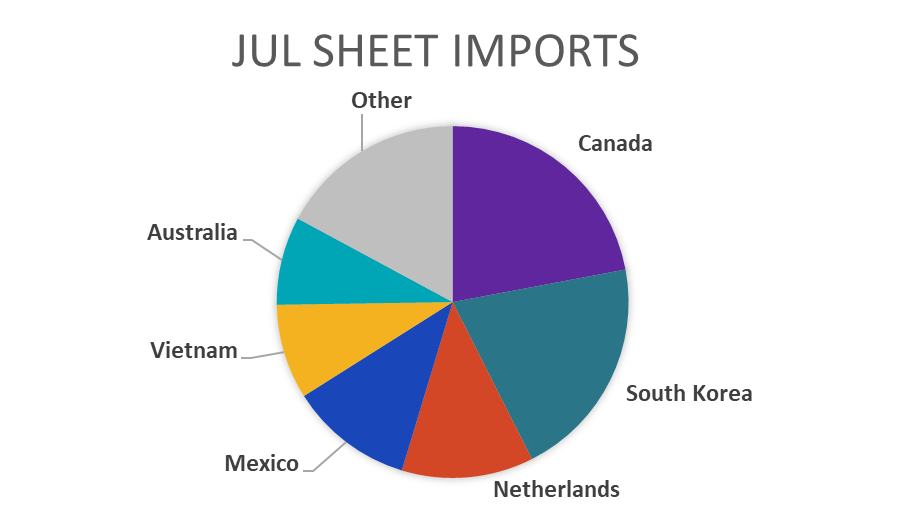
July Projection – Sheet 703k (down 168k MoM); Tube 537k (up 32k MoM)
June Projection – Sheet 871k (up 13k MoM); Tube 504k (up 53k MoM)
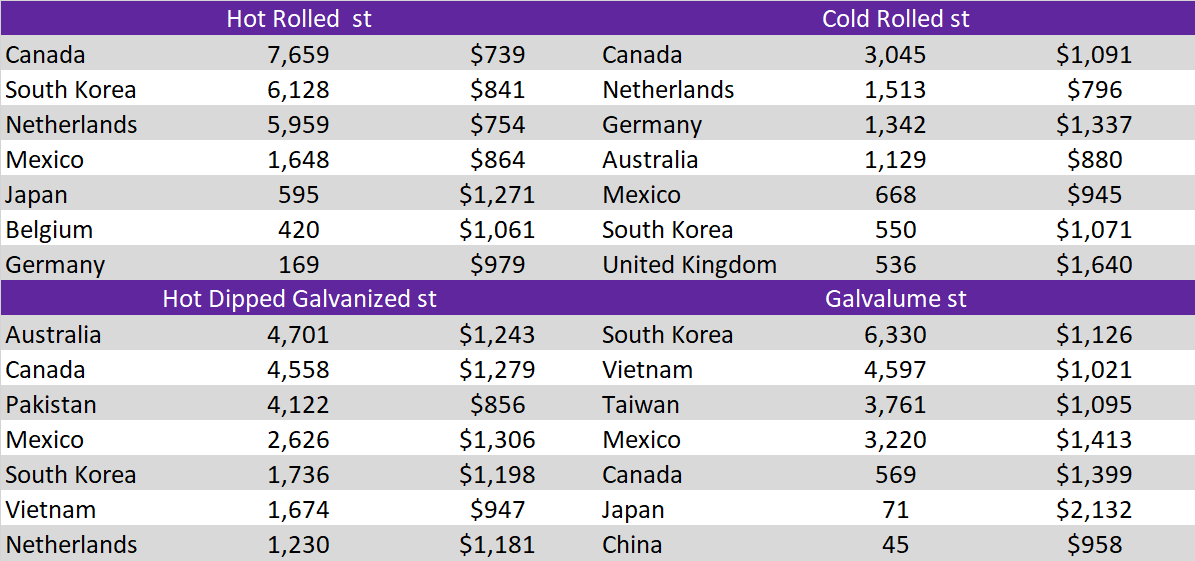
After the May and June data was starting to suggest an upswing in arrivals, preliminary data for July projects a sharp reversal, down to 703k tons of sheet imports.
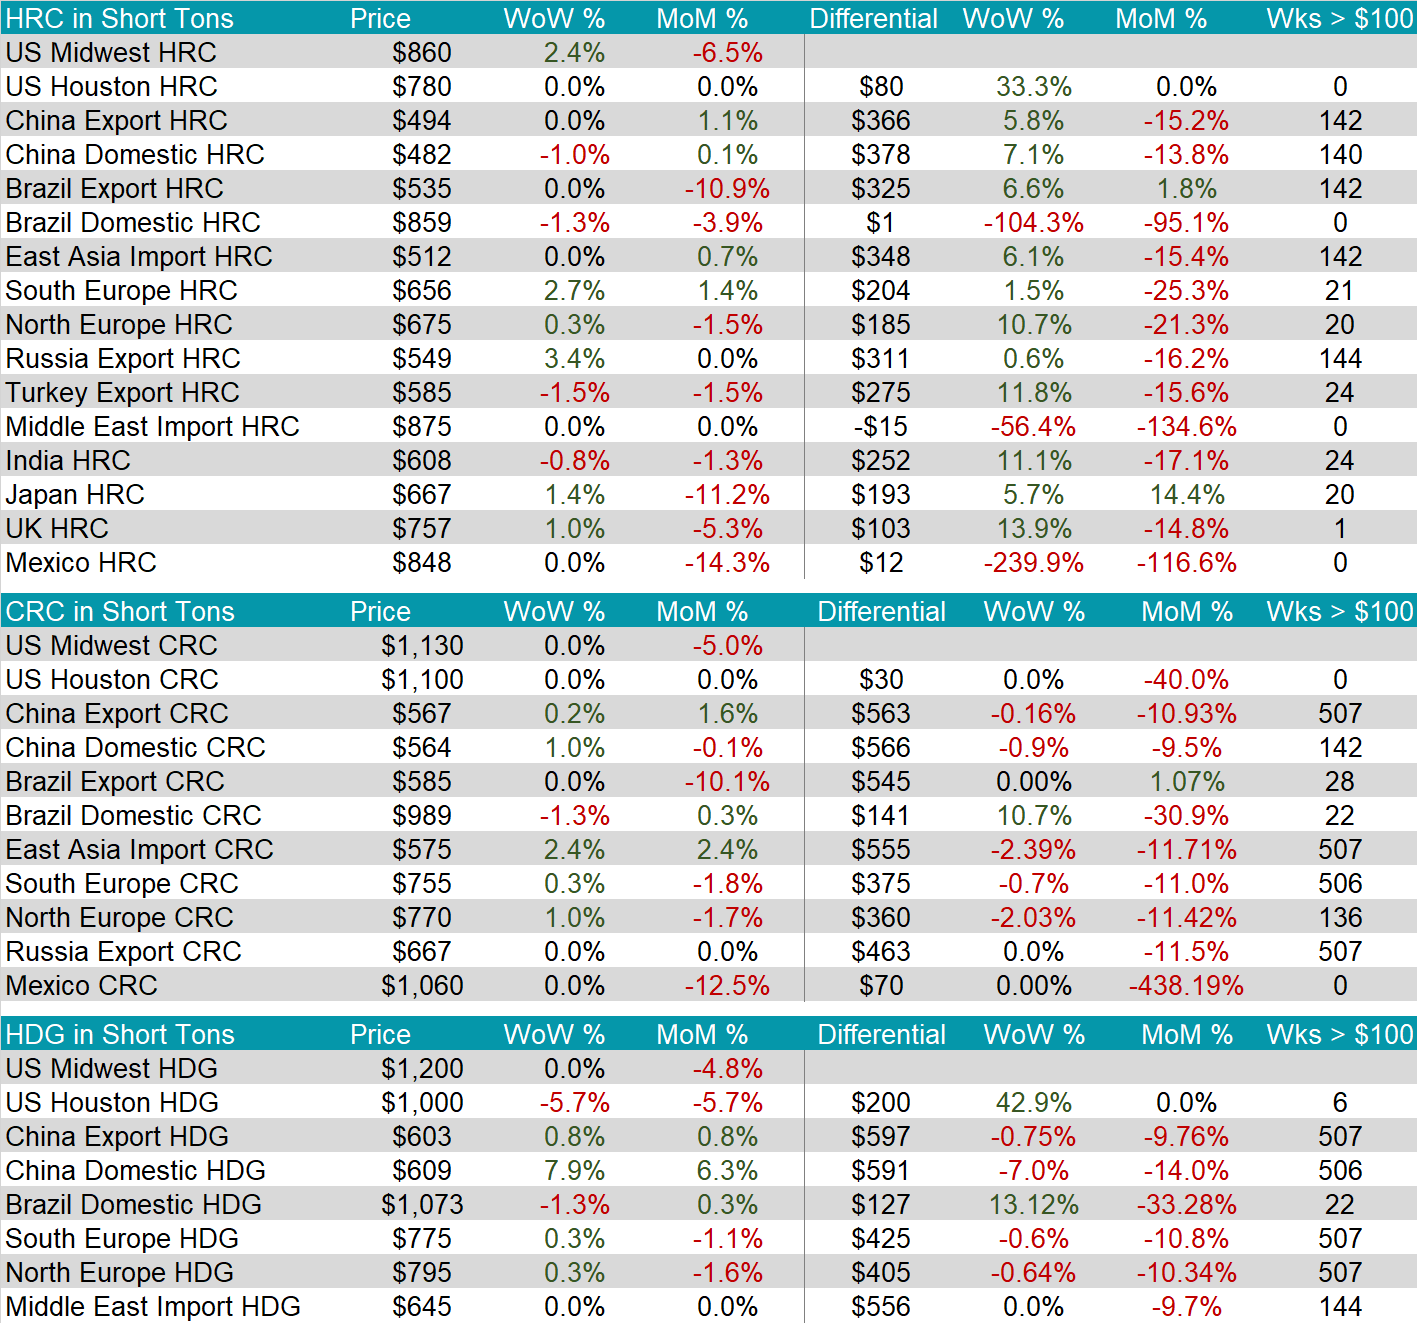
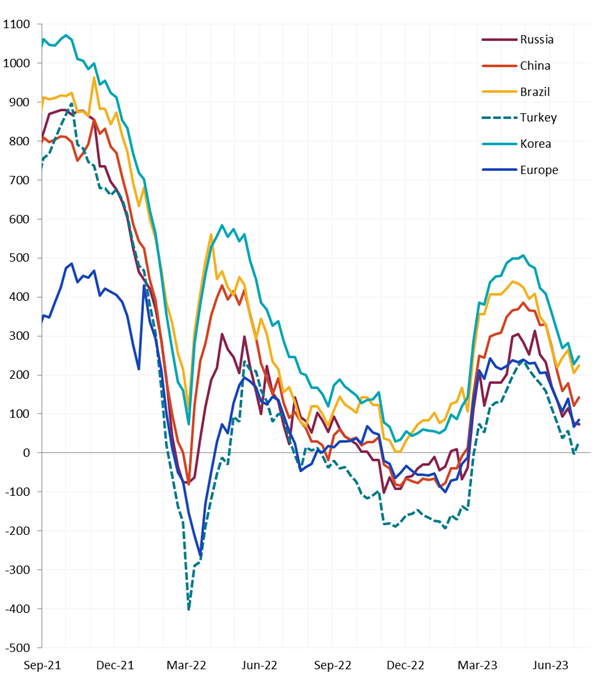
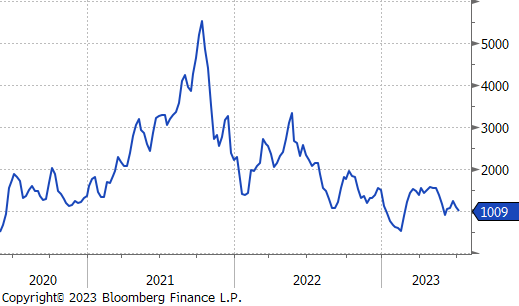
Global Differentials were all higher last week, as the U.S. domestic price increased more significantly that other watched countries.
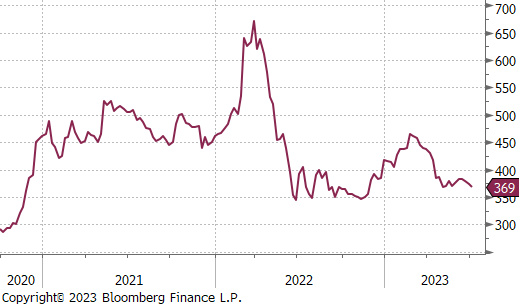
The 2nd month busheling future was down $5 or 1.1%, this week. This and the increase to HRC led to a 6% in mill margin.
The 2nd month Turkish scrap future was down $5 or 1.3%. This price is just above the recent low from early-May.
Dry Bulk / Freight
Baltic dry index was down another $119 or 10.7%, last week, the current price is sitting just above the recent low from early-June.
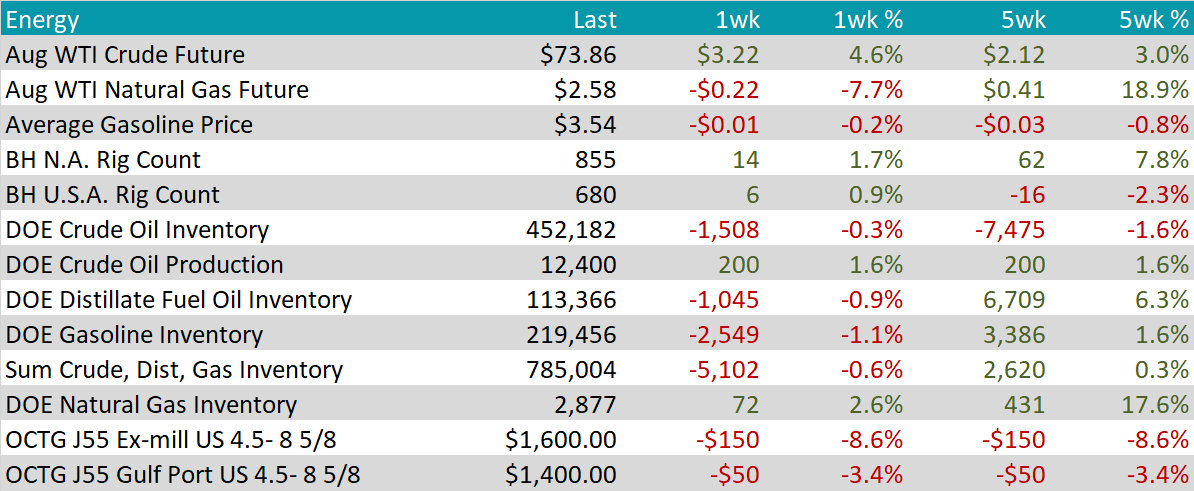
WTI crude oil future gained $3.22 or 4.6% to $73.86/bbl. Crude prices have been in a grinding lower downtrend after prices peaked in early June 2022, with sharp volatility.
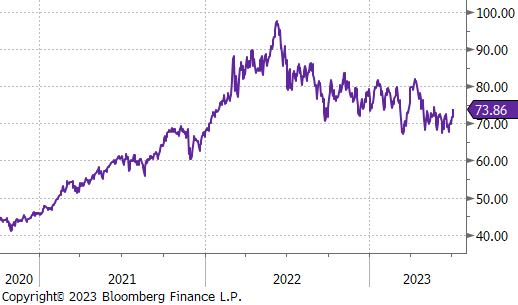
WTI natural gas future lost $0.22 or 7.7% to $2.58/bbl.
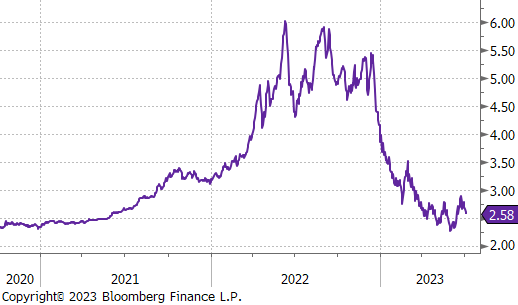
The aggregate inventory level continues to trend lower, down 0.6%, last week.
The Baker Hughes North American rig count was up 14 rigs, and the U.S. rig count was up 6. This was the first increase to the U.S. count in 9 weeks.
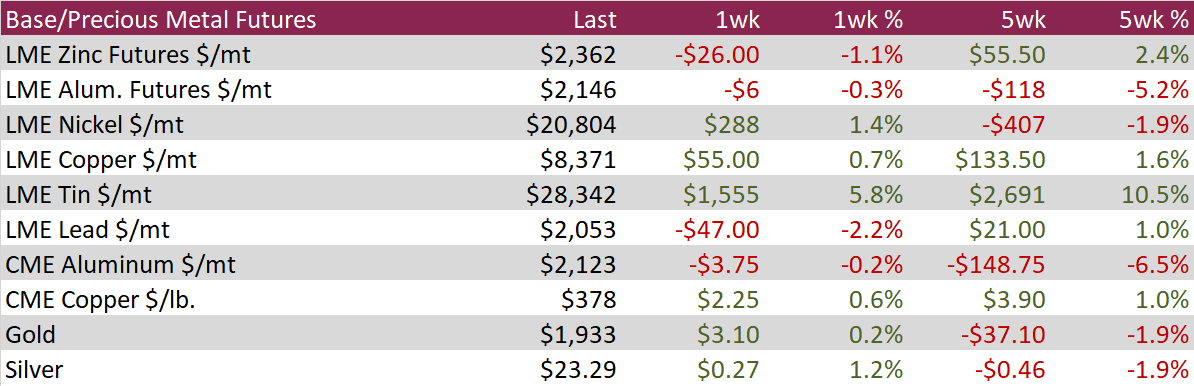
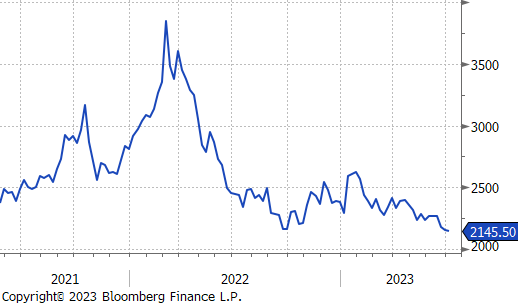
Aluminum futures traded on the London Metal Exchange were unchanged during the shortened holiday week, with many industry participants on summer holiday. Base metals broadly have been under pressure in recent months amid global recession fears and as China’s economic recovery loses steam. That said, further stimulus hopes in China have lent some support for aluminum and copper prices in recent weeks, and the return of idled Chinese aluminum capacity due to rains filling up hydro reservoirs is putting more pressure on the metal.
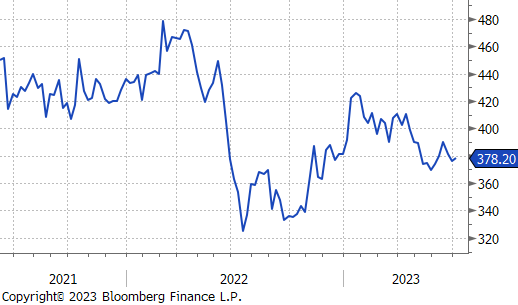
Copper futures on the London Metal Exchange finished slightly higher during the week despite US factory activity dropping to the weakest level in more than 3 years, with production and new orders data also suggesting a pullback. Hedge funds cut net bullish COMEX Coper bets to a 3-week low on the softer economic data but hopes of Chinese stimulus provided support for the red metal to finish higher despite the weaker data.
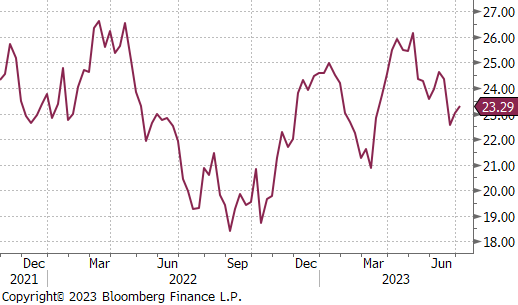
Silver was one of the top performers during the week, rallying over 1% to finish back above $23/oz and closing above its 200d moving average. Silver was able to squeeze out a small gain despite a strong jobs report that reinforced expectations that the Fed will keep tightening, weighing on equity and commodity markets broadly.
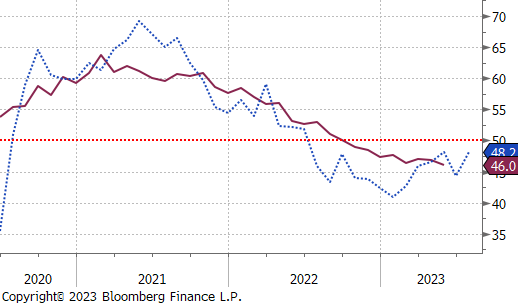
As referenced on the opening page, the ISM manufacturing PMI in June printed below expectations. The chart on the right, shows the topline number as well as a combination of subcomponents, with demand – inventories. The summation of these results suggest further contraction, but upward momentum.
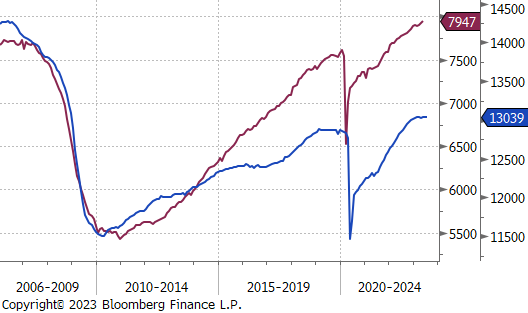
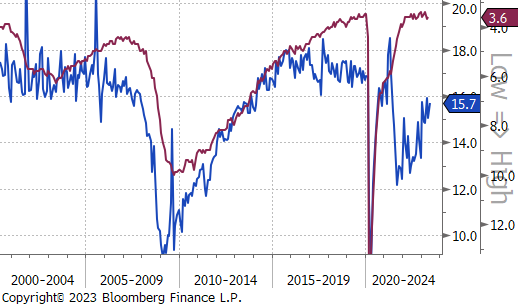
The second chart shows the dynamic which leads us to continue to be bullish auto demand. Historically, the inverse relationship between auto sales and the unemployment rate is one of the most fundamentally supported within steel consumption. The significant gap, driven largely by the supply chain shortages from the pandemic which restricted auto production represent a significant backlog for auto demand. We anticipate that the two will continue to converge in the coming years, with the lions share of this coming from higher auto sales. The unemployment rate continues to outperform expectations, driven by a mix of strong labor demand and increasing labor force participation.
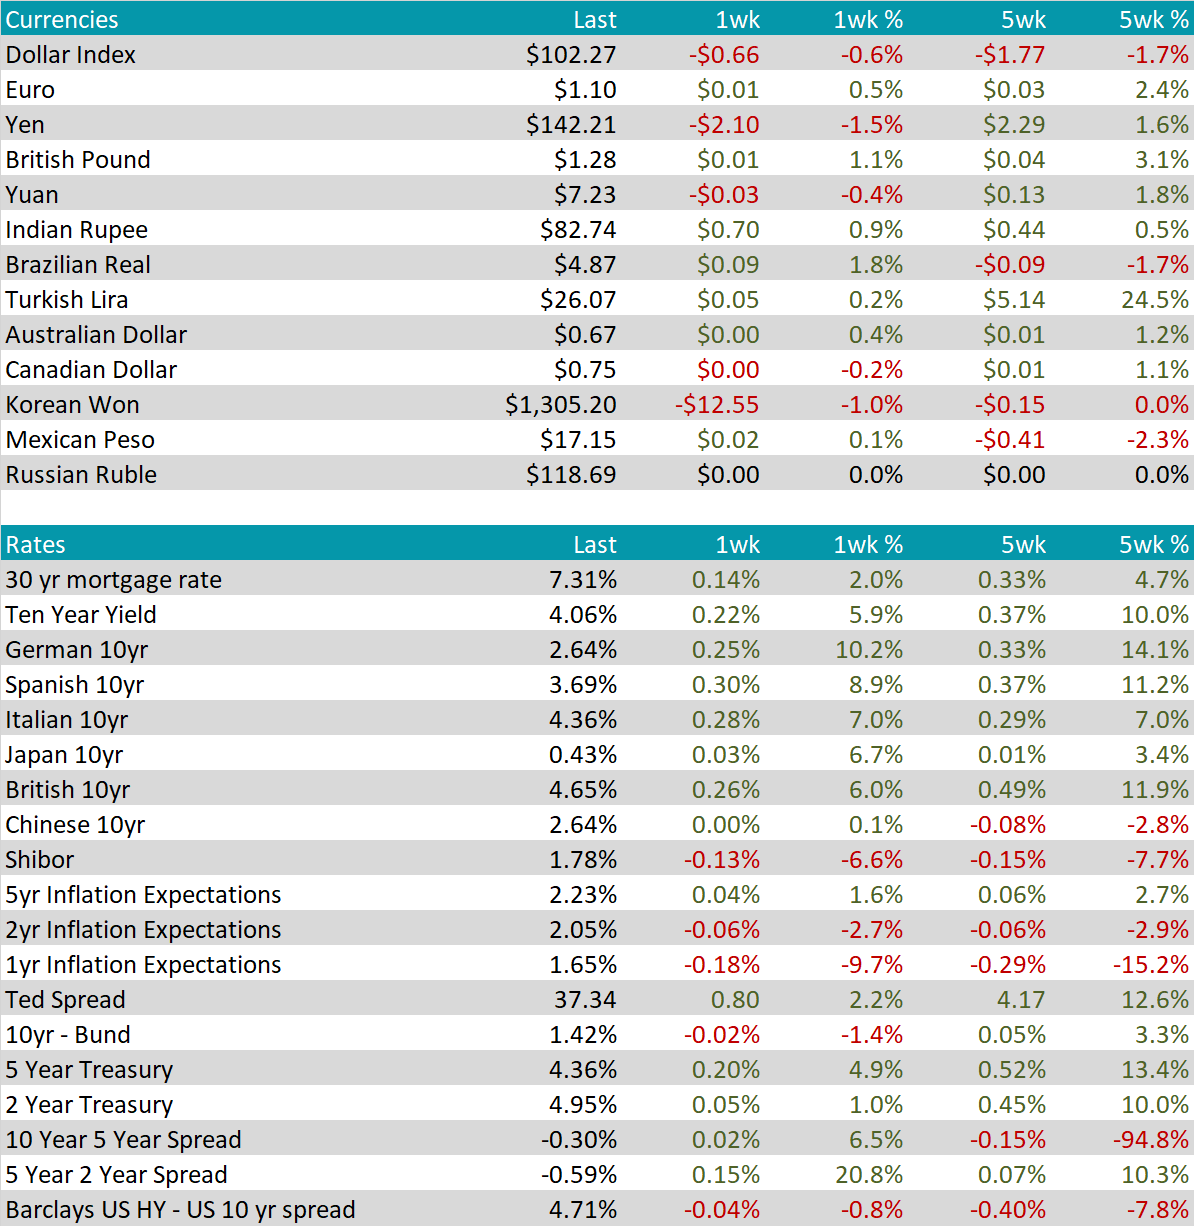
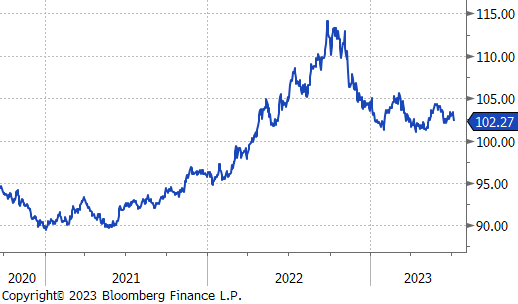
The recent trends in global currencies have been exerting pressure on the U.S. dollar, causing it to decline by $0.66 or 0.6% to $102.27. This can be attributed to the favorable position of the United States compared to other developed economies, particularly Europe and the United Kingdom, in terms of inflation. As a result, it is anticipated that once the Federal Reserve concludes its hiking efforts, the European Central Bank (ECB) and the Bank of England (BOE) will likely need to continue their own hiking cycles. Additionally, the British pound has strengthened further by 1.1% and has reached its highest level since early 2022.
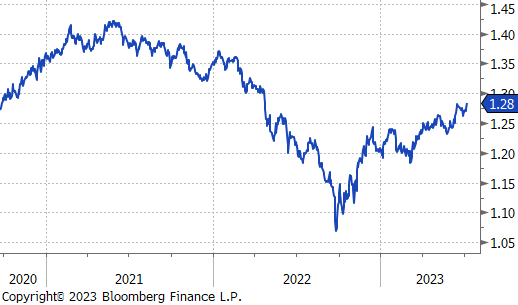
Global rates have experienced an overall increase, with the U.S. 10-year treasury yield rising by an additional 22 basis points, reaching its highest level since the banking crisis in March. In Europe, the German 10-year yield was up another 25 bps as well, a 10.2% increase compared to the prior week.