Flack Capital Markets | Ferrous Financial Insider
July 12, 2024 – Issue #440
July 12, 2024 – Issue #440
Overview:
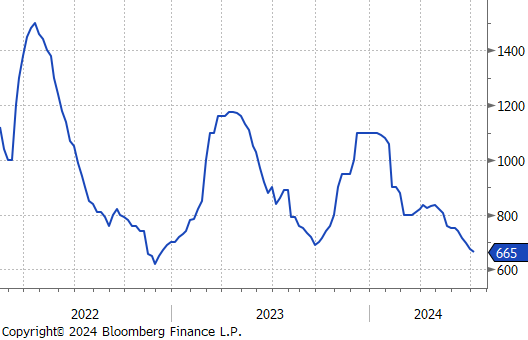
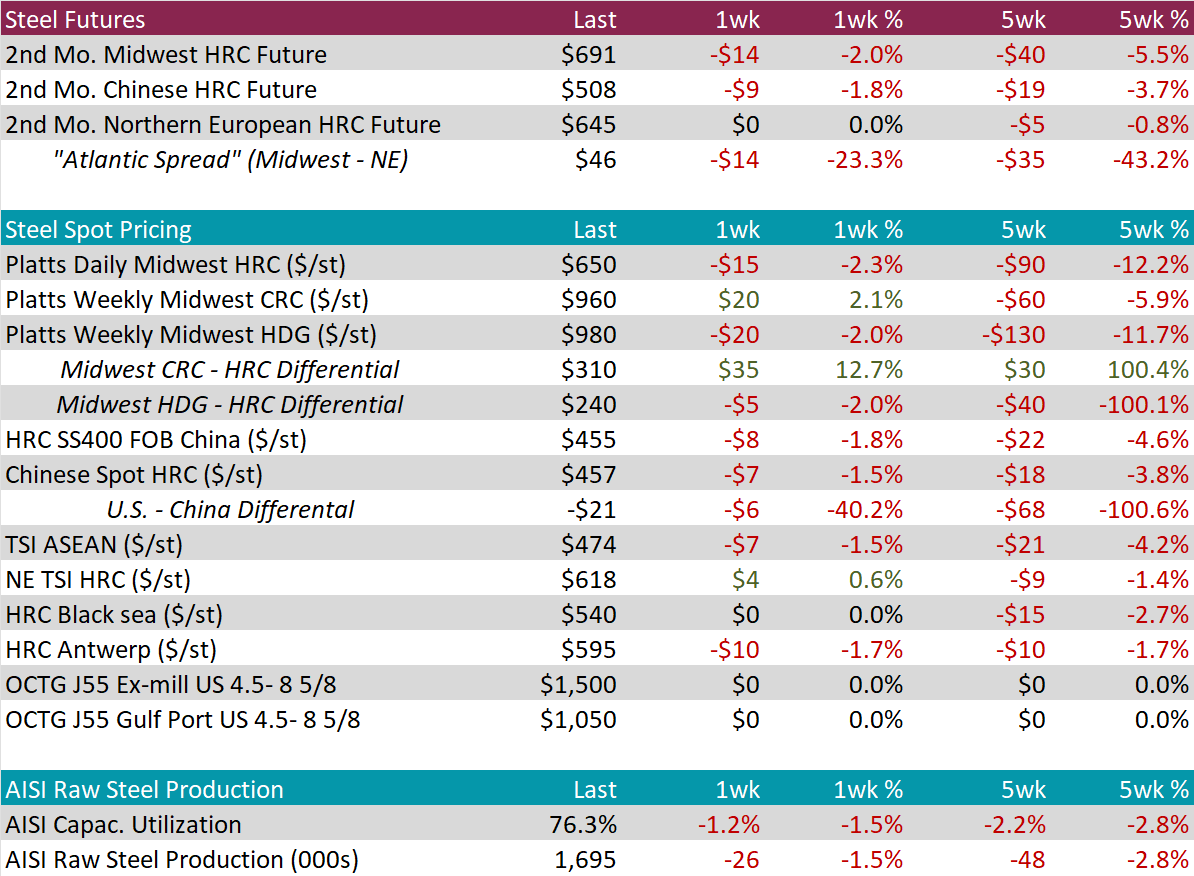
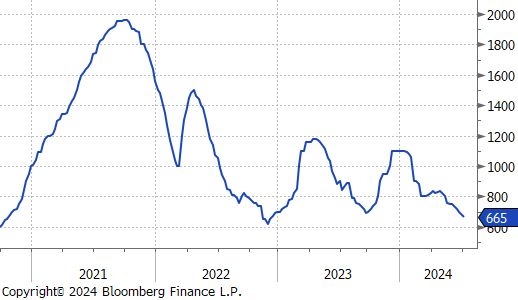
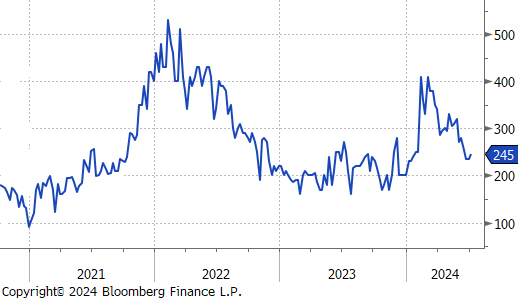
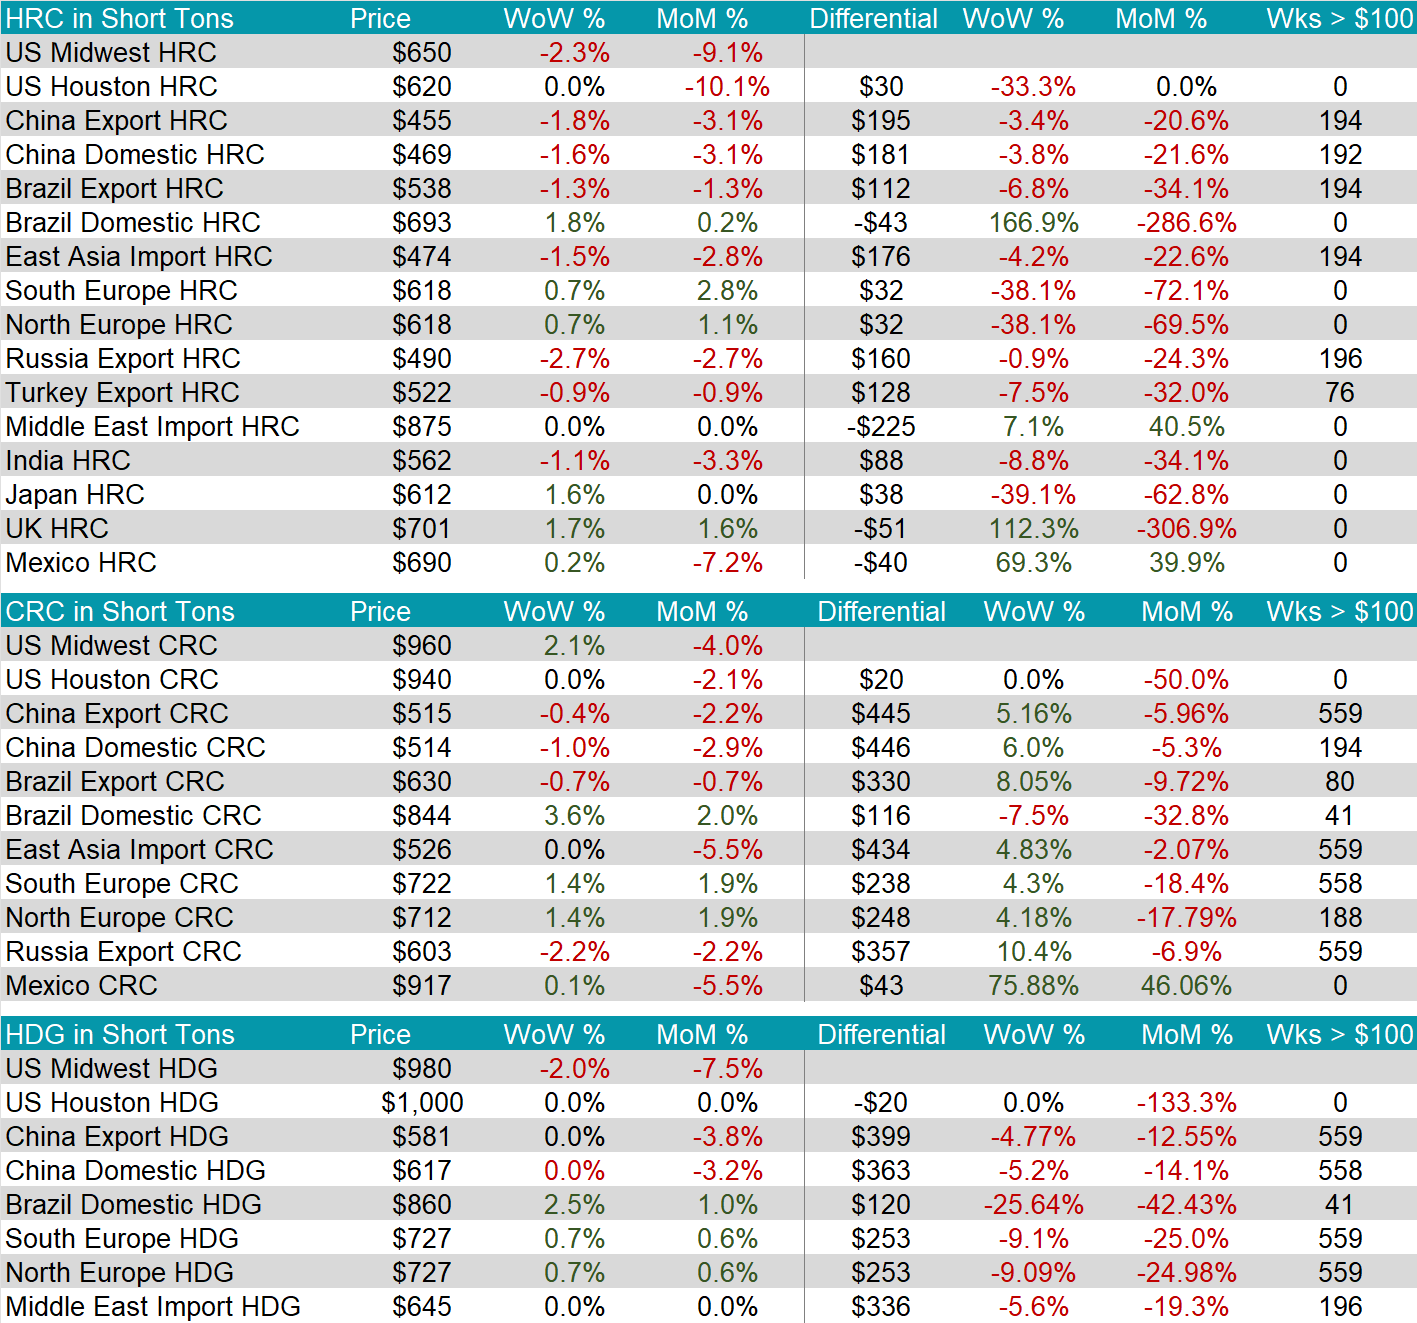
Last week, the HRC spot price fell by another $15 or 2.3%, to $650, while the 2nd month (August) future was down $14, or 2%. Over the last 5 weeks, the spot price has fallen more than double the 2nd month future, down 12.2%, versus 5.5%, respectively. The spot price continues to drag down futures prices in the front of the curve, as a signal that the market remains in a surplus material environment.
Over the last 3 months, tandem products have starting to diverge among themselves with both under varying degrees of downward pressure. This was even more pronounced this week, as CRC rose $20, to 960, while HDG fell $20, to $980.
Mill production broke out of the recent range last week, with both capacity utilization and raw production down 1.2% to 76.3%, and 26k 1.695m net tons, respectively – their lowest levels since the end of January.
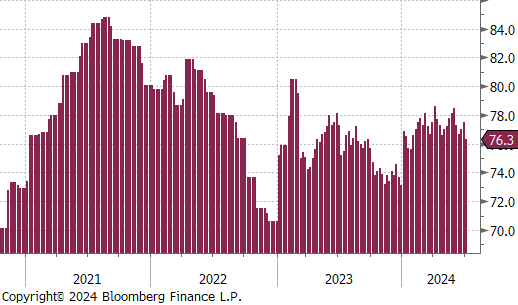
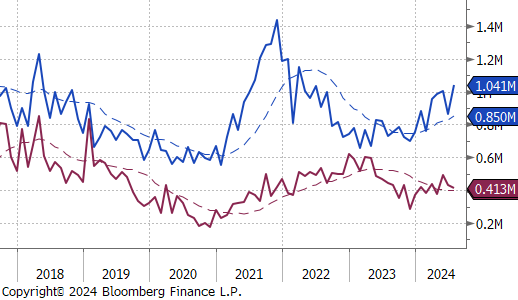
July Projection – Sheet 1041k (up 177k MoM); Tube 413k (down 19k MoM)
June Projection – Sheet 864k (down 140k MoM); Tube 432k (down 61k MoM)
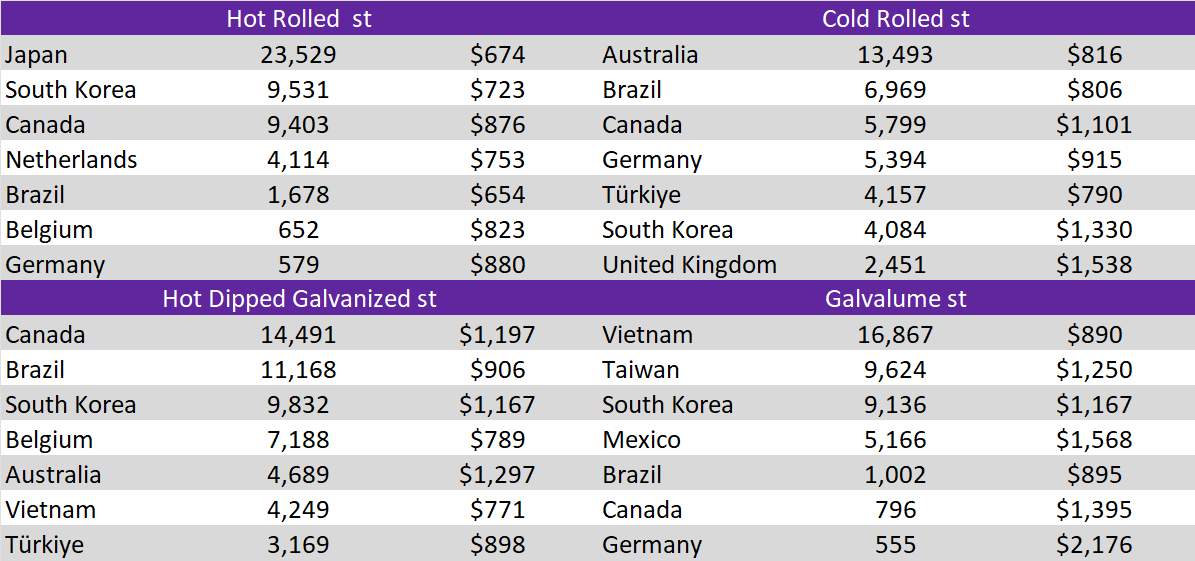
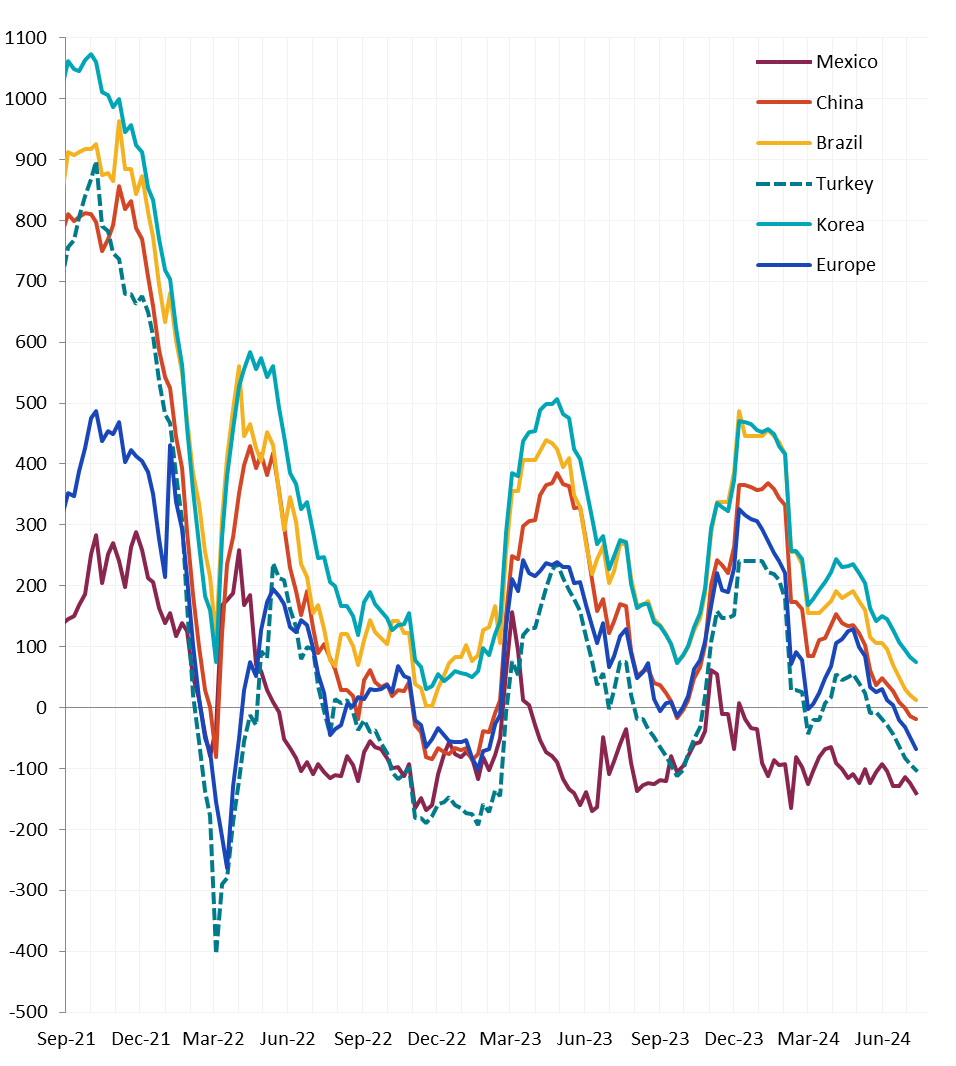
Differentials were lower across the board, with the U.S. domestic price falling more significantly than any other watched country. With this week’s move the global price is now at its lowest level since before the pandemic rally.
Scrap
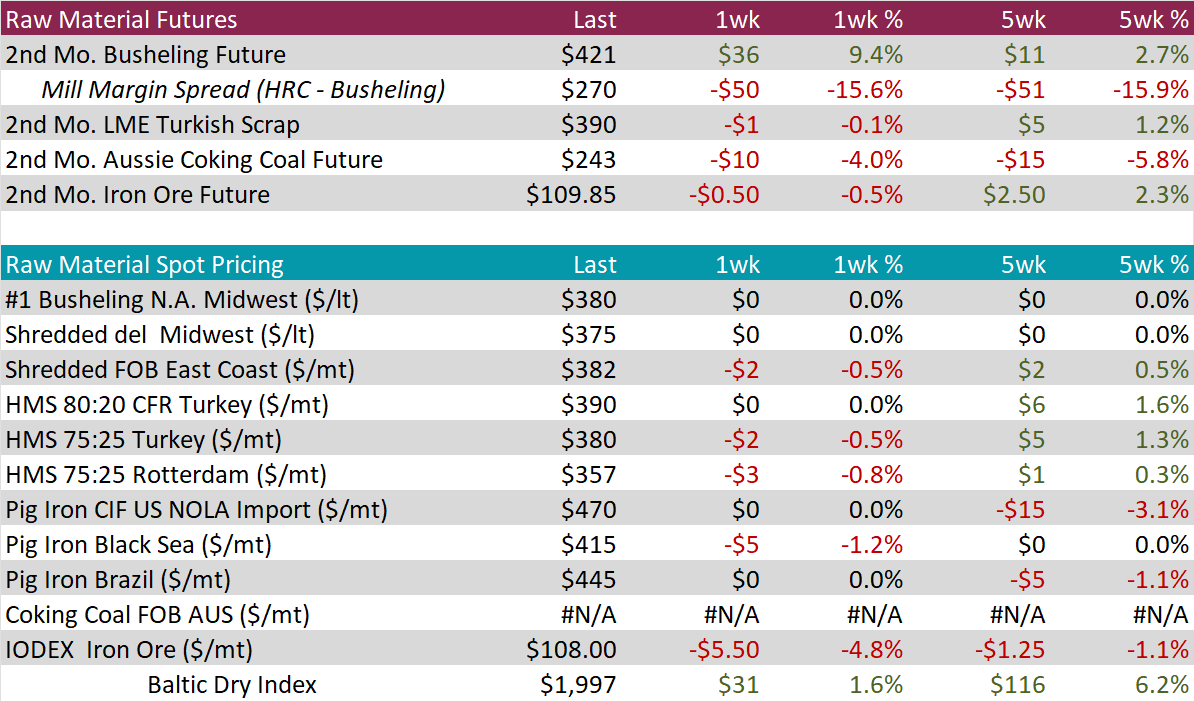
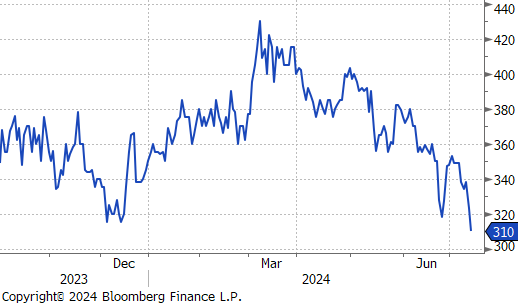
The 2nd month Busheling (September) future was up $36 or 9.4% to $421. Part of this move was the result of the futures rolling up a contango curve into the next month, but most of the increase was the result of the surprising July settle, which came in ~$30 higher than the market was pricing in. This brings the Sep. 24 mill margin spread down to its lowest level since the two contracts began trading last year.
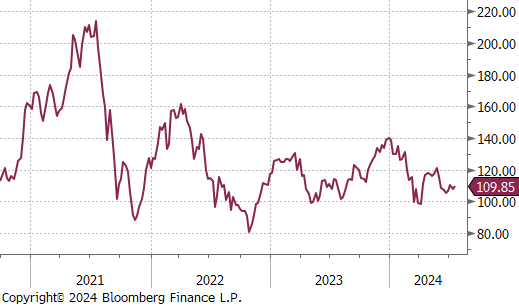
The 2nd month Iron ore future also traded down only slightly on the week, while the IODEX iron ore index fell by $5.50, or 4.8% to $108.
Dry Bulk / Freight
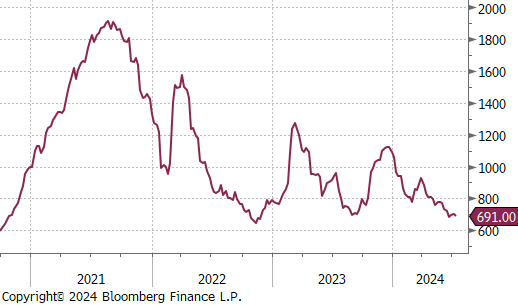
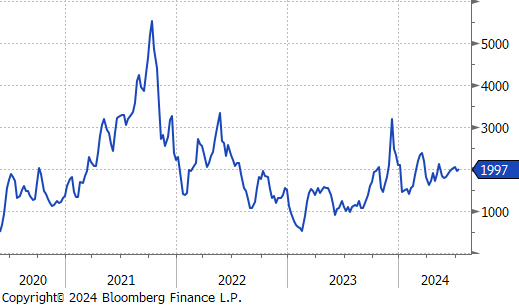
The Baltic Dry Index was up $31 to $1,997 and clearly remains in an overall uptrend, which continues to underscore the elevated risks to existing supply chains.
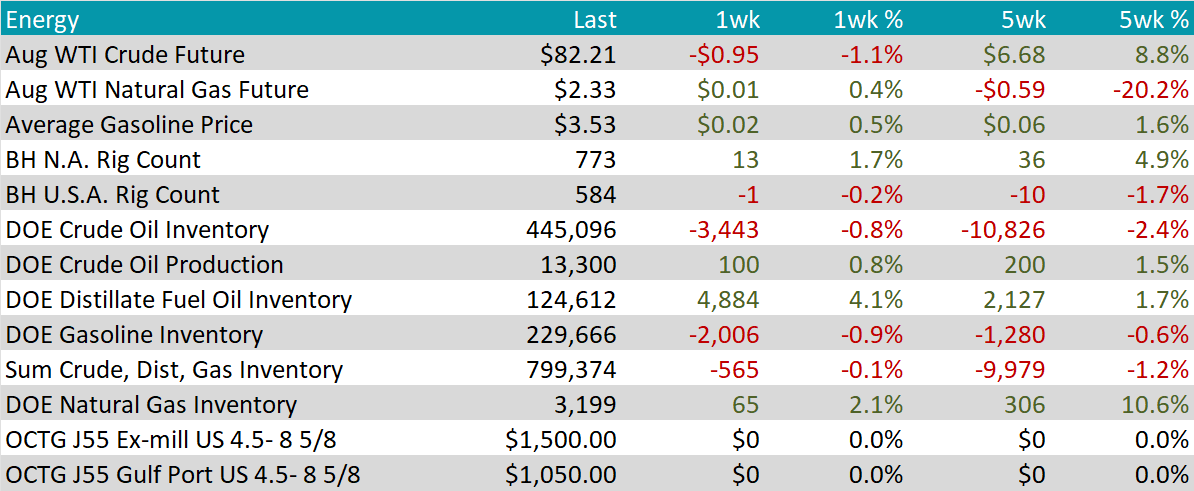
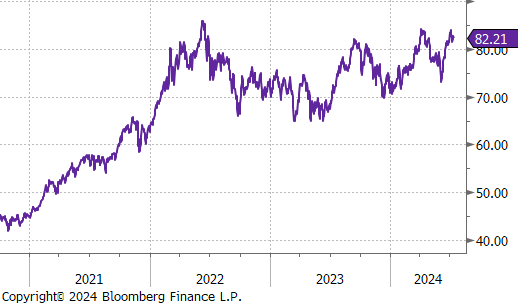
August WTI crude oil future lost $0.95 or 1.1% to $82.21/bbl.
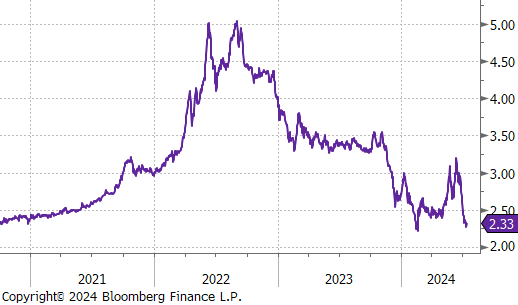
August WTI natural gas future gained $0.01 or 0.4% to $2.33/bbl.
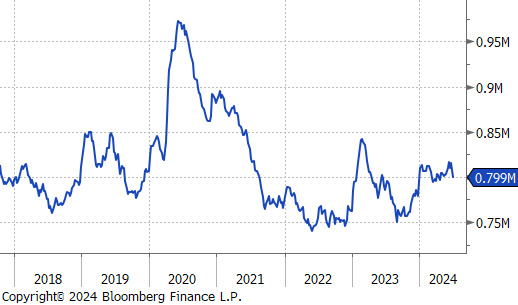
The aggregate inventory level was down 0.1%.
The Baker Hughes North American rig count rose by 13 rigs, while the U.S. count lost 1. This underscores the recent 5-week divergence between North American as a whole (up 36) with the U.S. down 10 over that period.
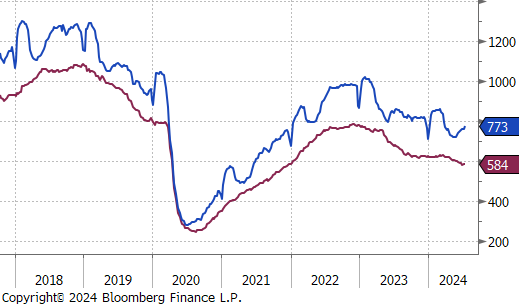
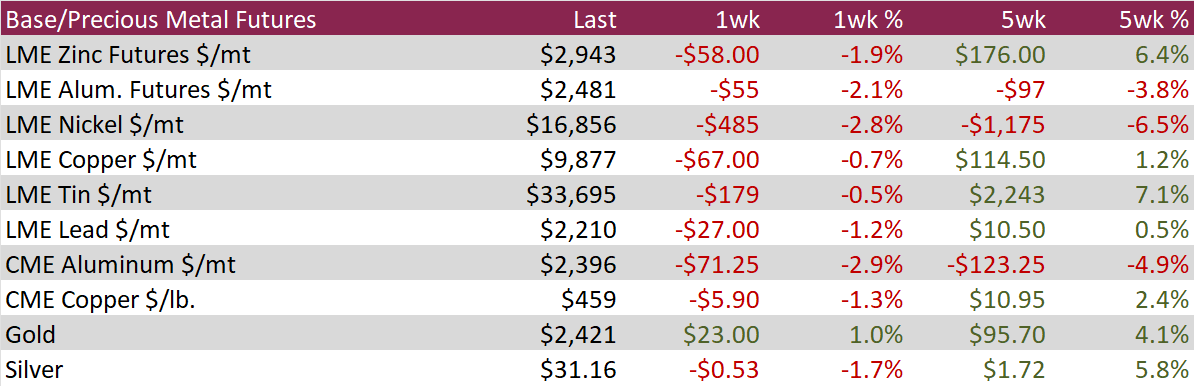
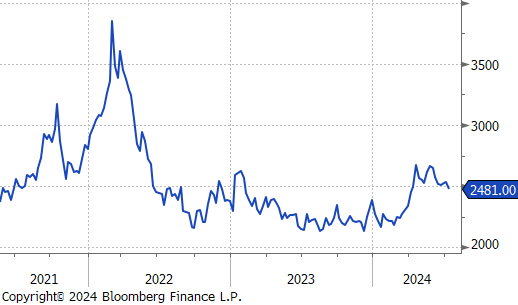
Aluminum slipped this week down $55 or 2.1% to 2,481, reaching its lowest weekly level since the first week of April. Interestingly, June data shows that inventory stocks fell sharply over the month, in stark contrast with what was seen in Copper, Lead, and Nickel. Muted demand, driven by seasonality was the main driver of this week’s decline. Interestingly, the “melt and pour” requirements imposed by the Biden administration for Mexican steel and aluminum appeared to have no immediate impact on prices.
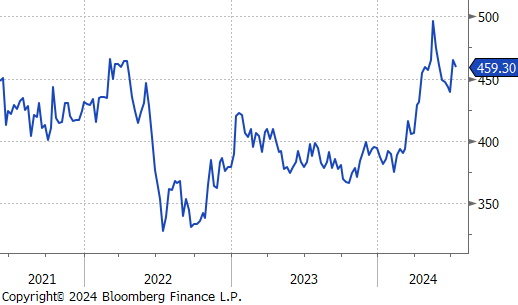
Copper was down last week as well, losing $67, or 0.7%, to $9,877 on the LME. Steady as it goes on the expectations side. Investors look to a September interest rate cut in the U.S. and Chinese stimulus in response to mixed/weaker economic data. Inventories are expected to continue the June trend of steady increases throughout July.
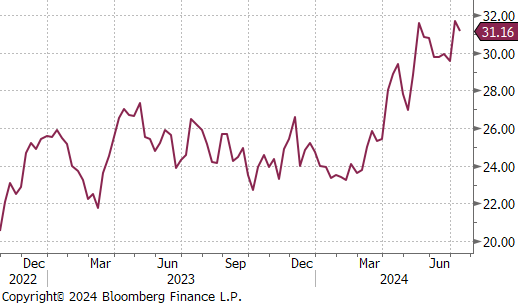
Silver lost $0.53, or 1.7%, as well, coming in at $31.16. The move lower pushes silver off its highest peak since January 2013. Encouraging inflation data and market expectations for continued stimulus in China are structurally supportive, in addition to the perceived structural shortage in the market.
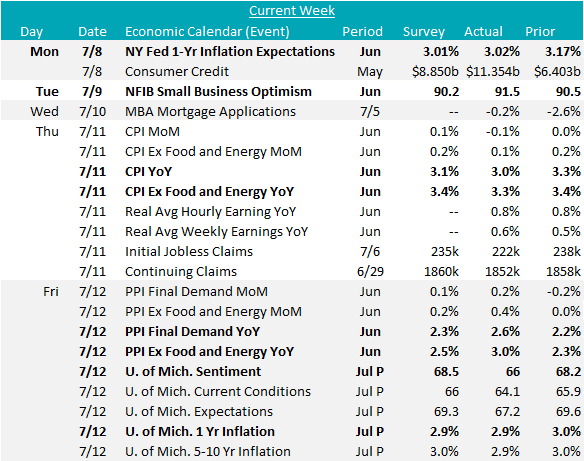
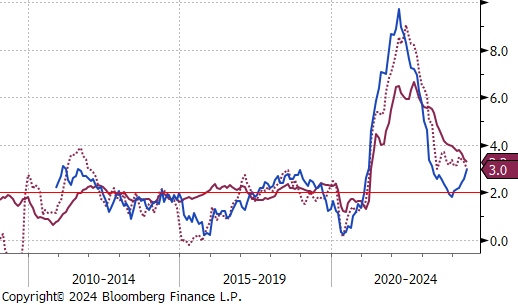
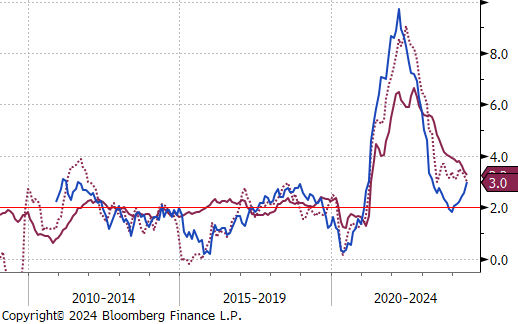
Last week provided more encouraging developments in inflation data. June Topline and Core CPI (Consumers) YoY both came in lower than last months readings and below expectations at (3% versus expected 3.1%), and (3.3% versus expected 3.4%), respectively. On the other hand, Topline and Core PPI (Producers) YoY moved in the opposite direction, up (2.6% versus expected 2.3%), and (3% versus expected 2.5%), respectively. For PPI, the recent surge comes after months of readings where producer pricing was leading consumer pricing lower. Current levels could be digested, as long as it remains temporary.
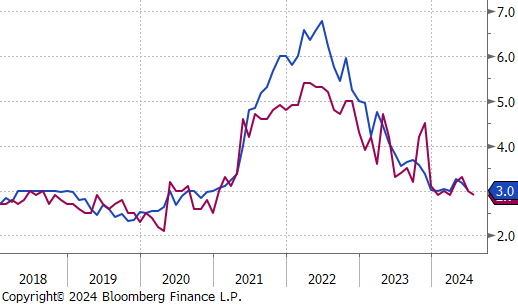
Additional encouraging news comes from June’s consumer expectations on near term pricing, with the NY FED 1yr Expectation only slightly above the expectation at 3.02%, and well below last months 3.17%. Additionally, the preliminary July data from the University of Michigan 1yr Expectation at 2.9%, in line with expectations and down from the June reading at 3%.
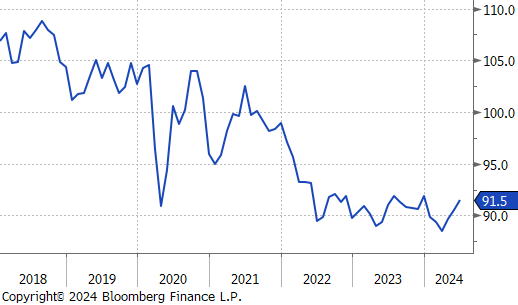
Finally, the June NFIB Small Business Optimism Index continued its trend of increases for the third month. Printing at 91.5, above the expected contraction to 90.2. This is the highest reading since December of last year.