Flack Capital Markets | Ferrous Financial Insider
July 19, 2024 – Issue #441
July 19, 2024 – Issue #441
Overview:

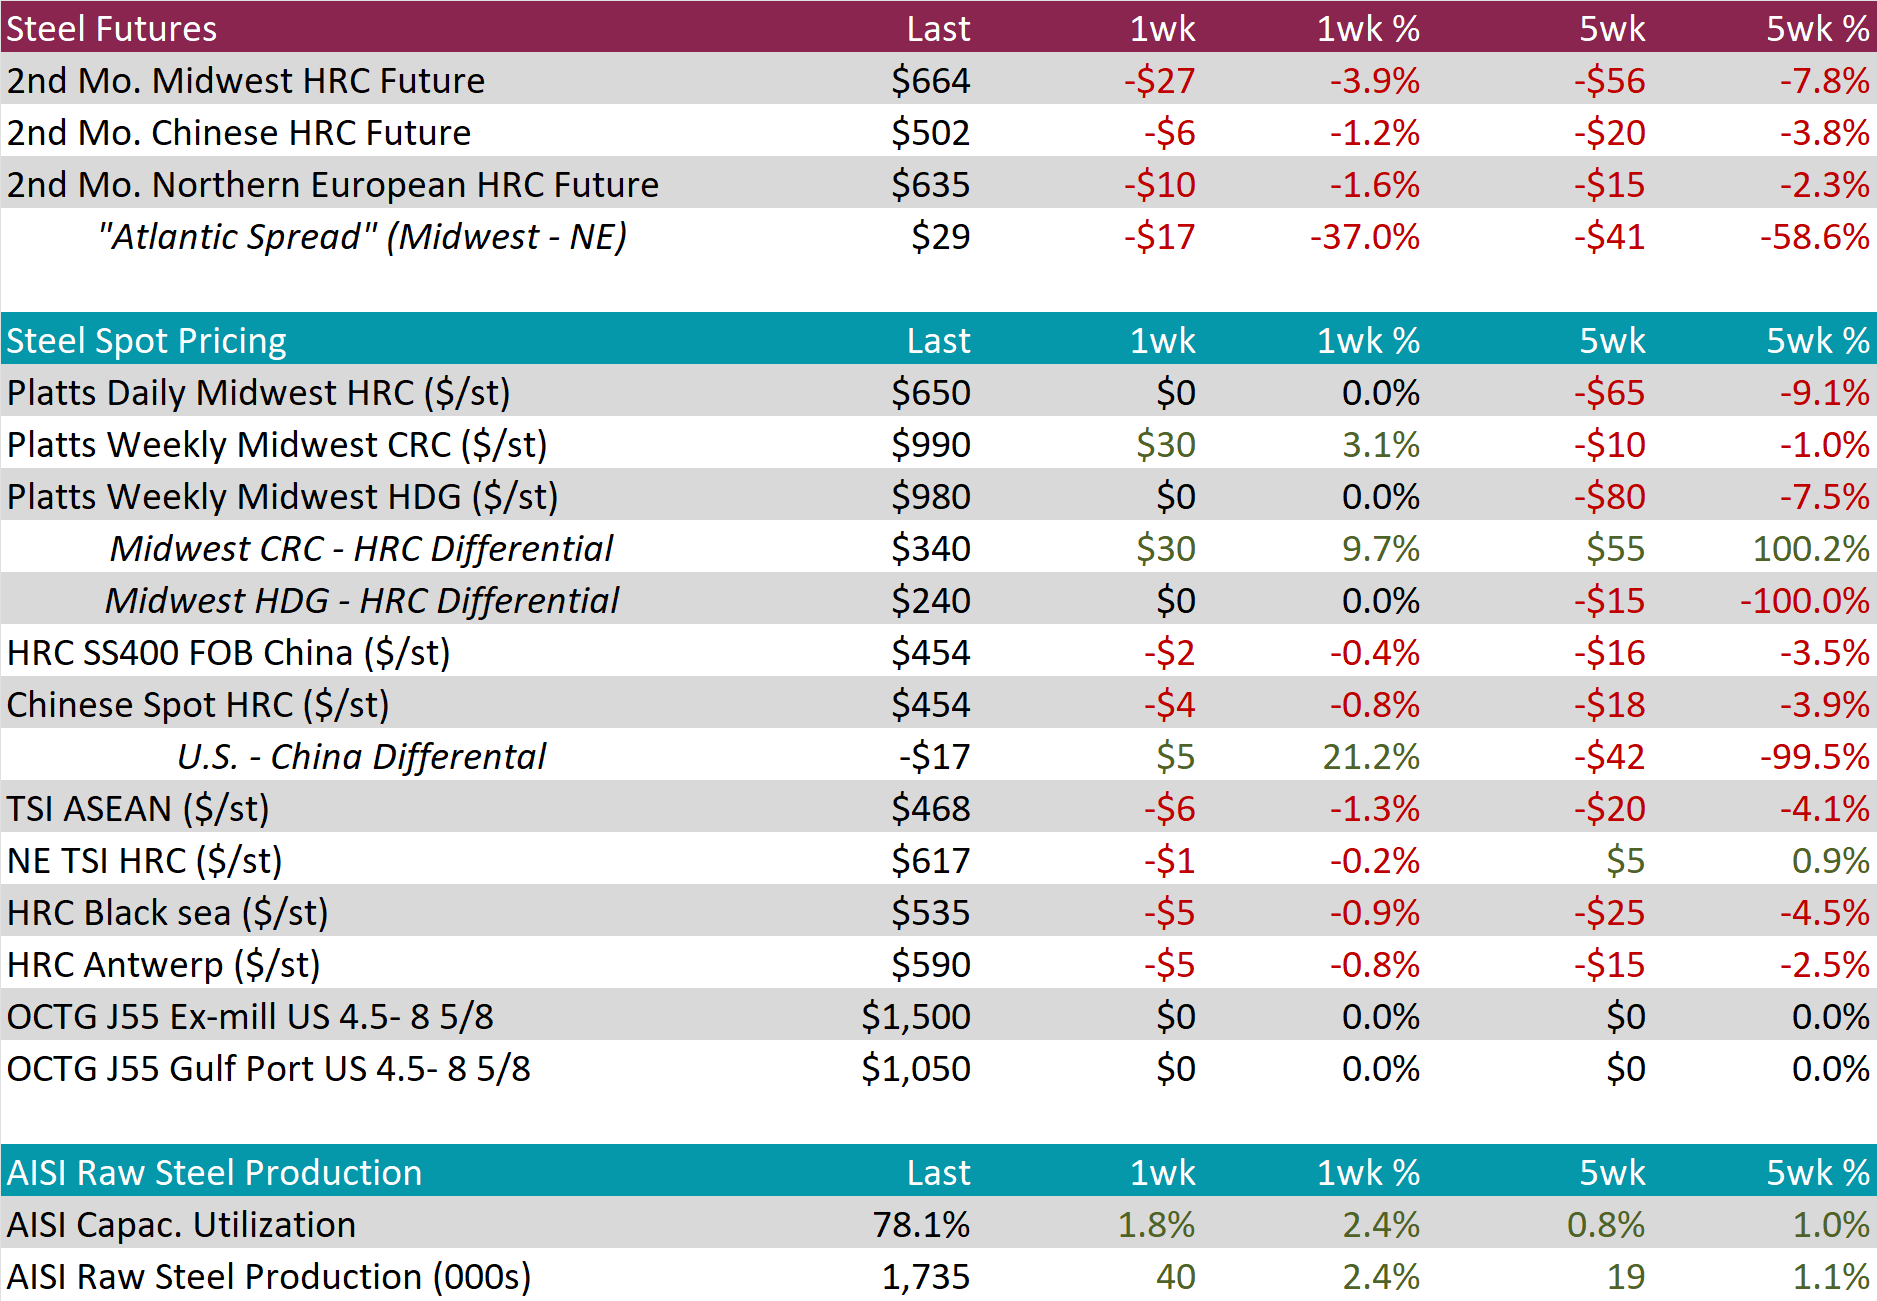
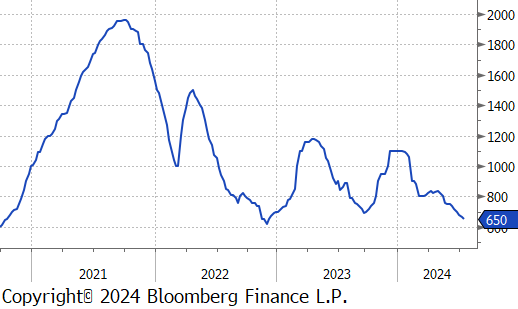
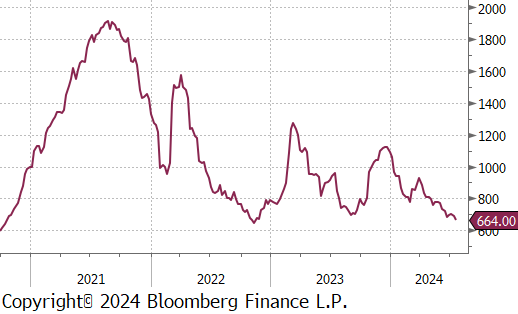
The HRC spot price held steady at $650, causing in the five-week price change to be down by $65 or -9.1%. At the same time, the HRC 2nd month future fell by $27 or -3.9% to $664, hitting its lowest level since November 2022.
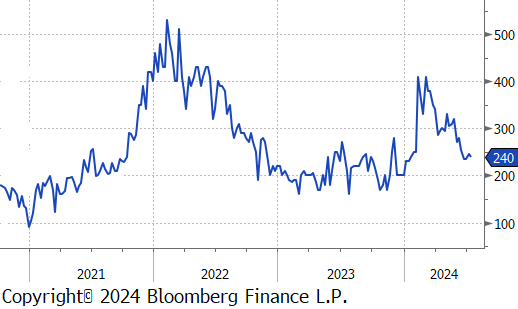
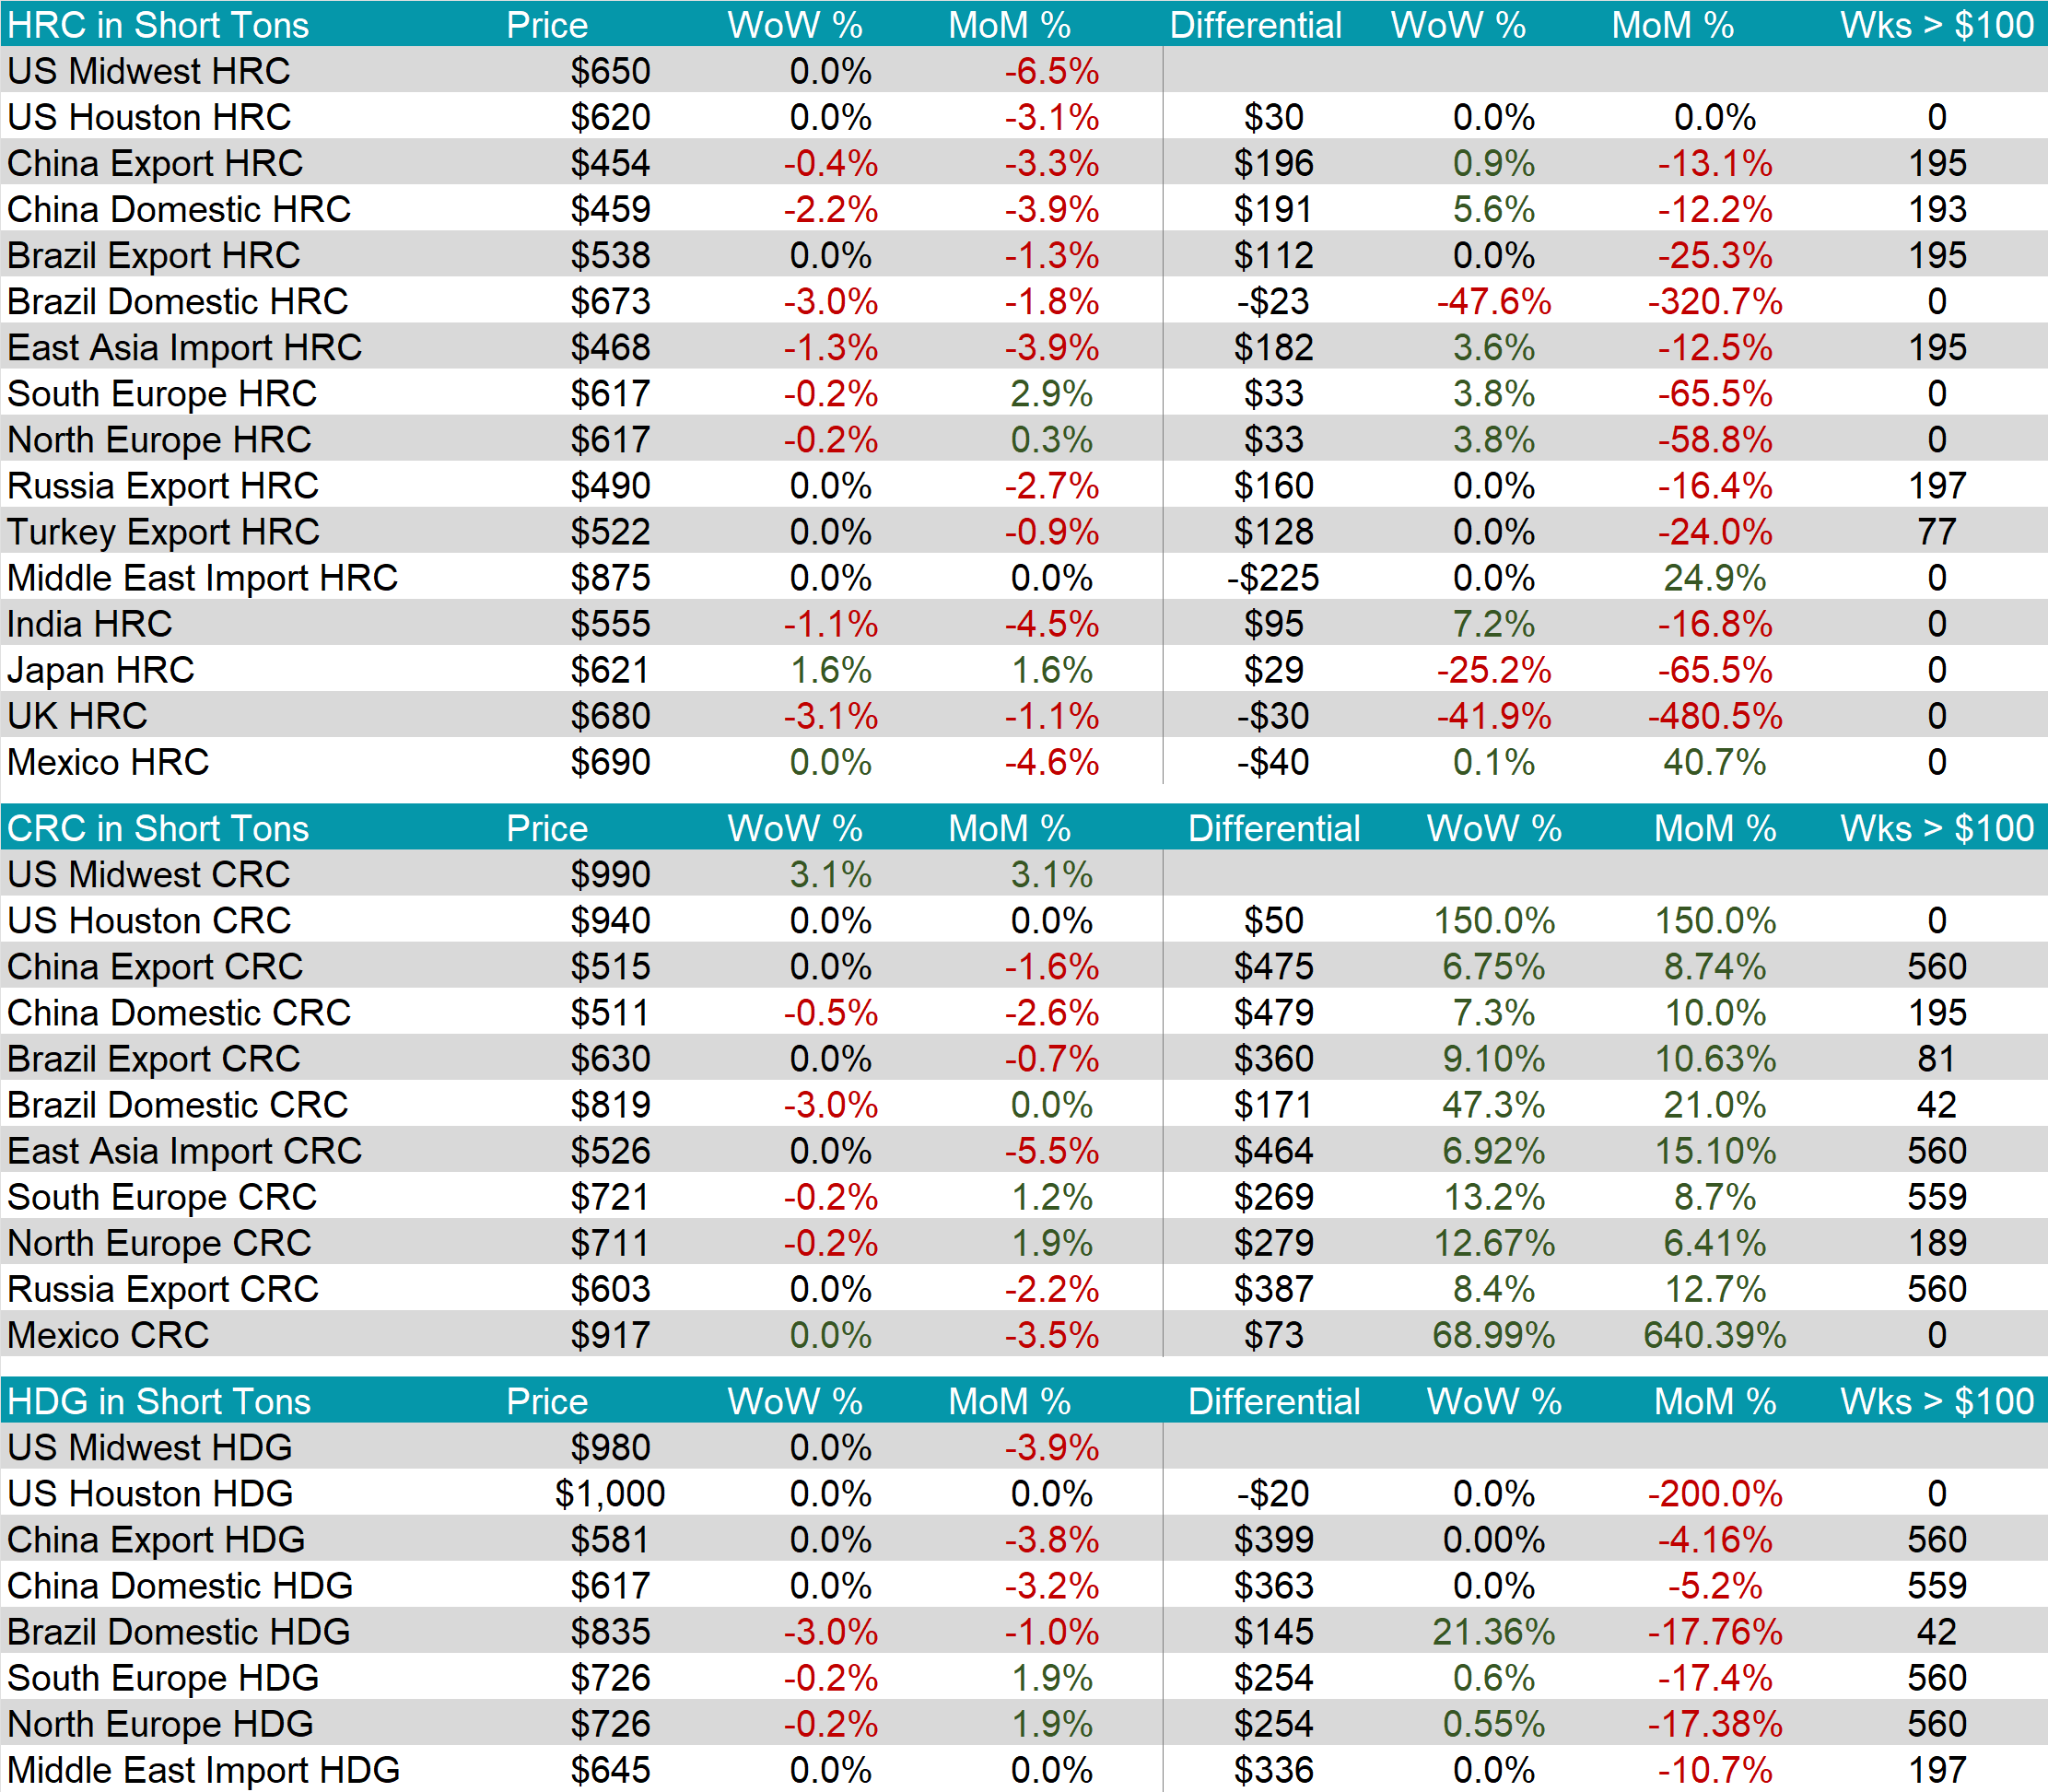
Tandem products were mixed this week with CRC rising by $30, while HDG remained unchanged, resulting in the HDG – HRC differential to stay at $240.
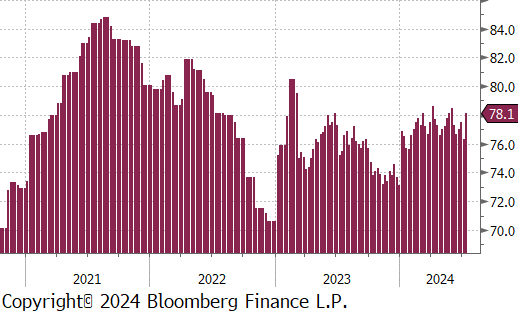
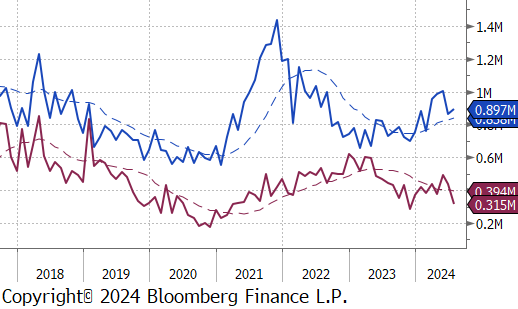
Mill production rebound from last week recent low, with capacity utilization ticking up by 1.8% to 78.1%, bringing raw steel production up to 1.735m net tons – the highest since May.
July Projection – Sheet 987k (up 31k MoM); Tube 315k (down 121k MoM)
June Projection – Sheet 865k (down 139k MoM); Tube 437k (down 57k MoM)
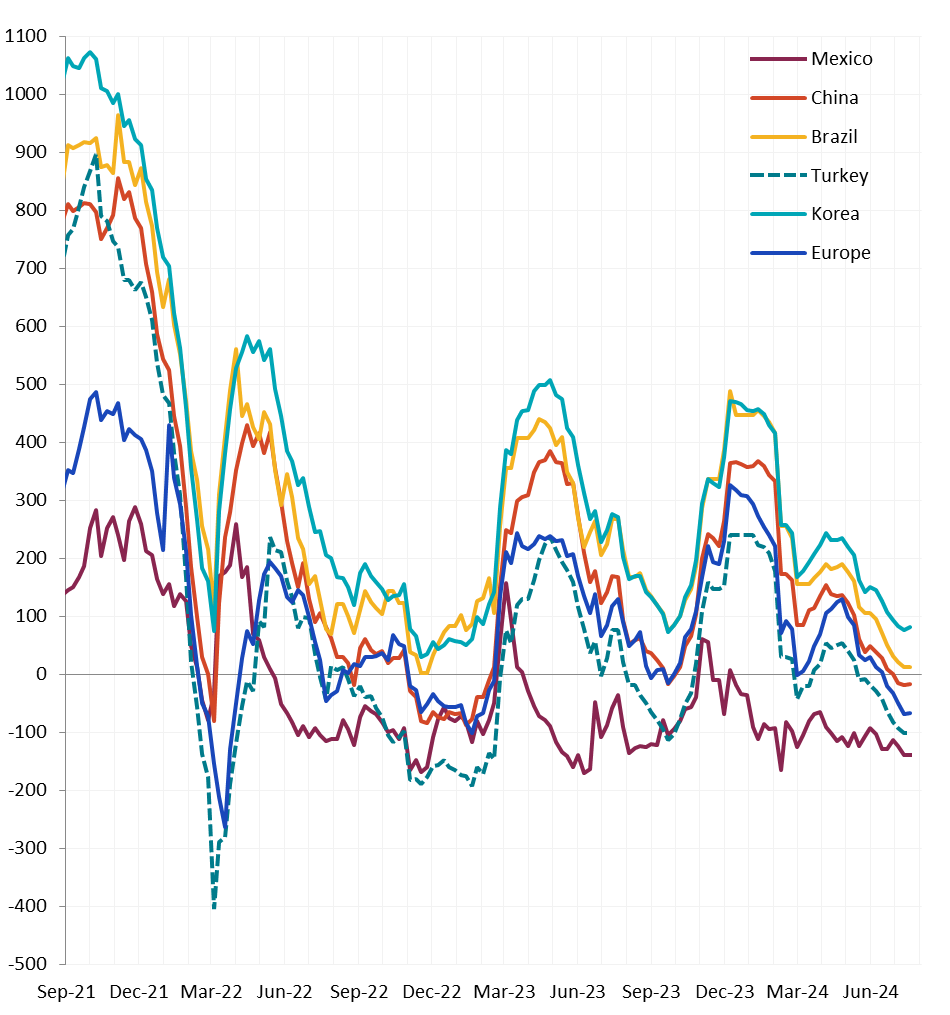
All watched global differentials expanded slightly this week. Main price changes were from Brazil Domestic HRC falling by -3.0% and from China Domestic HRC declining by -2.2%.
Scrap
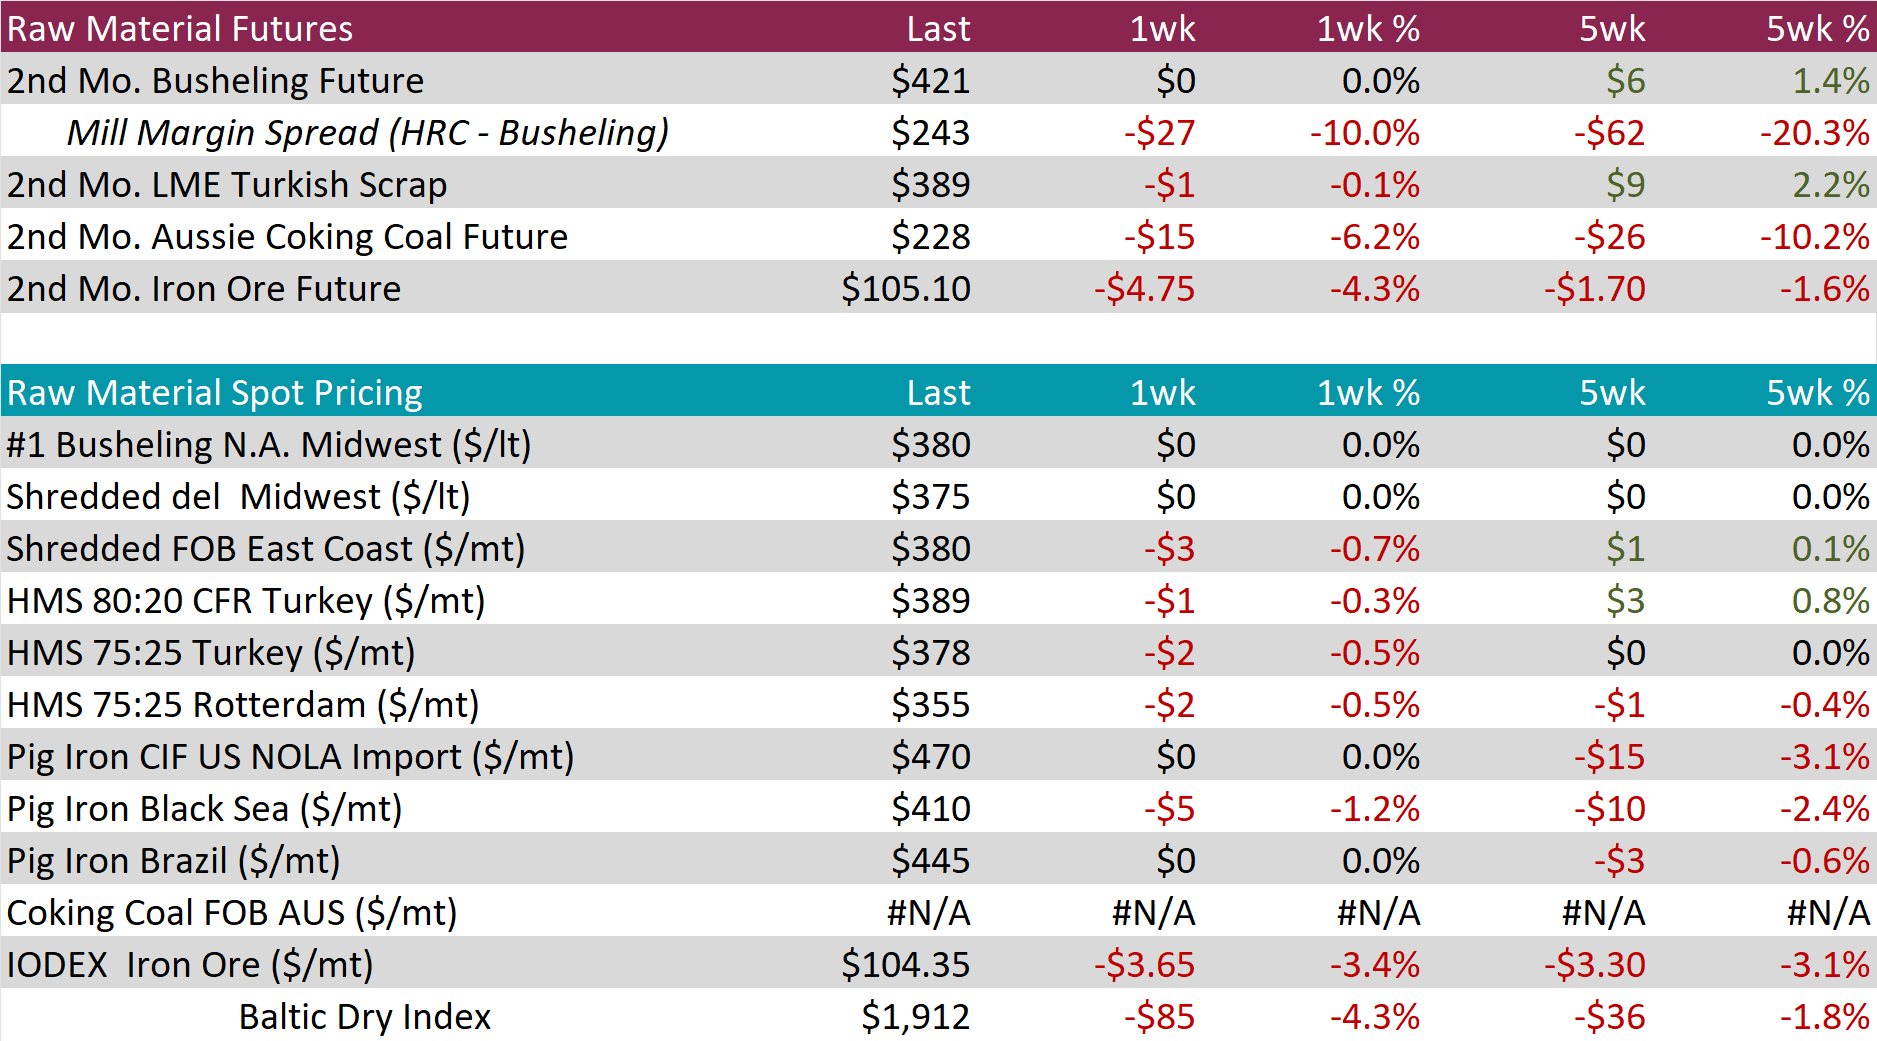
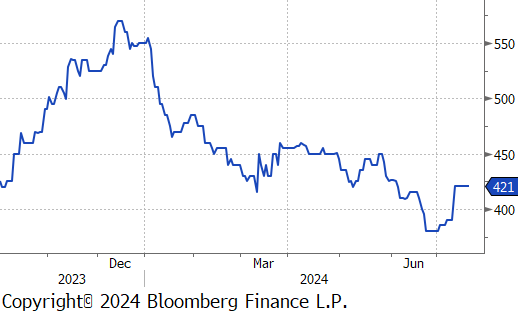
The 2nd month busheling future stayed at $421, causing the five-week price change to be up by $6 or 1.4%.
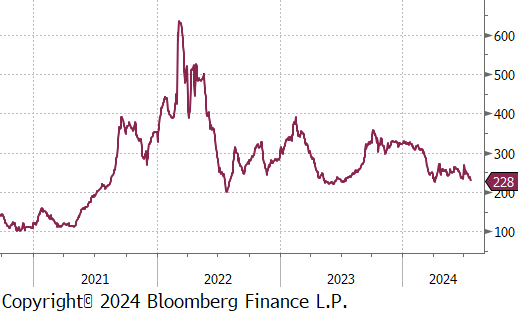
The Aussie coking coal 2nd month future dropped by $15 or -6.2% to $228, reaching its lowest price since early April.
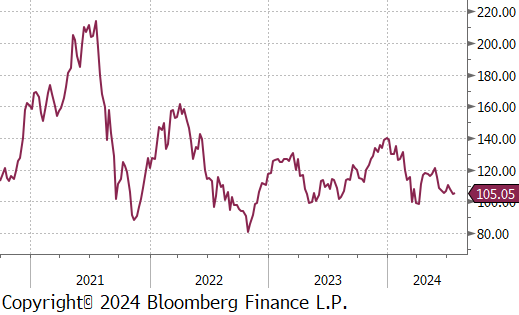
The iron ore 2nd month future fell by $4.75 or -4.3% to $105.10, marking the second consecutive week of price declines.
Dry Bulk / Freight
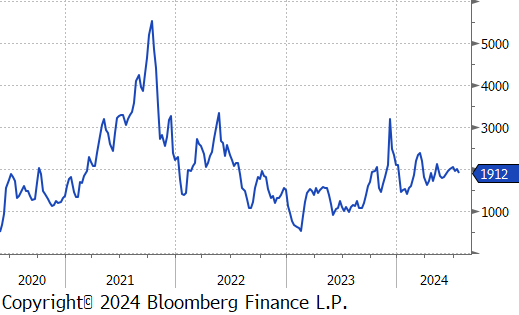
The Baltic Dry Index slipped by $85 or -4.3% to $1,912, marking a six-week low after seemingly rebound last week.
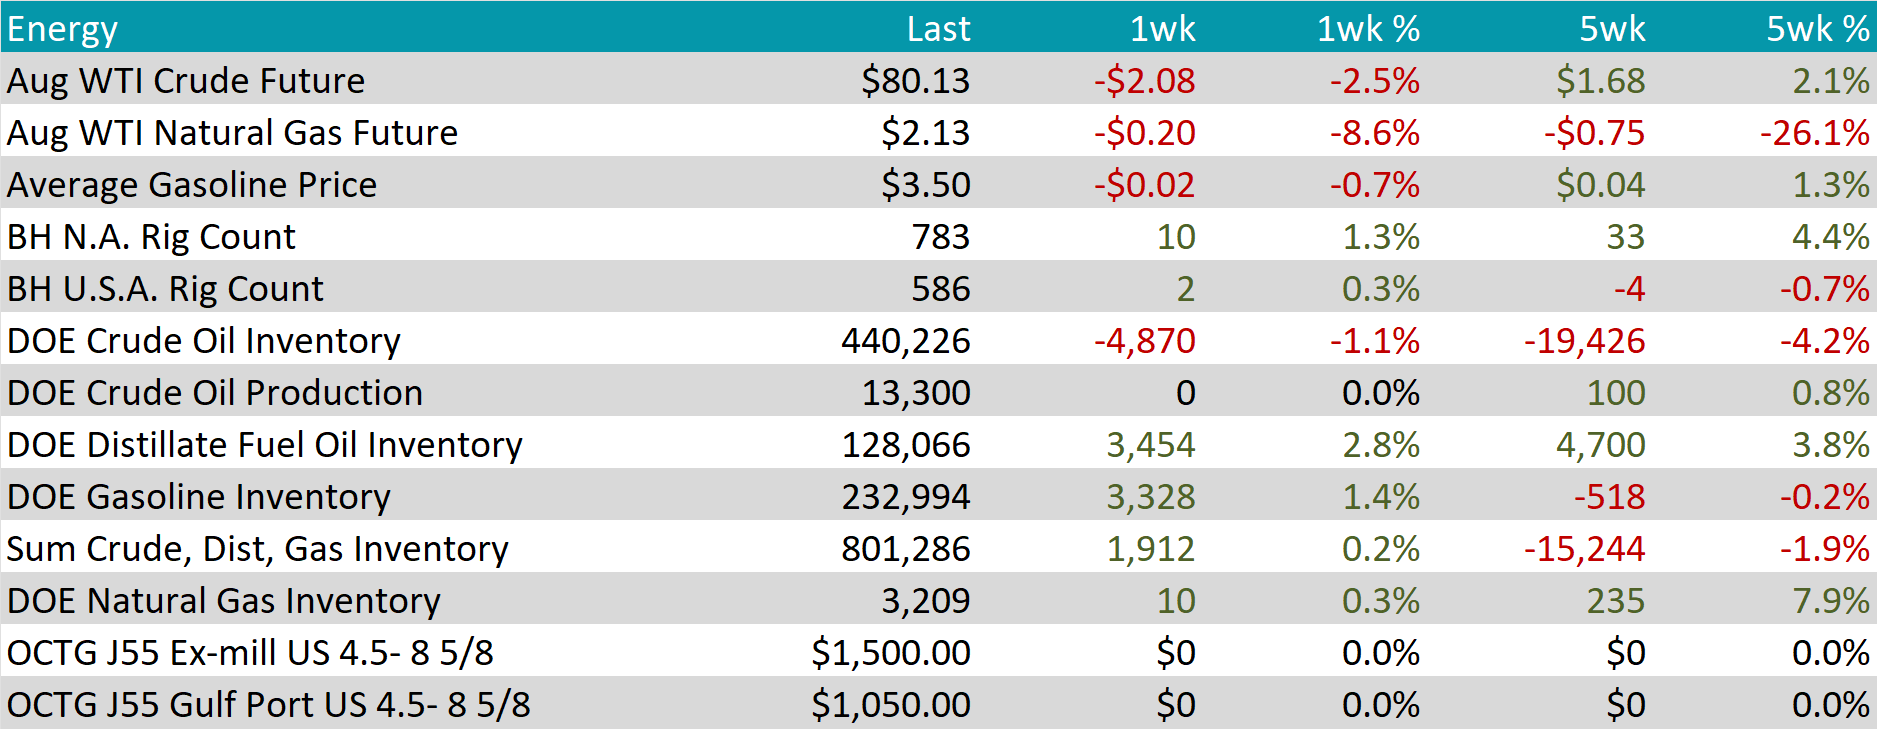
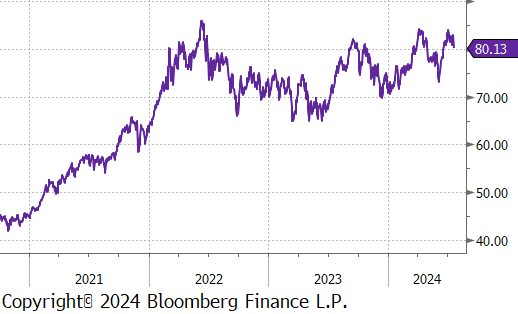
WTI crude oil future lost $2.08 or -2.5% to $80.13/bbl.
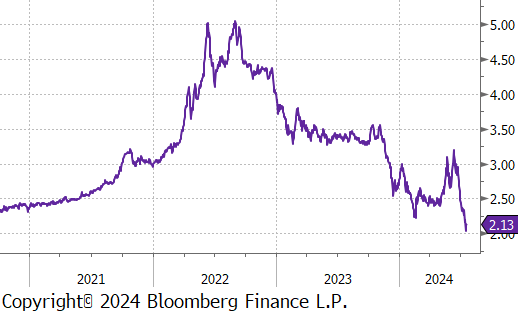
WTI natural gas future lost $0.20 or -8.6% to $2.13/bbl.
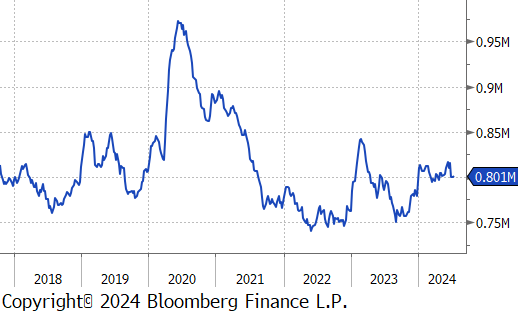
The aggregate inventory level experienced a slight increase of 0.2%.
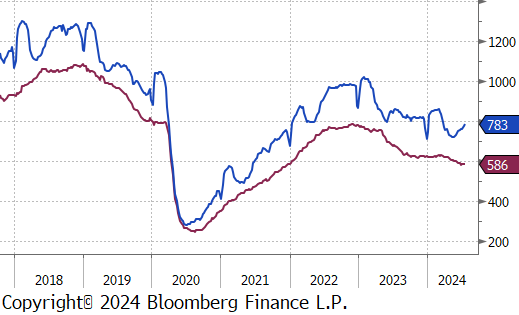
The Baker Hughes North American rig count added 10 rigs, bringing the total count to 783 rigs. The US rig count also increased, adding 2 rigs, bringing the total count to 586 rigs.
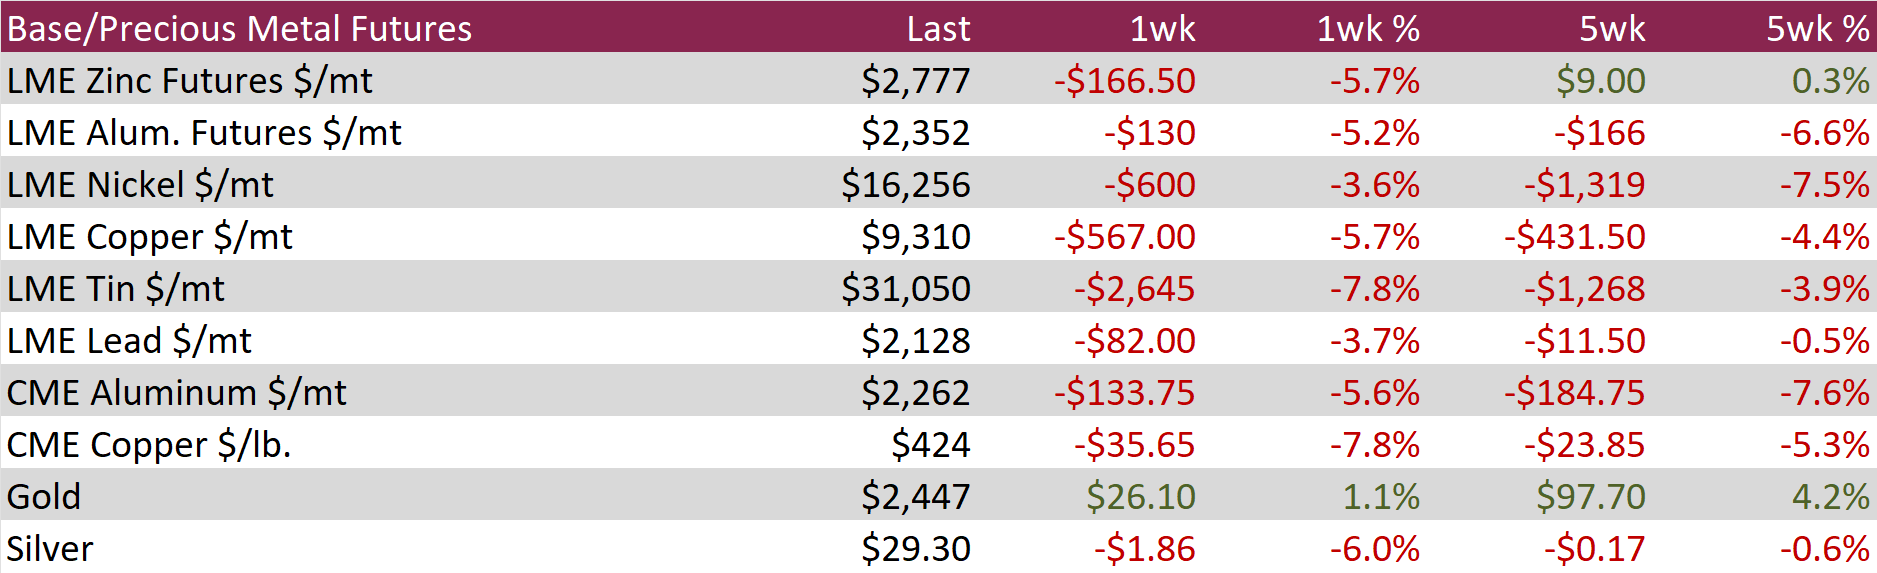
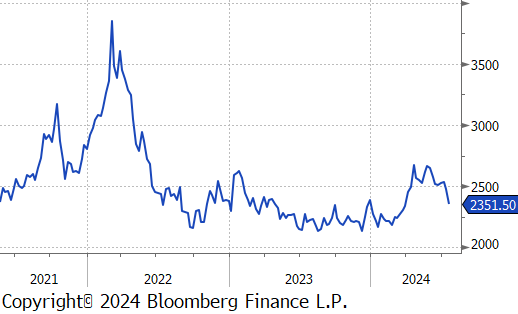
Aluminum futures dropped by $130 or -5.2% to $2,352, the lowest in over three months and following a broader selloff in base metals driven by weak demand and abundant supply from China. Improved hydropower availability in Yunnan, due to increased rainfall, allowed Chinese smelters to restart idled capacity, alleviating earlier concerns about dry weather disrupting operations. This led to a 6.2% annual increase in China’s primary aluminum output in June, reaching 3.76 million tonnes, the highest since November 2014. Meanwhile, economic data indicated that domestic demand for factory goods in China remained subdued. The NBS manufacturing PMI showed consecutive contractions in June, and a 109% surge in alumina exports suggested that manufacturers were increasingly relying on export markets for sales.
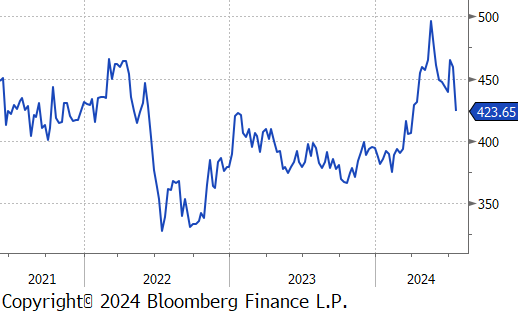
Copper futures fell by $35.65 or -7.8% to $424, hitting a three-month low due to weak industrial demand and the absence of new stimulus measures from China, the top consumer. A key political meeting in Beijing last week disappointed investors, as it failed to outline concrete policy plans to address economic challenges. In an unexpected move, the People’s Bank of China cut its one-year and five-year loan prime rates by 10 basis points, setting them at new lows of 3.35% and 3.85%, respectively, to revive the fragile economy. On the supply side, copper inventories in LME warehouses rose to their highest levels since September 2021, while inventories in China’s bonded warehouses reached their highest since May 2023.
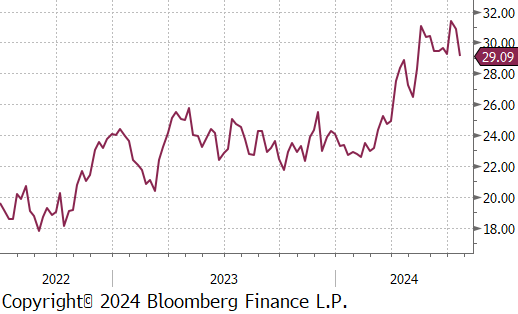
Silver declined by $1.86 or -6.0% to $29.30. This drop occurred despite China’s unexpected move to cut key lending rates to new lows to support its economy. Additionally, the Third Plenum held last week did not deliver the new stimulus measures investors had hoped for, as it failed to outline concrete policy plans to address China’s economic challenges. Elsewhere, silver and other commodities faced pressure from a strengthening dollar, even though the US Federal Reserve is widely expected to begin cutting rates in September. Earlier in the year, silver had rallied sharply due to expectations that industrial demand from the clean energy sector would outpace supply, but the market has since tempered those expectations.
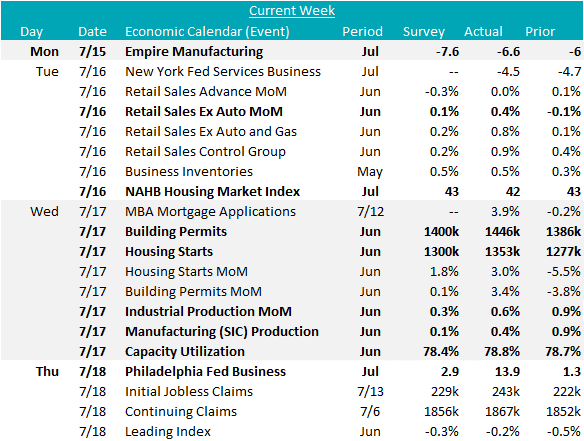
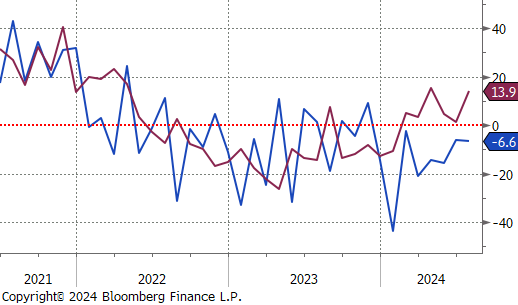
In the manufacturing sector, the first two FED Manufacturing Surveys for July were released. Empire (NY) printed lower, to -6.6, from -6, but came in above expectations of -7.6. Philly jumped higher, printing at 13.9, up from 1.3 in June, and well above the expectations of a modest increase to 2.9.
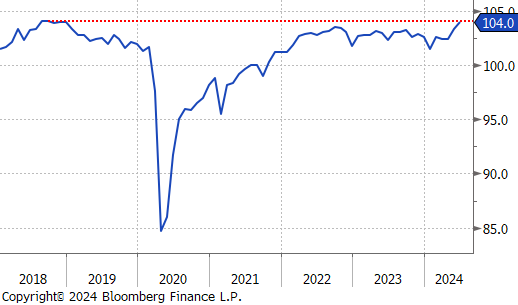
Another encouraging datapoint came from June Industrial Production which rose to 0.6% and surpassed the market expectation of a 0.3% print to 104.0 (the second highest reading on record). Capacity Utilization also rose to 78.8%, a 9-month high, while still historically subdued. Looking to the future, the fact that production is so high while capacity utilization is restrained is a very encouraging signal for future steel demand. Manufacturing (SIC) Production, which accounts for over 75% of industrial production, similarly surprised to the upside, increasing by 0.4% versus the anticipated 0.1%.
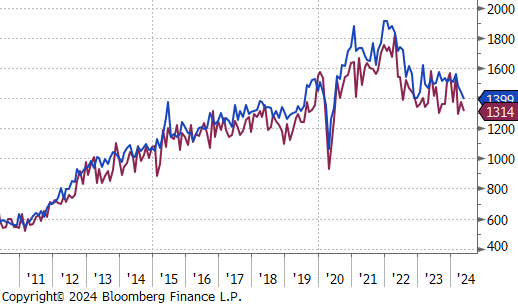
On the housing/construction side, Housing Starts and Building Permits both came in above expectations and rebounded from last months local lows. Starts rose by 3% to an annualized rate of 1,353k, above the expectation of a slight increase to 1,300k. Building permits increased by 3.4% to an annual rate of 1,446k, above the expected 1,400k increase. Additionally housing data underscore the current ongoing concerns in the sector, with the NAHB (National Association of Home Builders) Housing Market Index declining for the 3rd straight month in July, printing down 1 point to 42. Like PMI’s, a reading above 50 signals expansion/optimism, while a print below shows contraction/concern.
Finally, Retail Sales from this week highlight the continued divergence between the service and industrial sides of the economy. Topline sales came in at 0.0%, which was better than the expected -0.3% reading. In contrast, Retail Sales ex. Auto came in well above expectations of 0.1%, printing up to 0.4% MoM – the 5th straight month increases. While the auto industry cyber attacks are referenced as culprits for the flat reading, broader data from 1H24 continue to suggest that pent-up auto demand is being kept in check by affordability concerns (i.e. flat production/swelling inventories).