Flack Capital Markets | Ferrous Financial Insider
July 5, 2024 – Issue #439
July 5, 2024 – Issue #439
Overview:
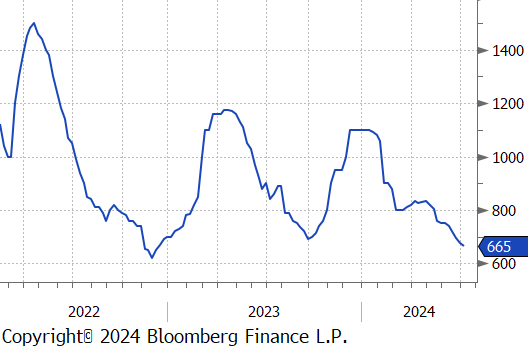
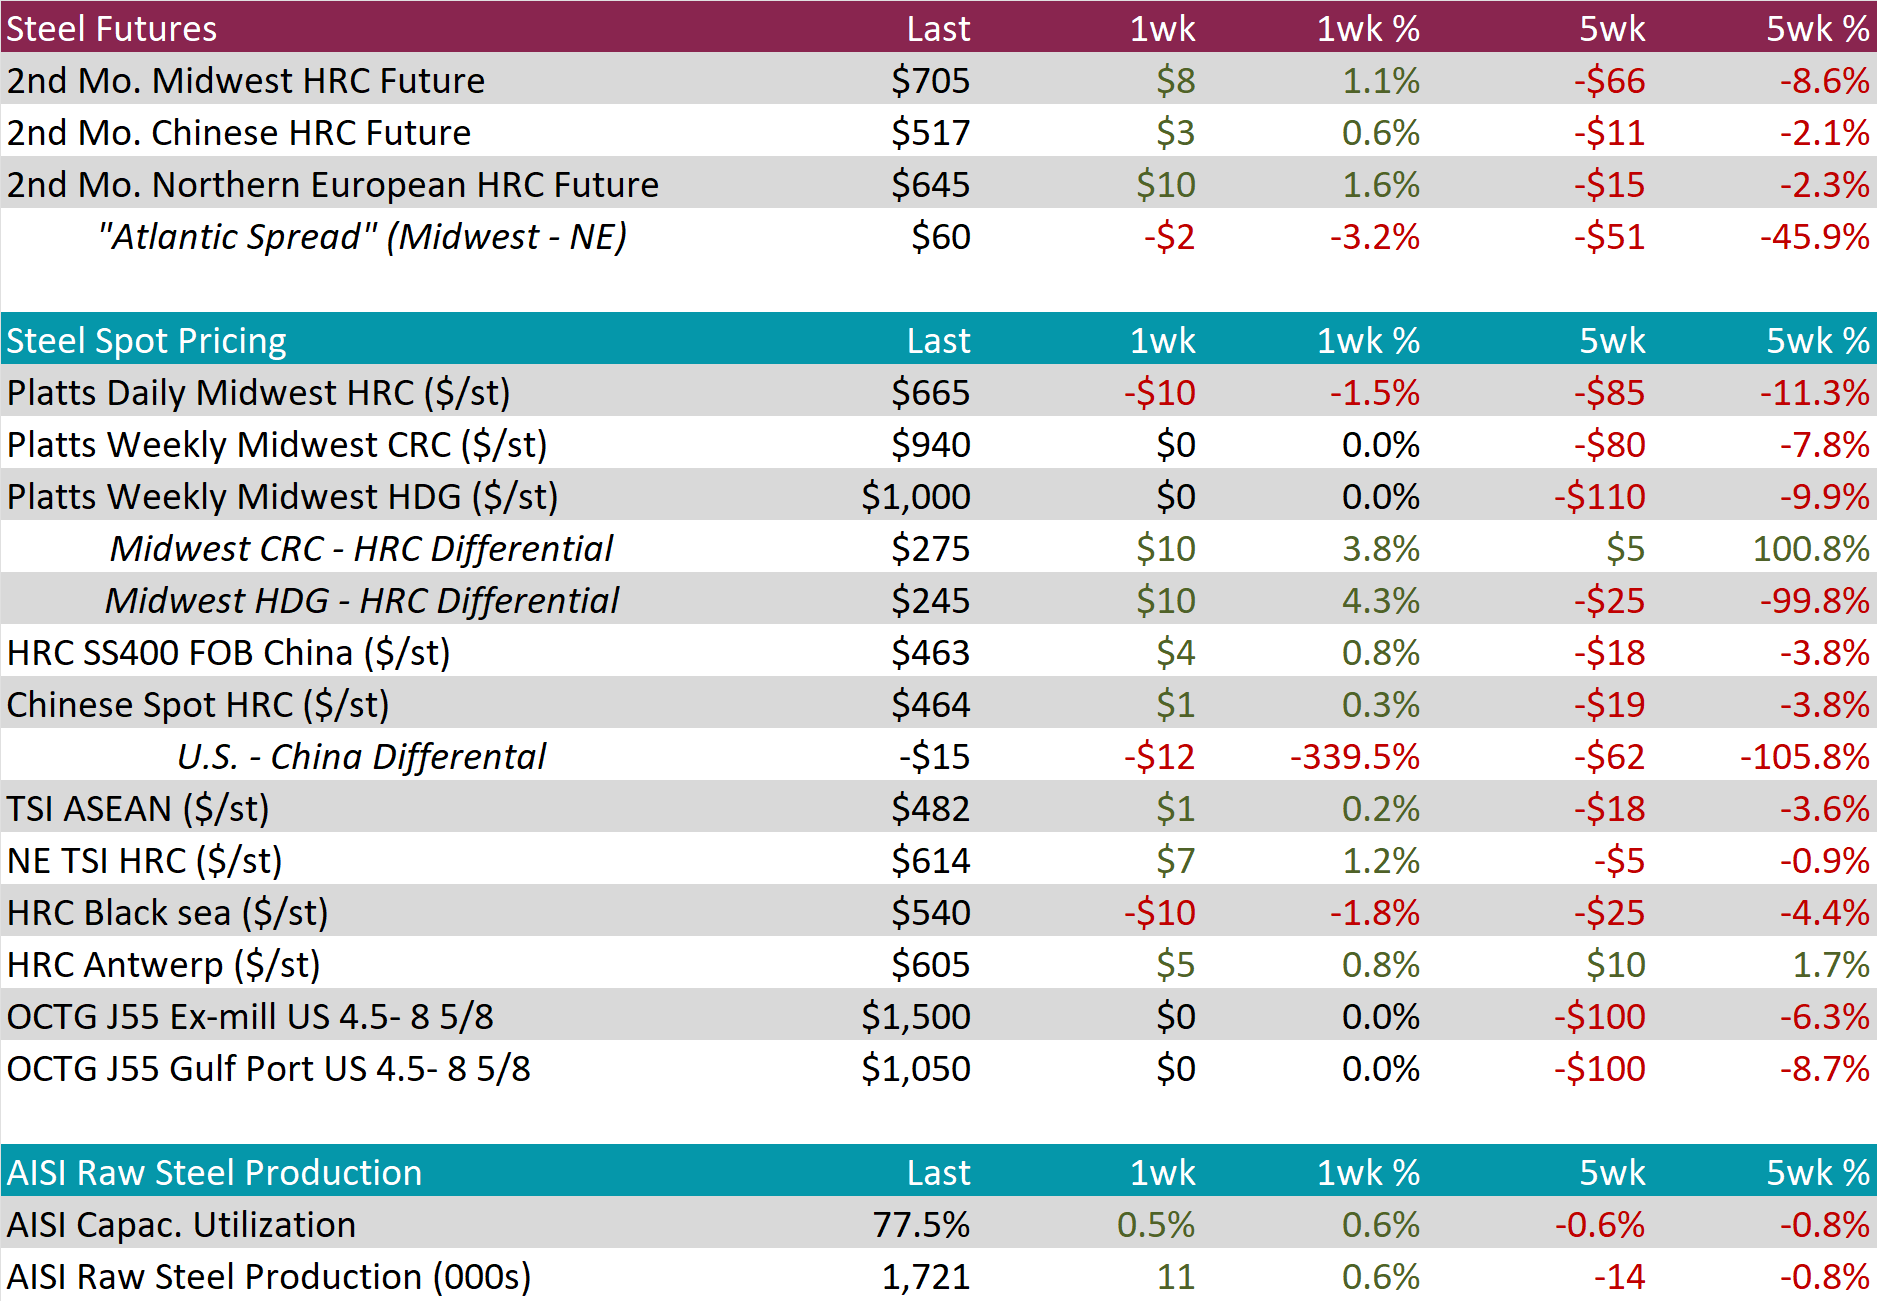
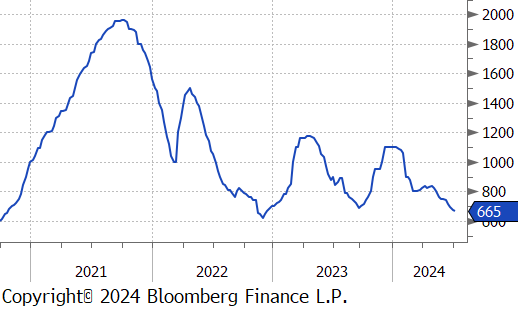
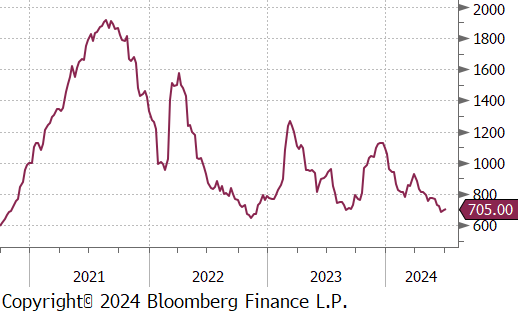
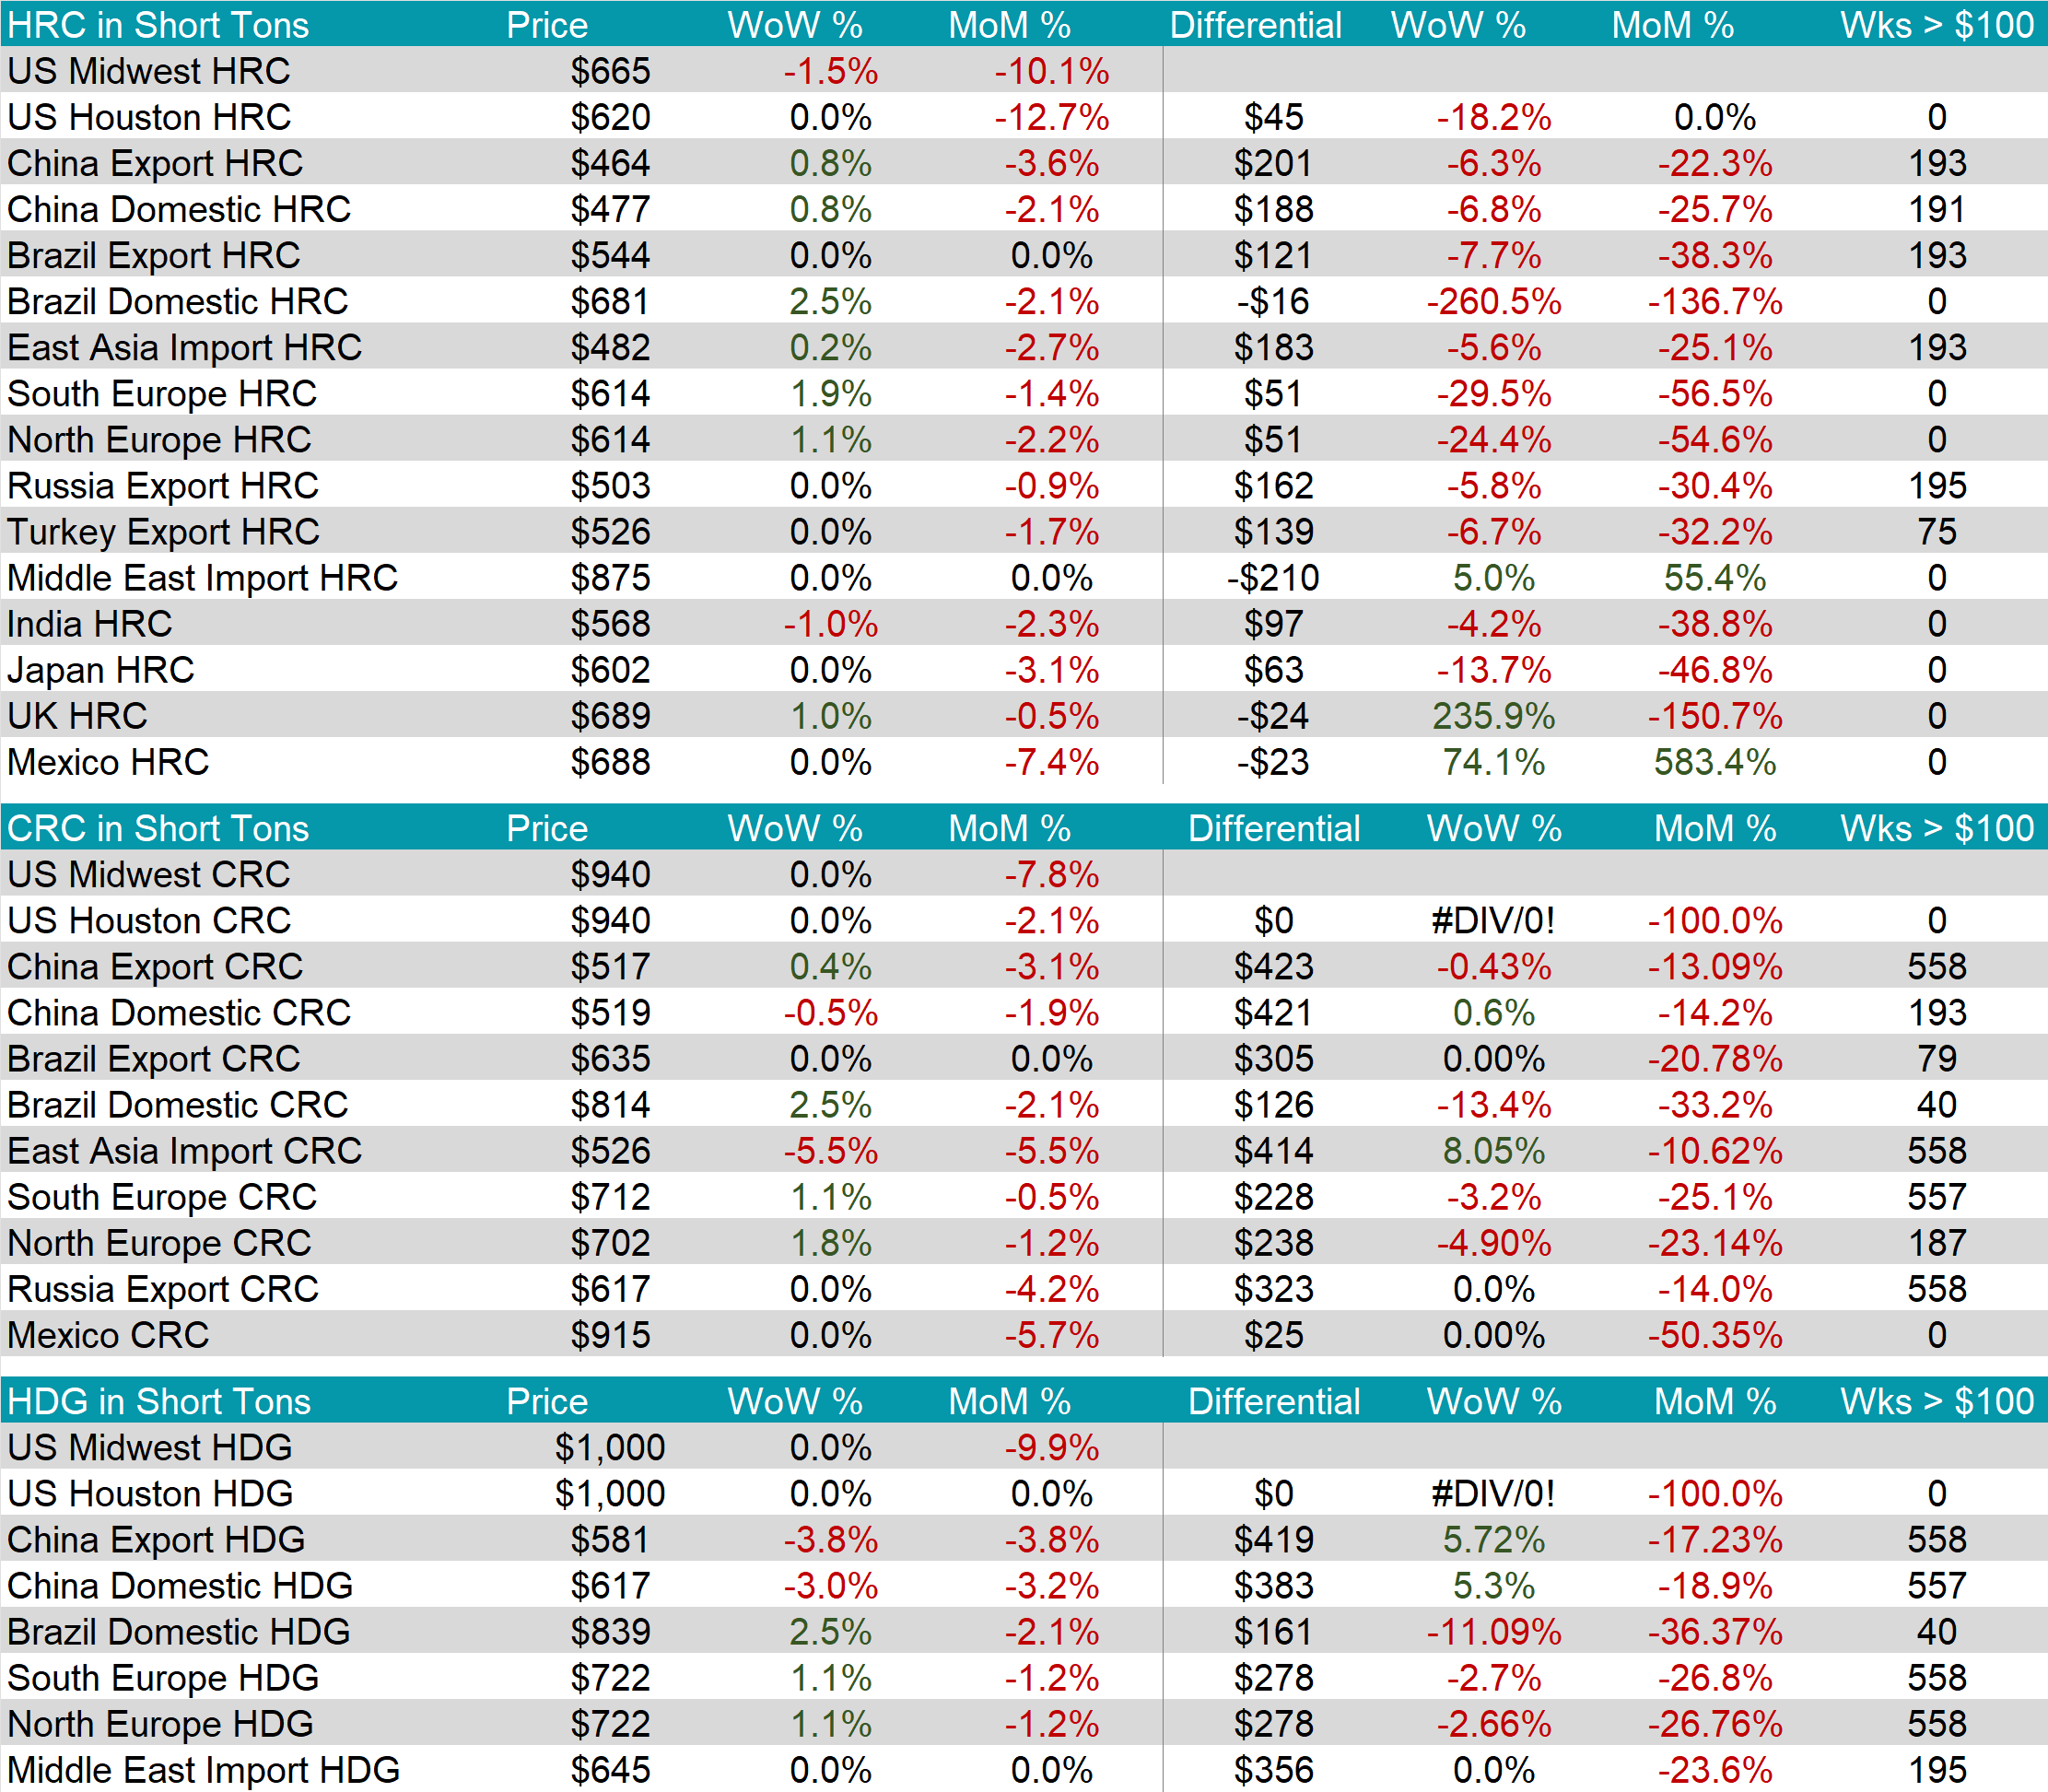
The HRC spot price fell by $10 or -1.5% to $665, resulting in the 5-week price change to be down by $85 or -11.3% and reaching its lowest price since December 2022. Meanwhile, the HRC 2nd month future inched up by $8 or 1.1% to $705.
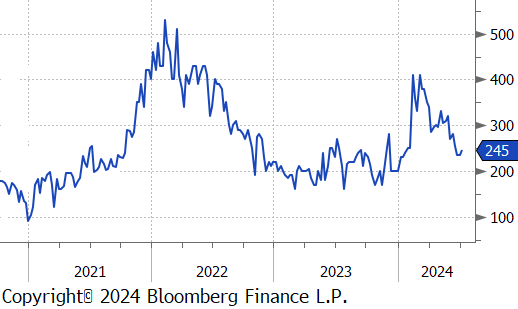
Tandem products both remained unchanged, causing the HDG – HRC differential to rise by $10 or 4.3% to $245.
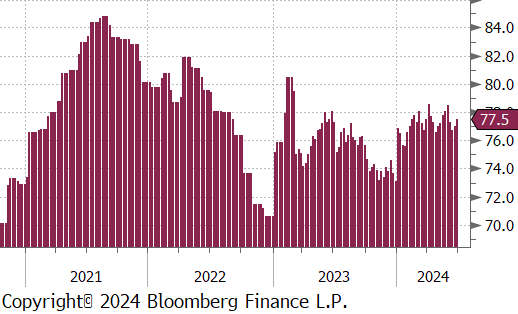
Mill production continued to scale up, with capacity utilization ticking up by 0.5% to 77.5%, bringing raw steel production up to 1.721m net tons, its highest level since May.
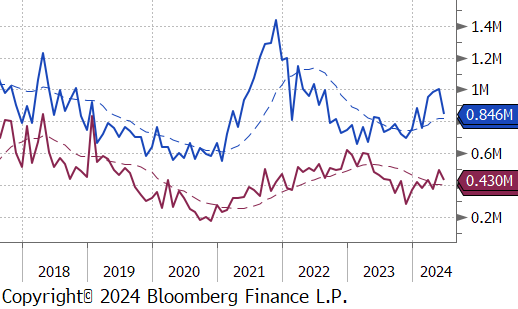
June Projection – Sheet 846k (down 158k MoM); Tube 430k (down 64k MoM)
May Census – Sheet 1004k (up 17k MoM); Tube 494k (up 118k MoM)
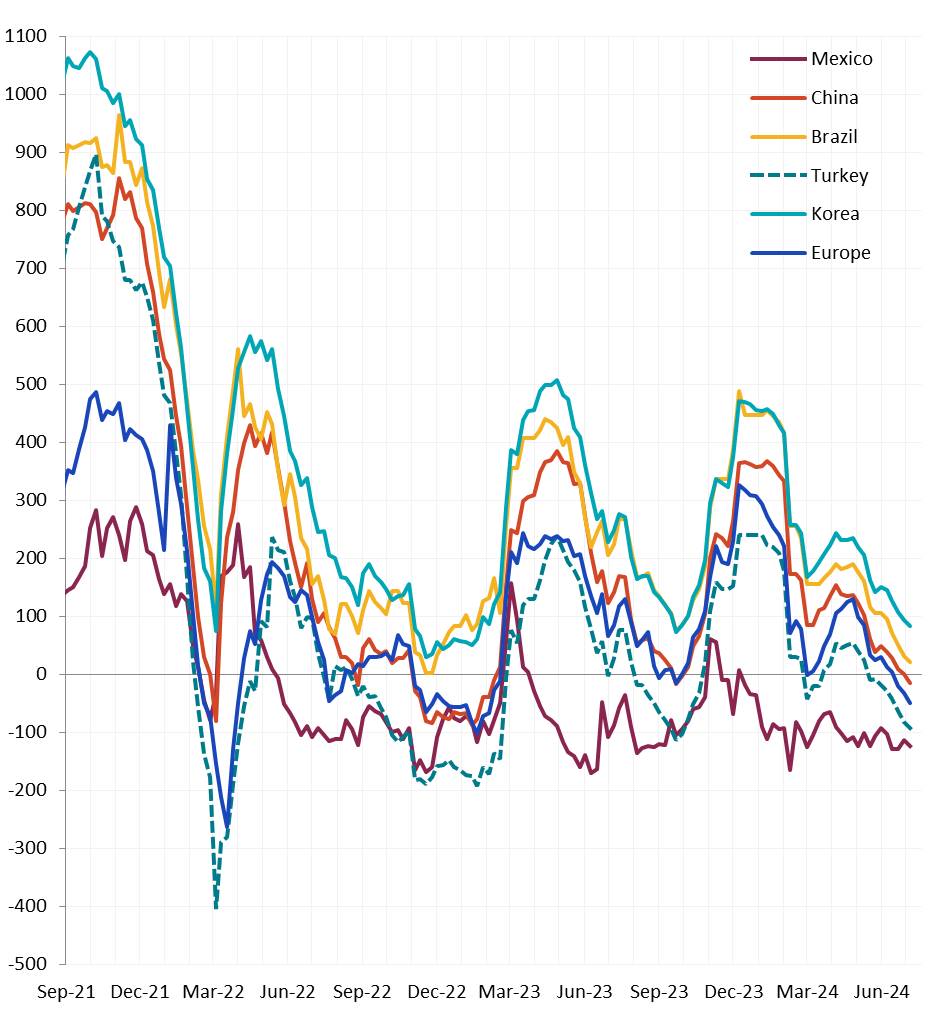
All watched global differentials contracted, except for Mexico’s. Main price movements were from Brazil Domestic HRC rising by 2.5%, North Europe increasing by 1.1%, and China Export & Domestic up by 0.8%.
Scrap
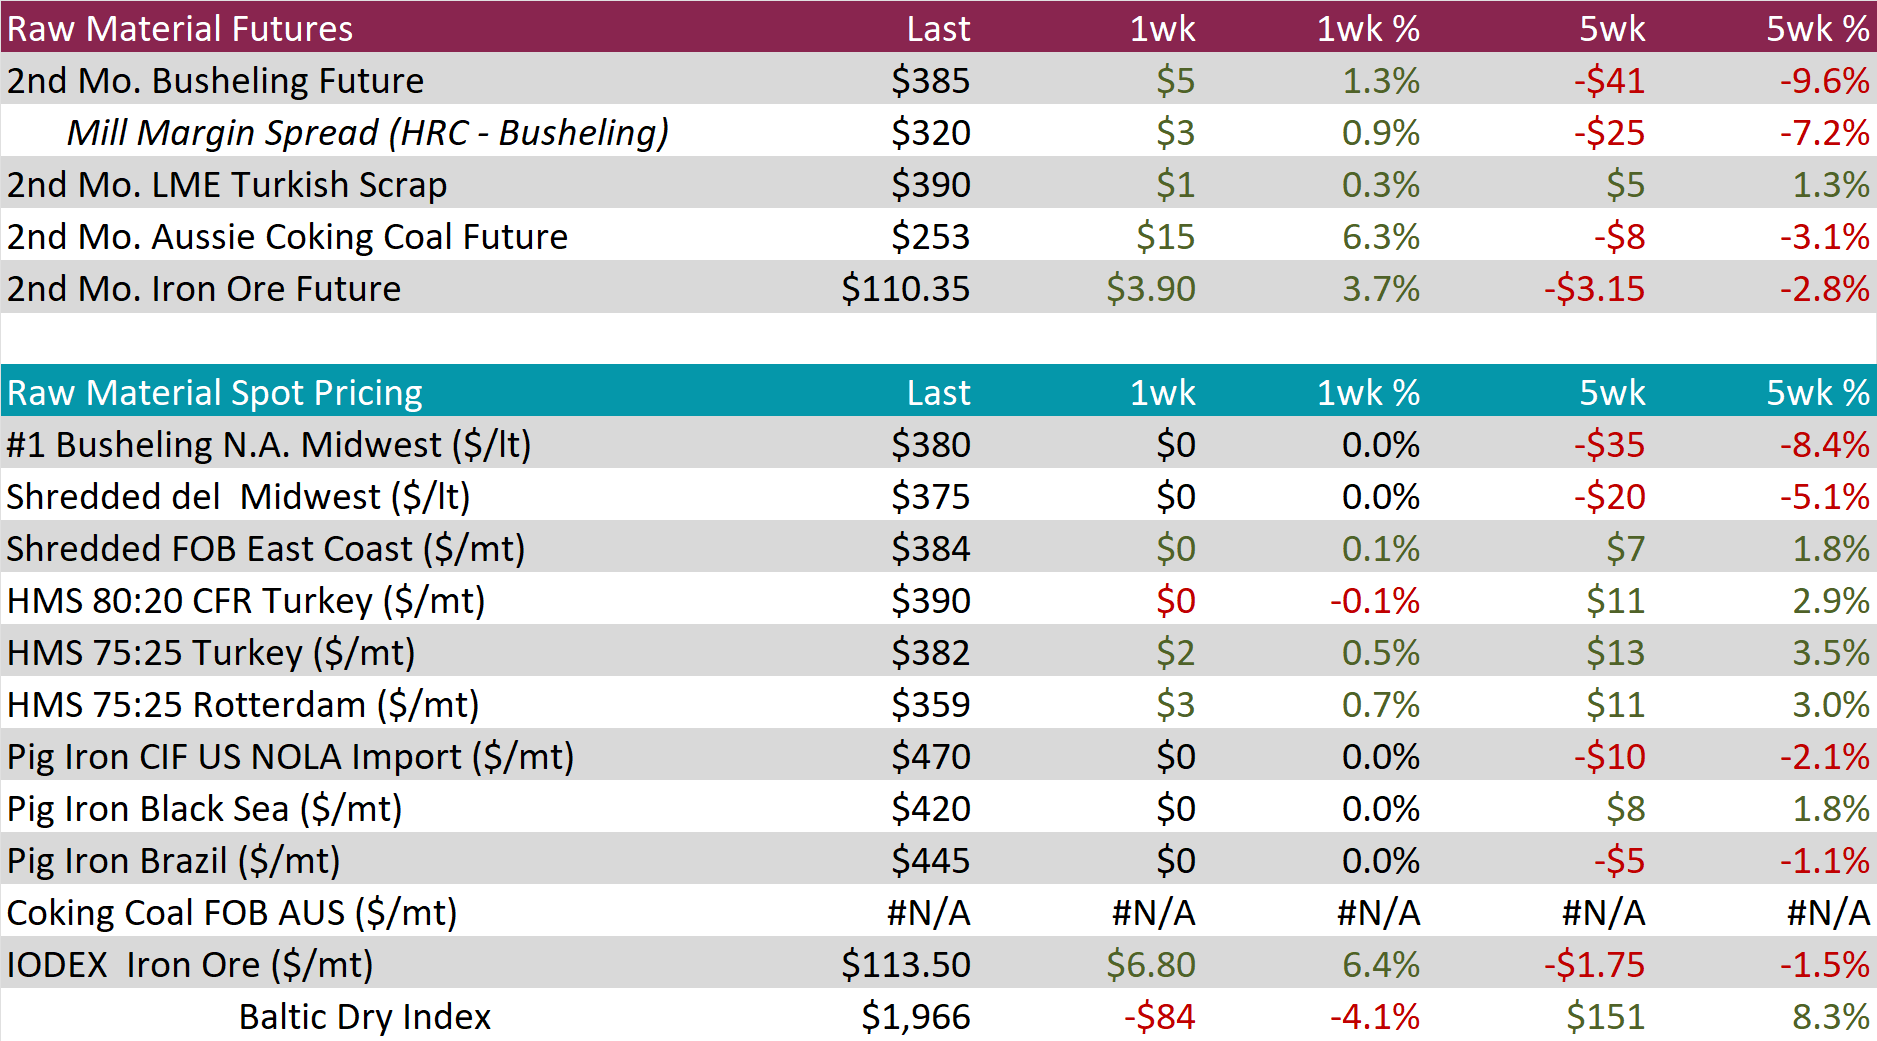
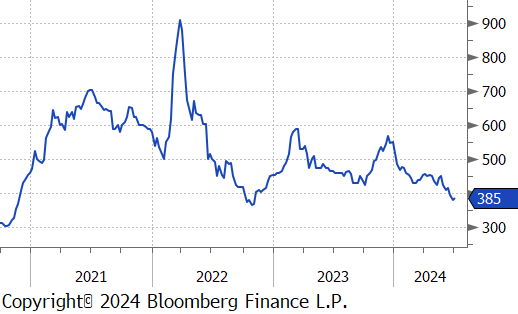
The 2nd month busheling future rose by $5 or 1.3% to $385, marking the first increase after two weeks of price declines.
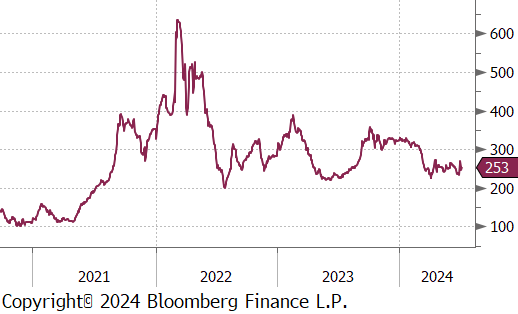
The Aussie coking coal 2nd month future jumped up by $15 or 6.3% to $253, marking the second consecutive week of increases.
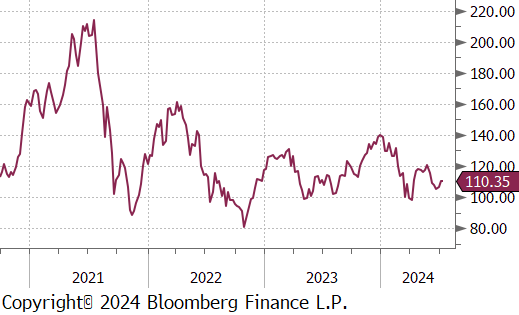
The iron ore 2nd month future climbed by $3.90 or 3.7% to $110.35, reaching the highest price in five weeks and the second straight week of price increases.
Dry Bulk / Freight
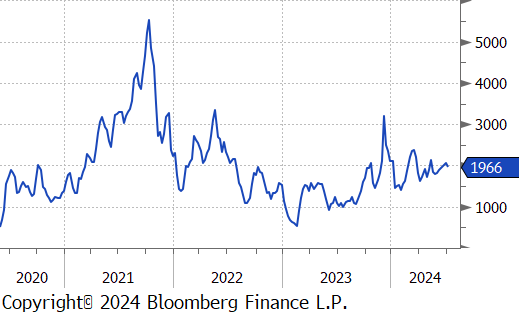
The Baltic Dry Index fell by $84 or -4.1% to $1,966, reversing the five-week upward trend and dropping below the $2,000 price level after briefly rising above it last week.
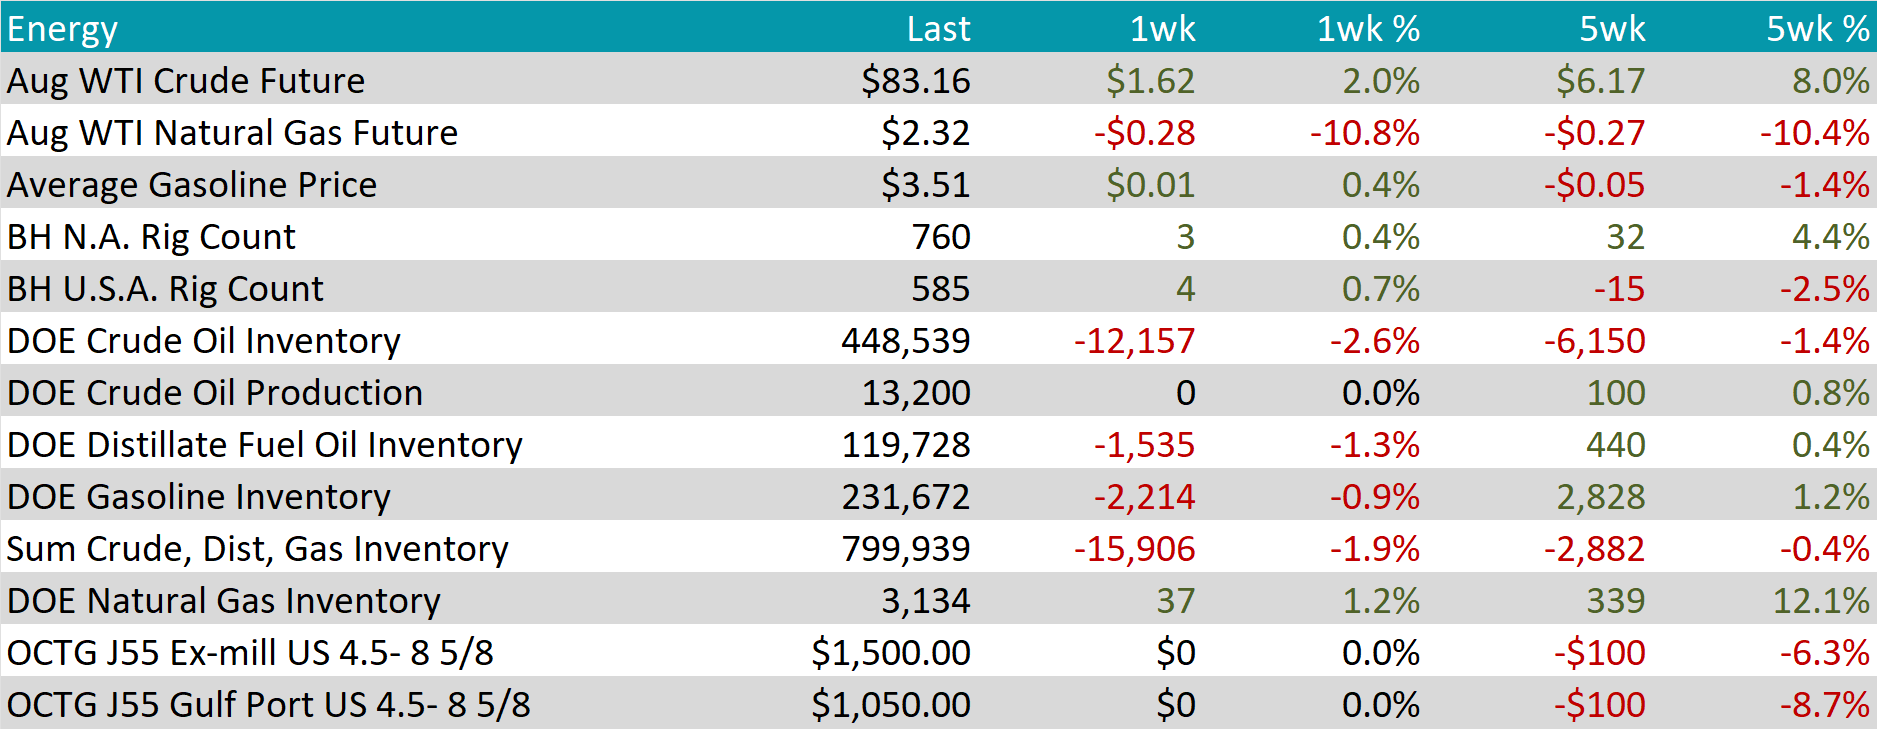
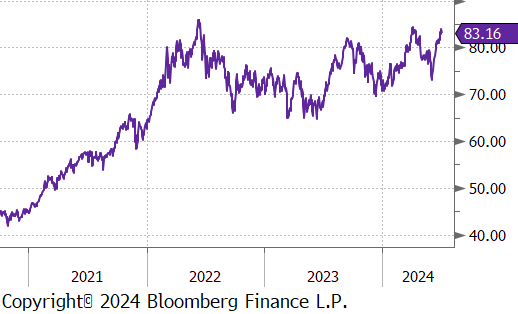
WTI crude oil future gained $1.62 or 2.0% to $83.16/bbl.
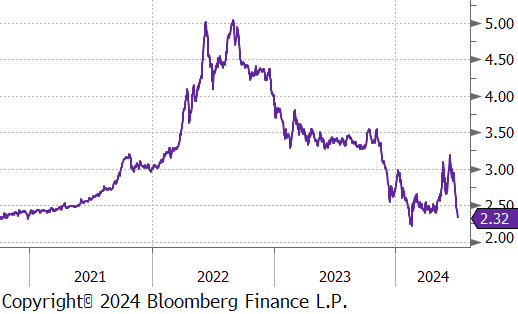
WTI natural gas future lost $0.28 or -10.8% to $2.32/bbl.
The aggregate inventory level experienced a drop, slumping by -0.9%.
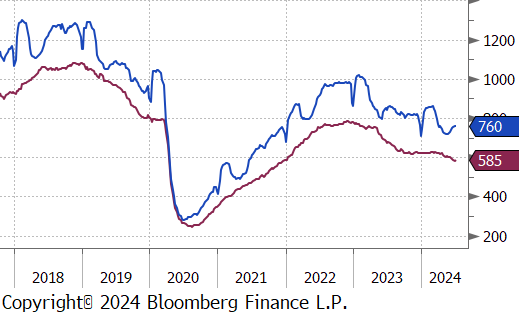
The Baker Hughes North American rig count added 3 rigs, bringing the total count to 760 rigs, marking the highest level since March. At the same time, the US rig count increased for the first time in six-weeks, rising by 4 rigs, bringing the total count to 585 rigs.
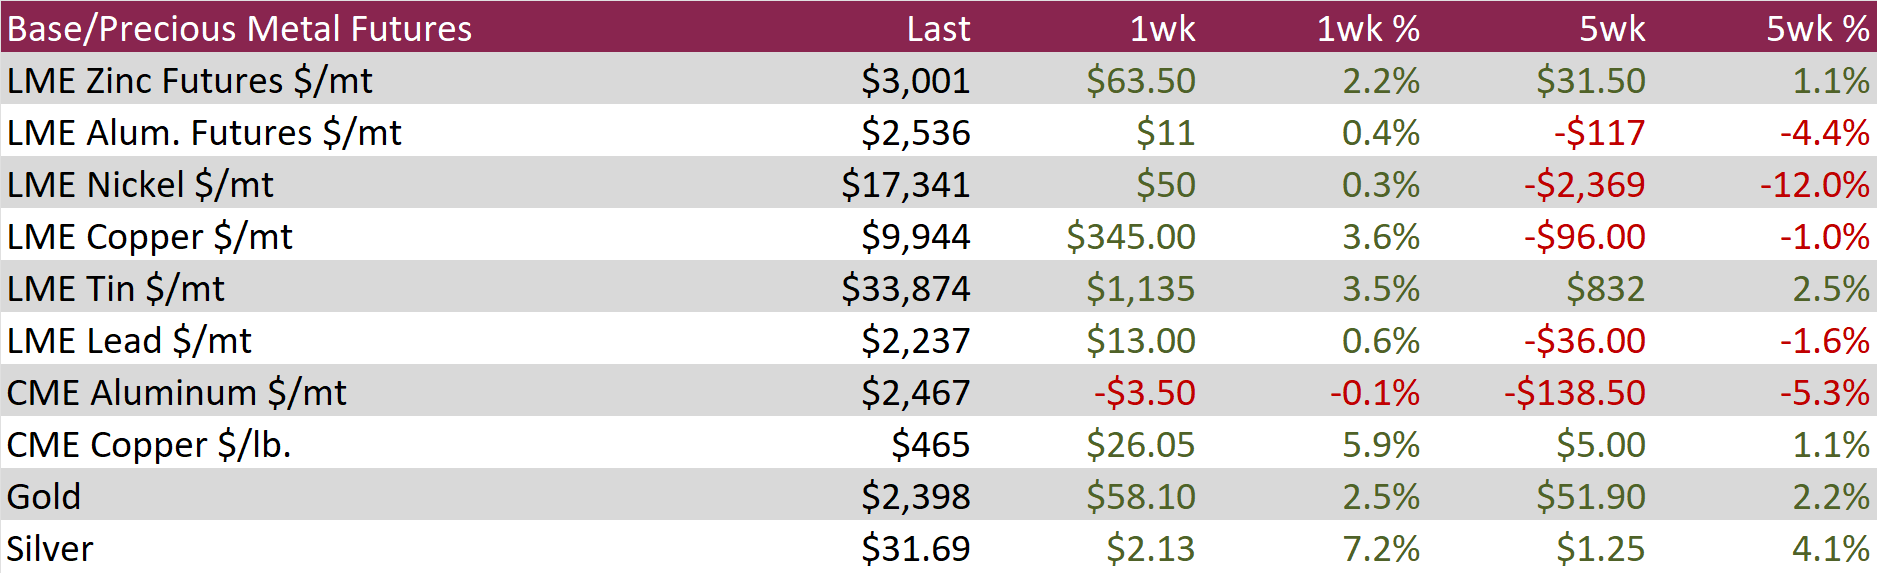
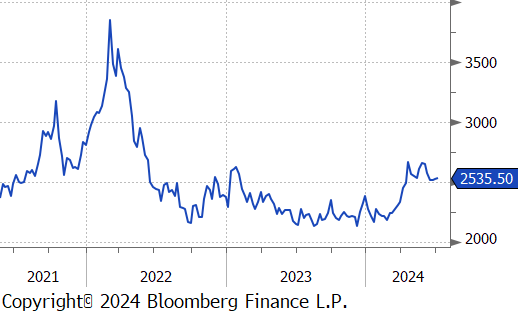
Aluminum futures rose by $11 or 0.4% to $2,536, gaining some momentum after hovering around $2,500 since mid-June. This increase paralleled the rise in other base metals, driven by expectations of government support following weak economic data from key manufacturing economies. Anticipation of Fed rate cuts weakened the dollar, boosting foreign demand for dollar-priced commodities and improving financing conditions for factories in Asian emerging markets. In China, signs of weak domestic demand fueled hopes for stimulus ahead of Beijing’s Third Plenum. Despite these factors, aluminum’s rebound was less pronounced due to robust supply. Increased rainfall in Yunnan, a key Chinese production hub, improved hydropower availability, allowing smelters to restart idled capacity. This alleviated earlier concerns about dry weather disrupting production, leading to a 7.2% annual increase in China’s aluminum output, reaching a record 3.65 million tons in May.
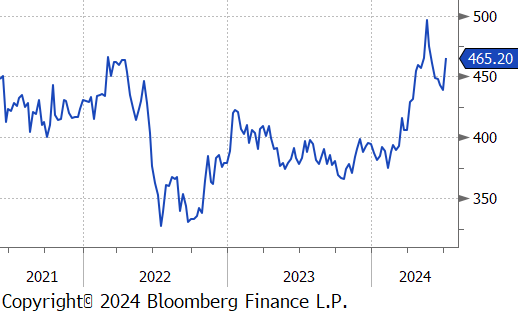
Copper jumped by $26.05 or 5.9% to $465. This follows Shanghai Metals Market data revealing an unexpected drop in copper cable and wire producers’ operations last week, indicating weak demand in China. Despite this, copper prices surged nearly 7% last week, marking their best weekly performance since mid-May. Additionally, markets are watching for potential new stimulus measures in China as top officials convene for the Third Plenum later this month. Seasonal demand and robust consumption from the renewable energy sector are also expected to support copper prices further.
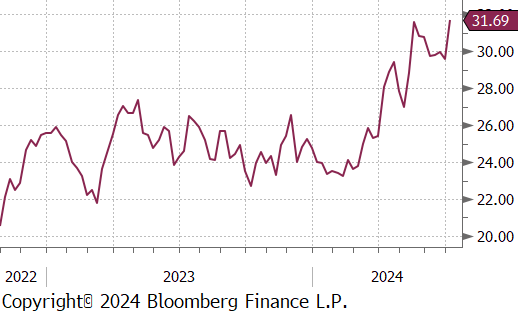
Silver climbed by $2.13 or 7.2% to $31.69, reaching a one-month high, gaining over 7% as soft US economic data increased the likelihood of the Federal Reserve cutting interest rates in September. Investors are now focusing on key US inflation data and forthcoming remarks from Fed officials for further monetary policy insights. Silver prices have also been buoyed by expectations of new stimulus measures from China, anticipated to be announced at the Third Plenum this month, as the country aims for 5% economic growth this year. Additionally, strong demand from the solar panel sector continues to support the market. The connection of the world’s largest solar farm in Xinjiang underscores the robust momentum in solar power investment, further bolstering silver demand.
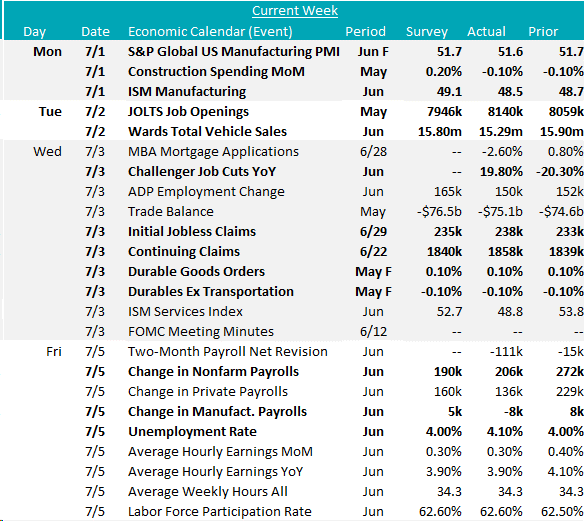
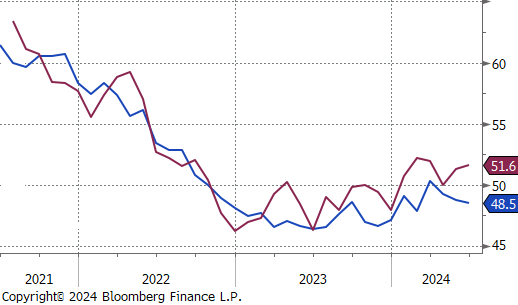
June’s manufacturing data showed ongoing challenges. The ISM Manufacturing PMI dropped to 48.5 from May’s 48.7, below the 49.1 forecast, marking the third consecutive decline. The S&P Global US Manufacturing PMI slightly revised to 51.6 from 51.7, up from May’s 51.3, the highest in three months.
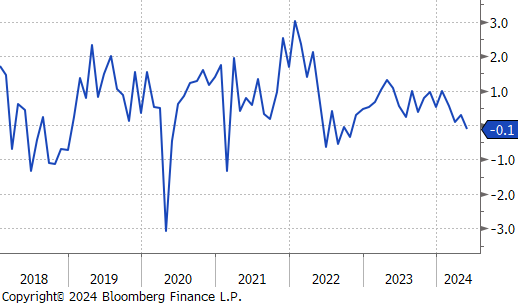
Construction spending fell by 0.1% in May, missing the forecasted 0.1% rise, driven by a 0.3% drop in private spending. Public spending rose by 0.5%, boosted by residential and non-residential increases.
June’s Wards Total Vehicle Sales fell to 15.29 million from 15.90 million, below the expected 15.80 million, marking the first notable downturn after three months of growth.
In May, Durable Goods Orders rose by 0.1%, matching estimates, following a revised 0.2% rise in April. Durables Ex Transportation fell by 0.1%, below the anticipated 0.2% increase, highlighting transportation as a key growth driver.
Labor market data presented a mixed picture but did show signs of easing. The Unemployment Rate rose to 4.1% in June, the highest since November 2021 and surpassing expectations to stay unchanged at 4.0%. May’s JOLT Job Openings grew to 8140k, beating the anticipated 7946k, while Challenger Job Cuts YoY increased by 19.8%. Change in Nonfarm Payrolls declined to 206k in June, down from 272k but above the forecasted 190k, and Change in Manufacturing Payrolls dropped to -8k, falling far below to expected 5k.