Flack Capital Markets | Ferrous Financial Insider
June 16, 2023 – Issue #384
June 16, 2023 – Issue #384
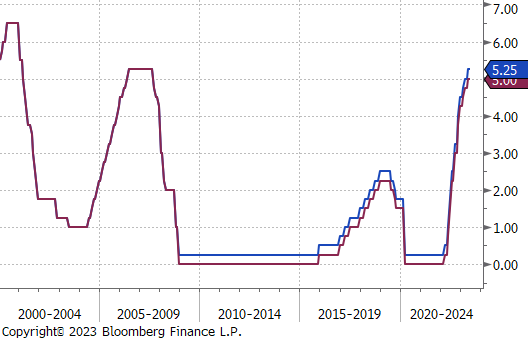
The most important economic data came from the Federal Reserve last week, where the FOMC decided on a “hawkish pause” with interest rates. This meant that we remain at a target range of 5-5.25% with a higher likelihood of the next move as more restrictive. This was the first time in 15 months that interest rates did not increase. The primary reasoning behind the pause was to allow time for the impact of the prior hikes to take hold. At the same time, the hawkish part of the pause came from the updated SEP (Summary of Economic Projections) where expectations for inflation and growth were noticeably higher, while the projected unemployment rate was reduced. Simply put, economic data is showing the FED that inflation and economic activity, while slowing, remain much stronger than they anticipated, given the significant increase in rates. Because of this, they are currently projecting two more 25 bps increases by year end.
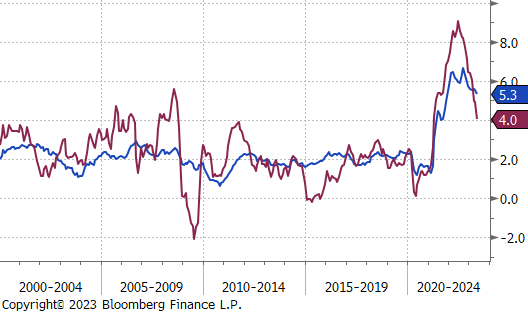
The further divergence between headline and core CPI (Consumer Price Index) data in May highlights exactly what the concern is around inflation. May headline CPI showed promising signs of a meaningful deceleration in price pressure. YoY CPI was down to 4% versus 4.9% in April, however, core CPI (ex. food & energy) remains sticky and elevated at 5.3% versus 5.5% in April. The federal reserve is more focused on the signal from core data in making policy decisions, so we do not anticipate rate cuts until this is much closer to the target range of 2.5%.
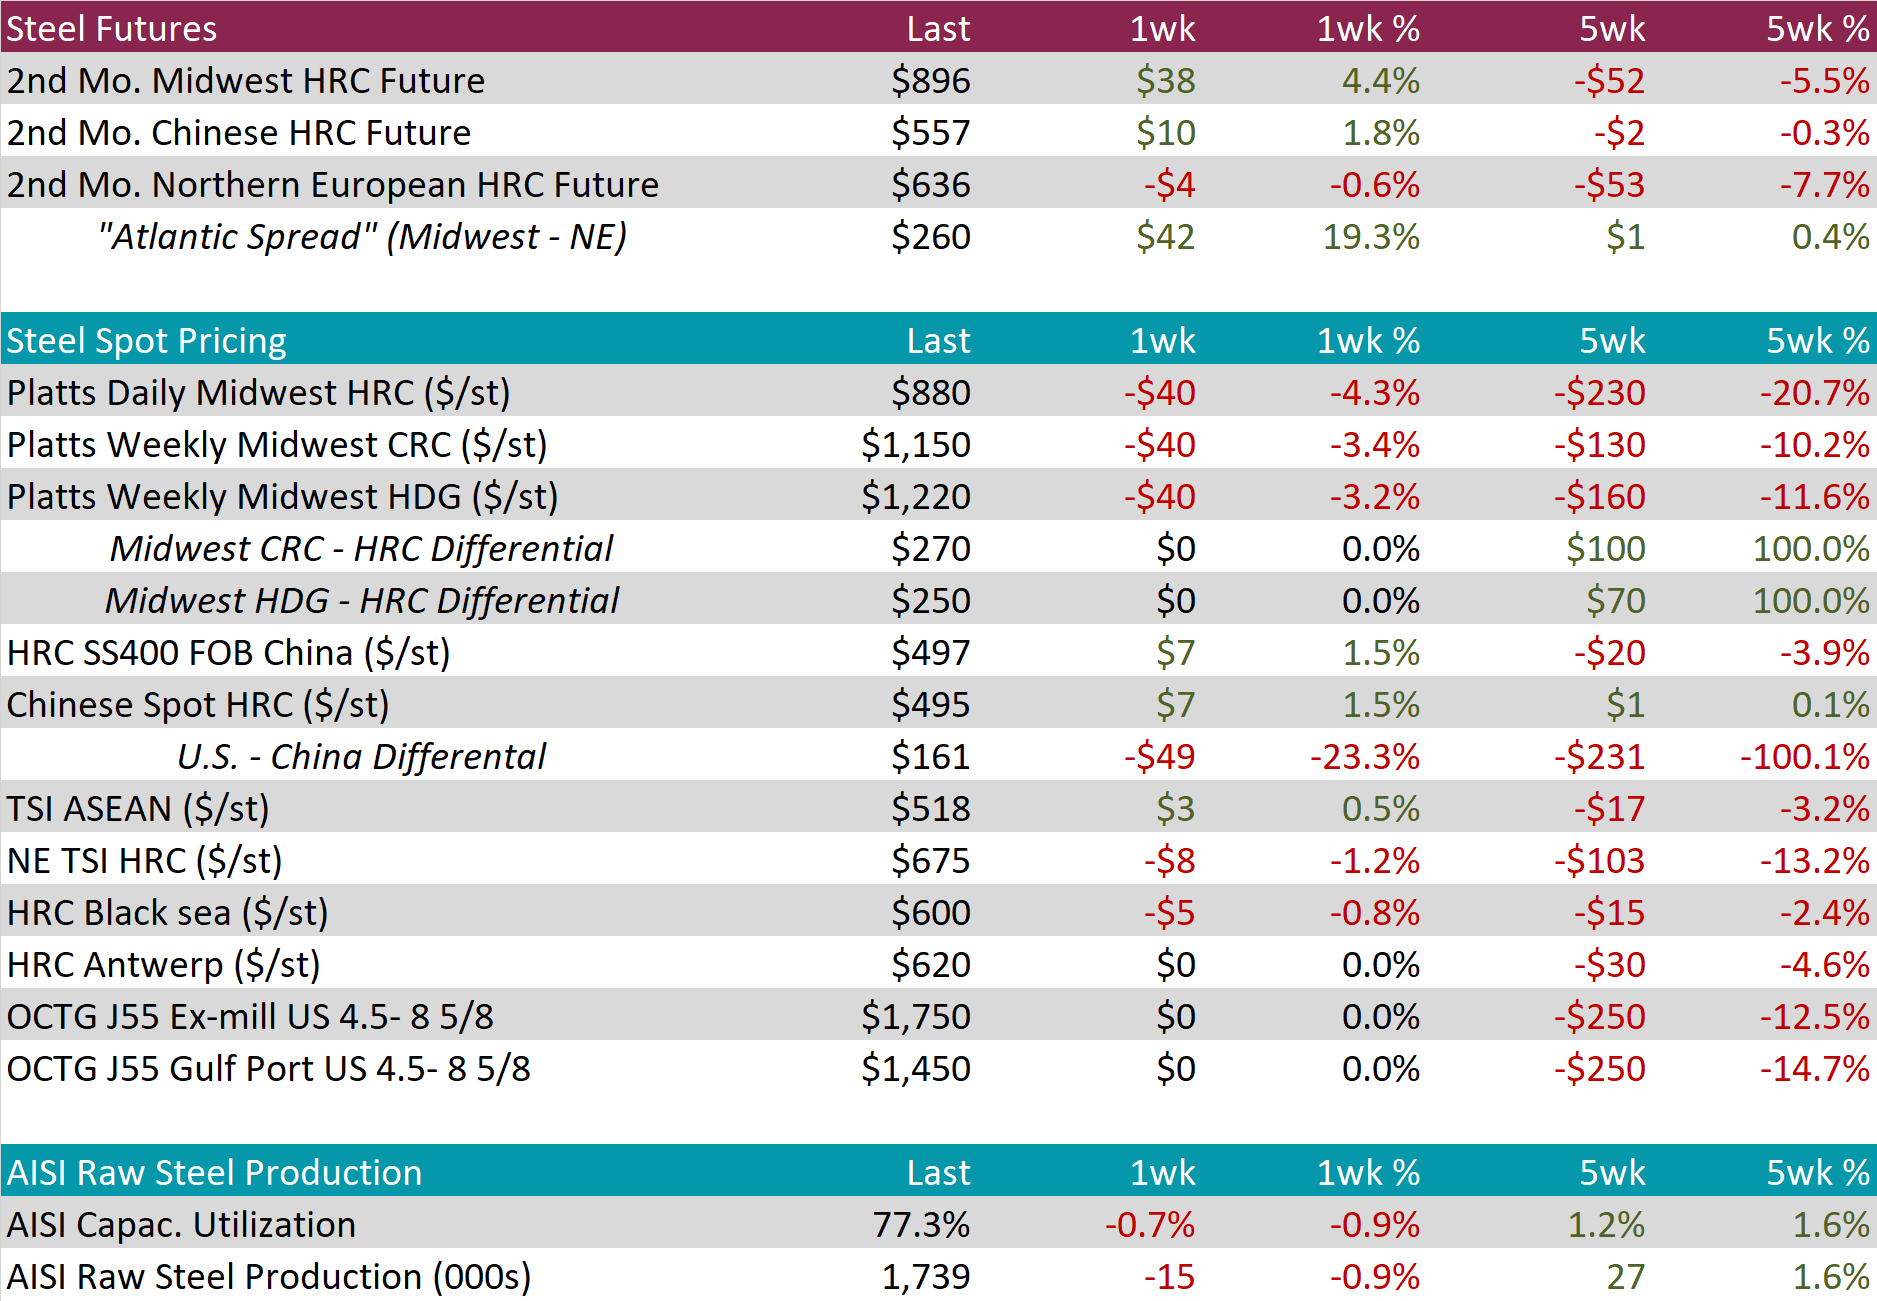
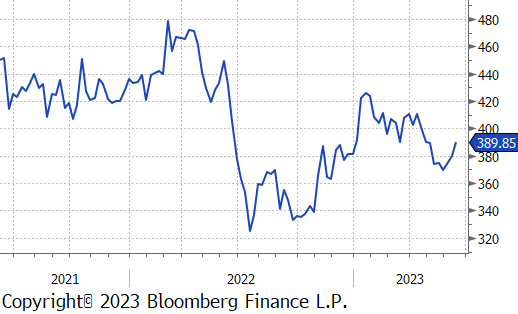
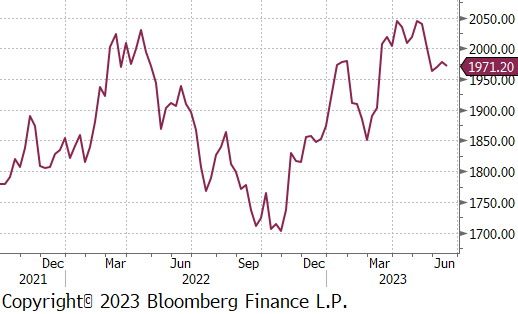
This week represents a further divergence between spot prices and the forward curve. HRC spot was down another $40 or 4.3%, while the 2nd month future price rose $38 or 4.4%. The divergence is especially notable now, because this would represent a technical contango market. Our view is that this is more of a timing issue, rather than a signal that there is a surplus of material withing the market.
Spot tandem products fell by the same dollar amount as HRC, so the spread between HDG and HRC was unchanged.
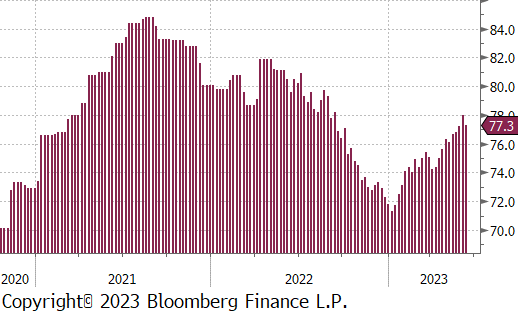
Mill production was slightly lower, last week, down 0.7% to 77.3%. This level is the highest since early September, excluding last week.
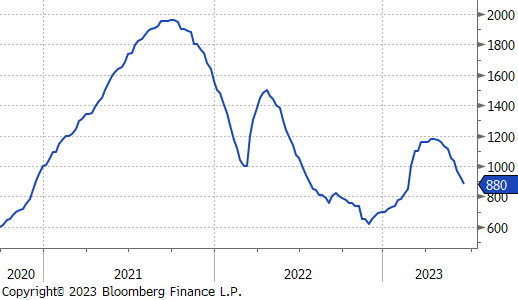
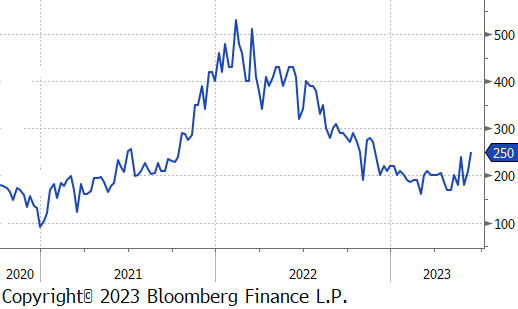
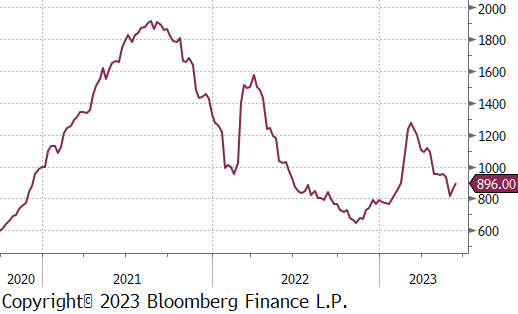
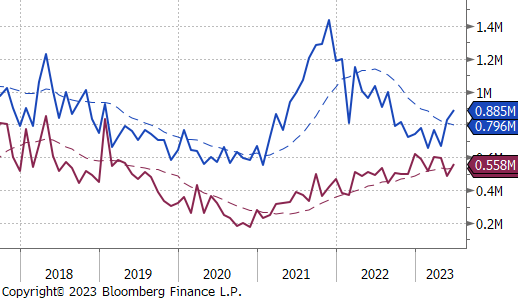
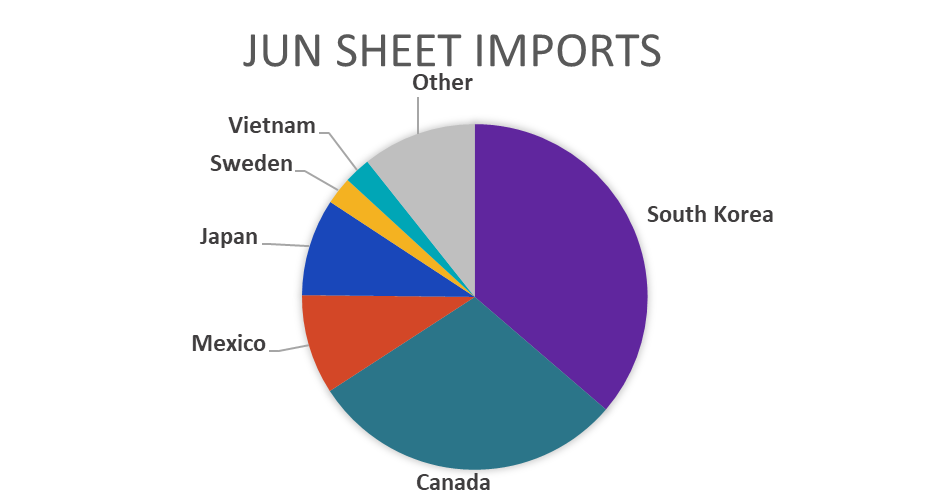
June Projection – Sheet 885k (up 59k MoM); Tube 558k (up 74k MoM)
May Projection – Sheet 826k (up 158k MoM); Tube 484k (down 113k MoM)
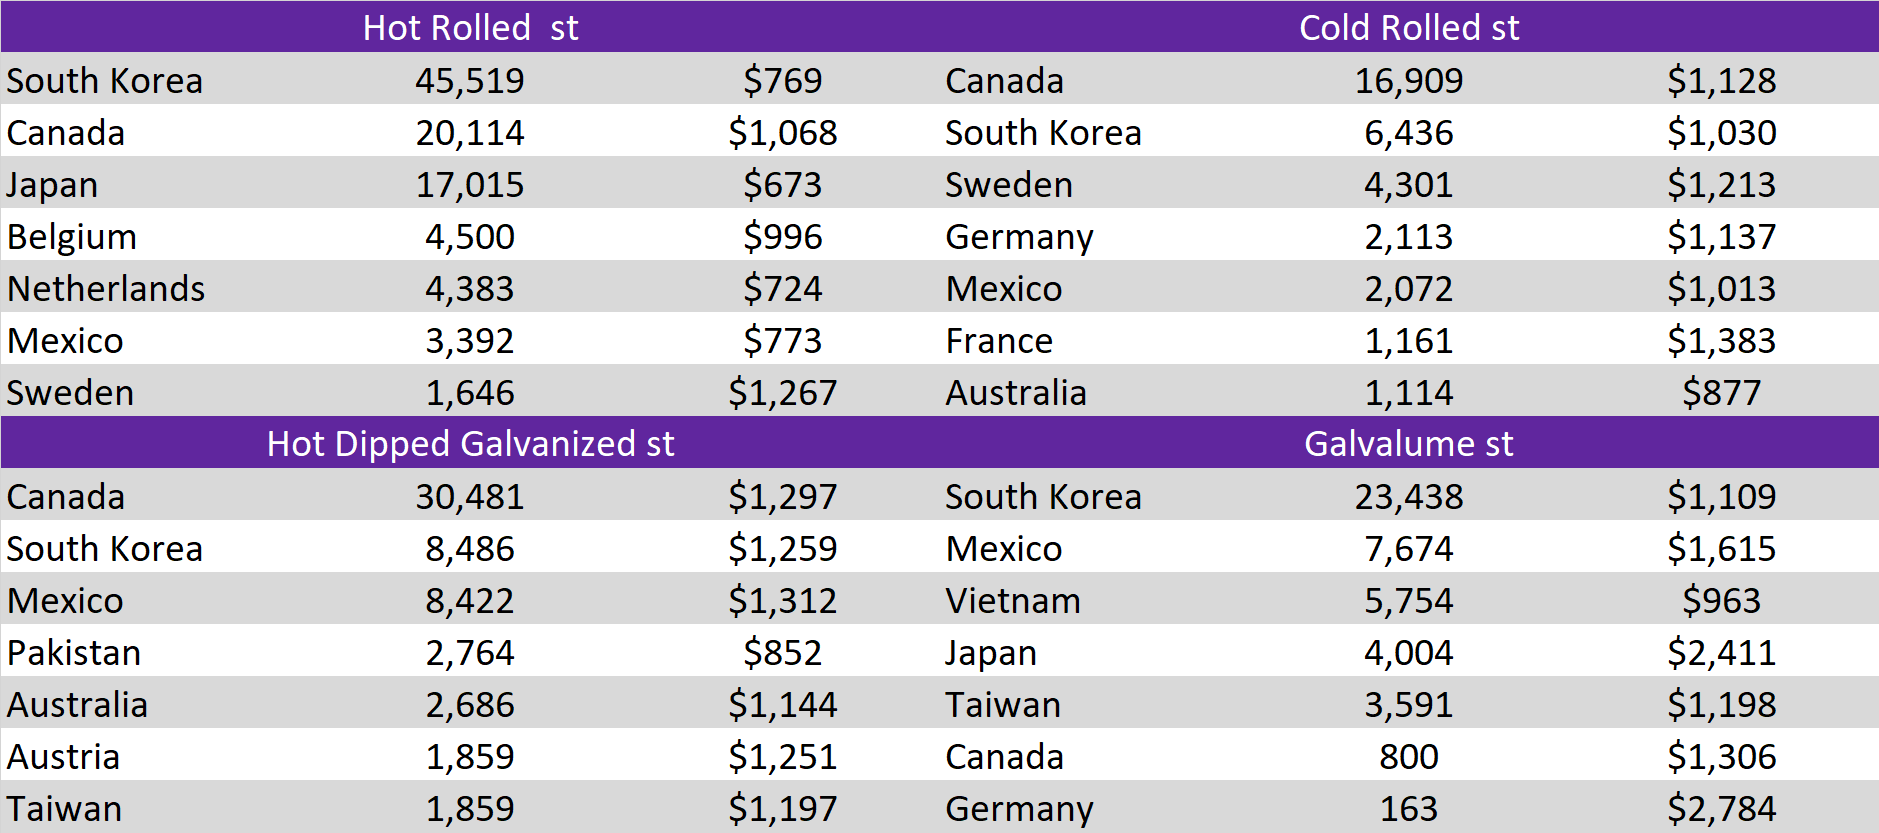
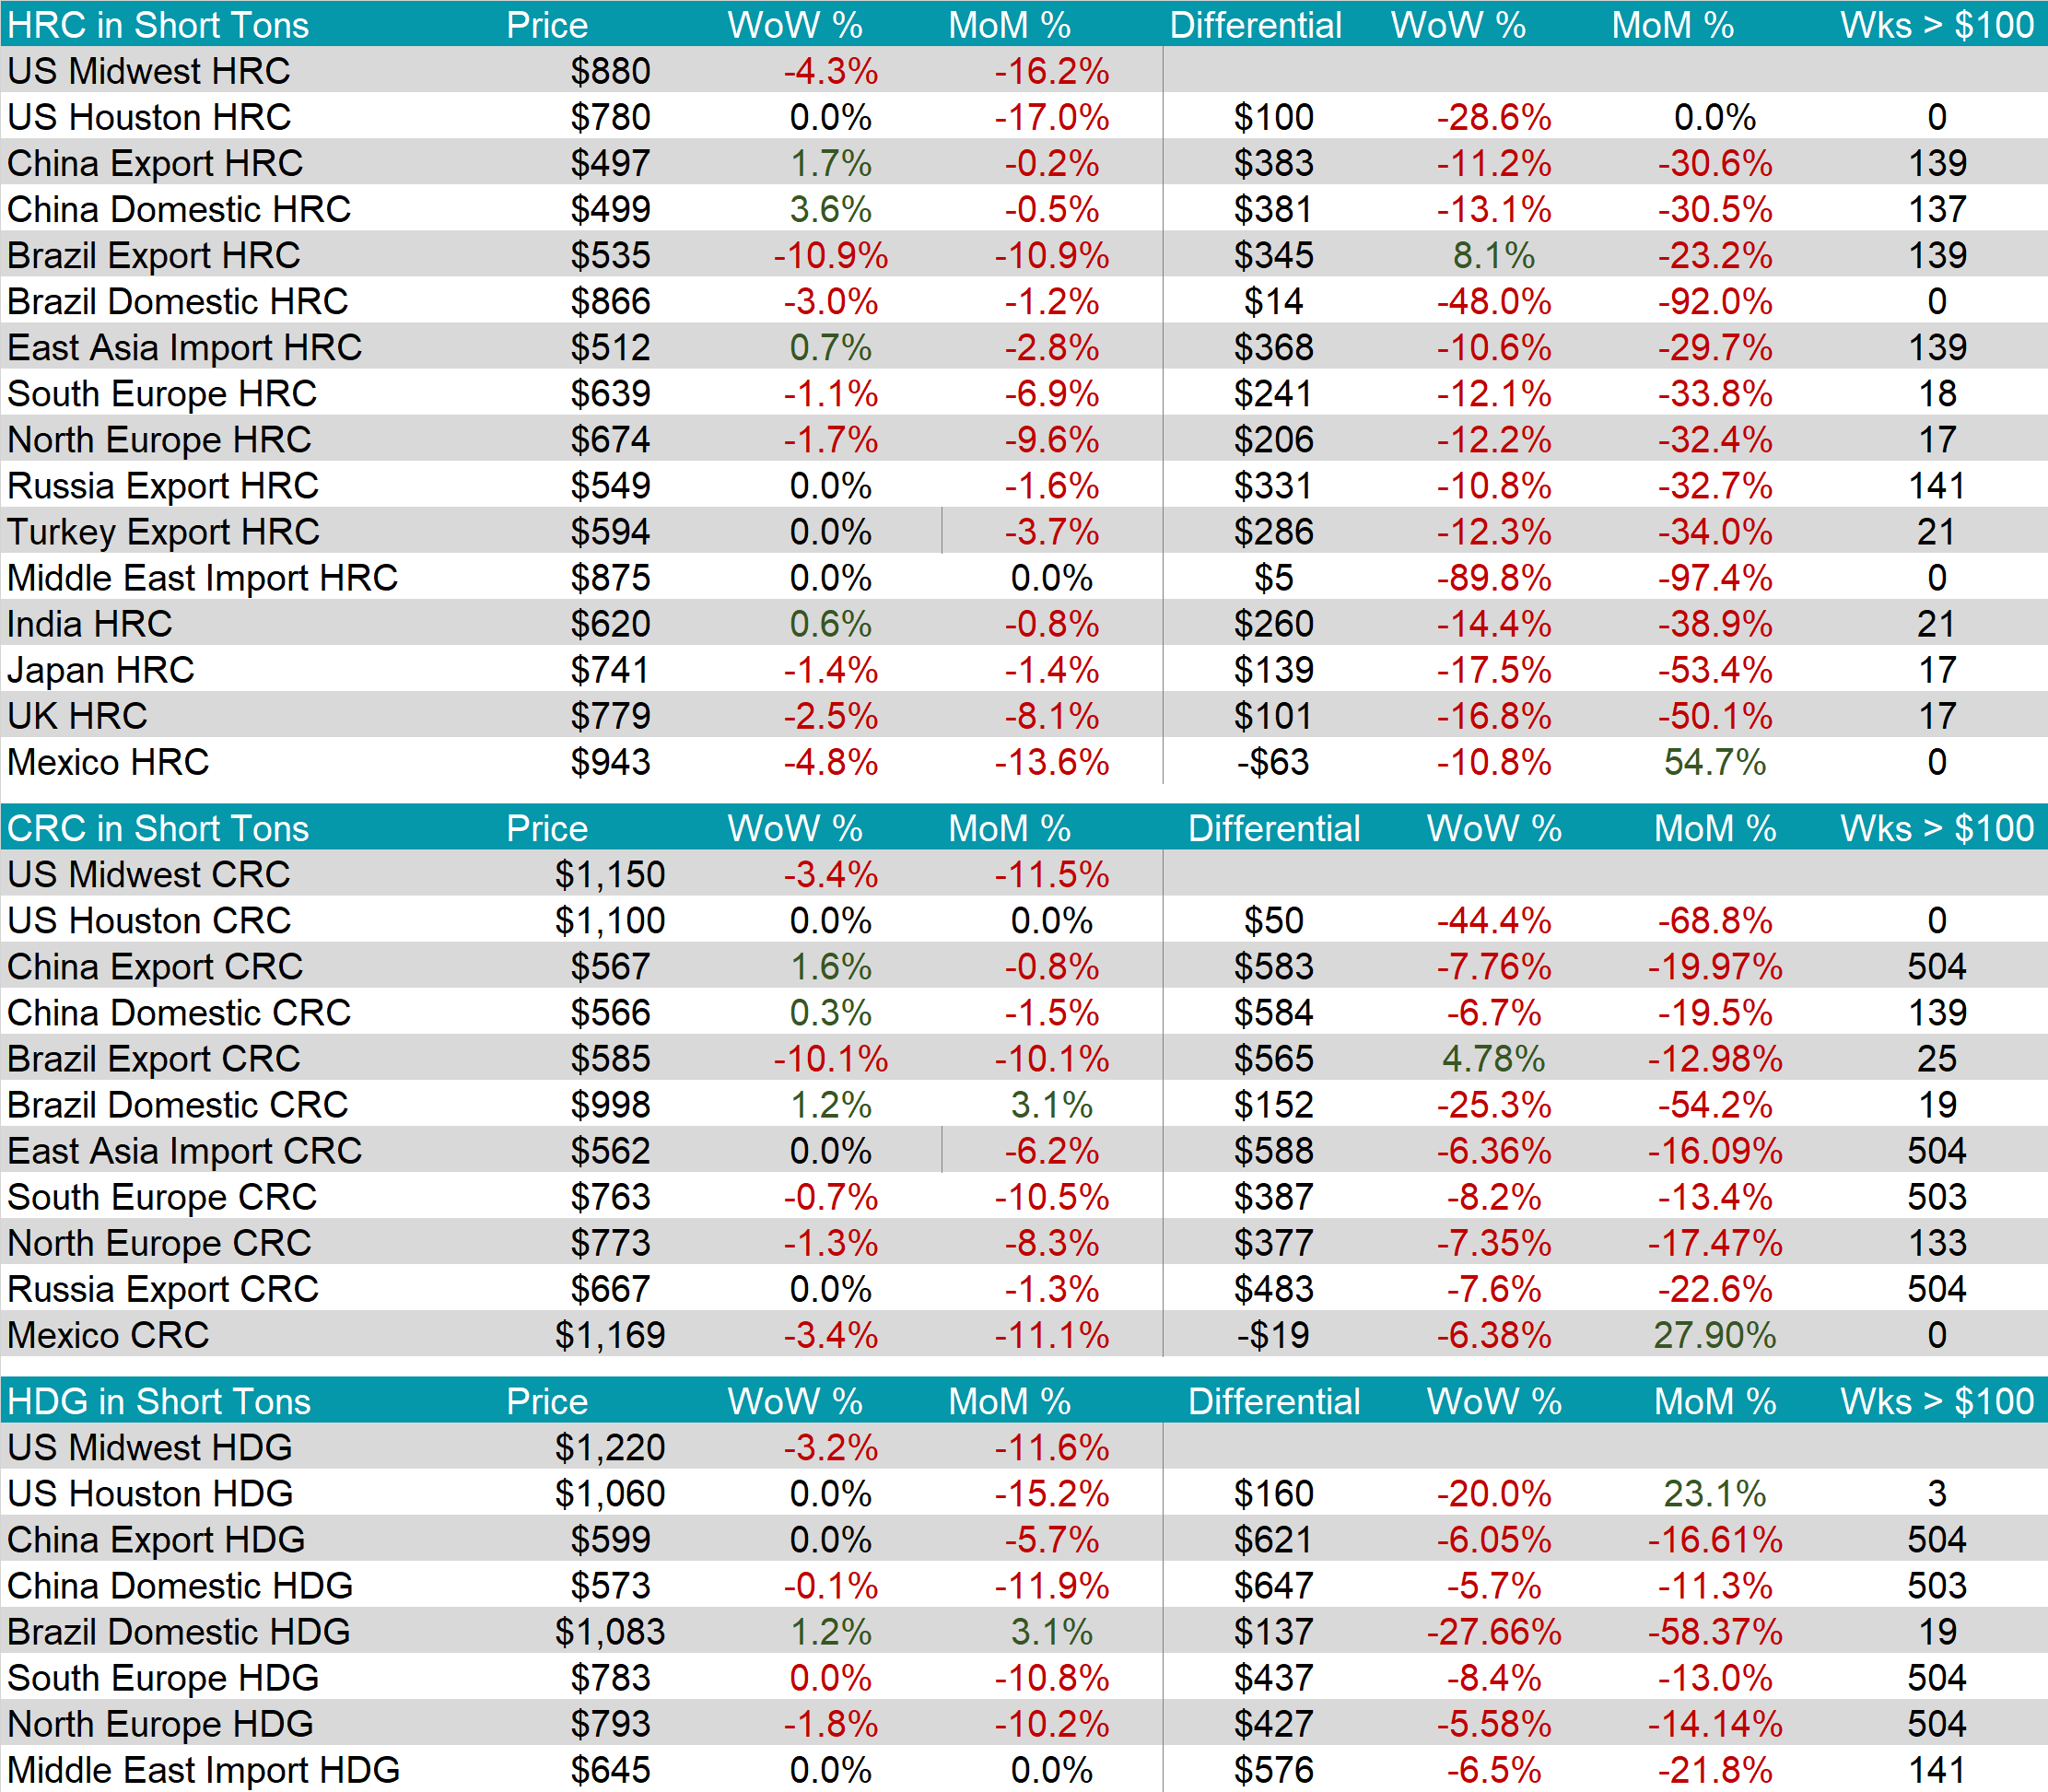
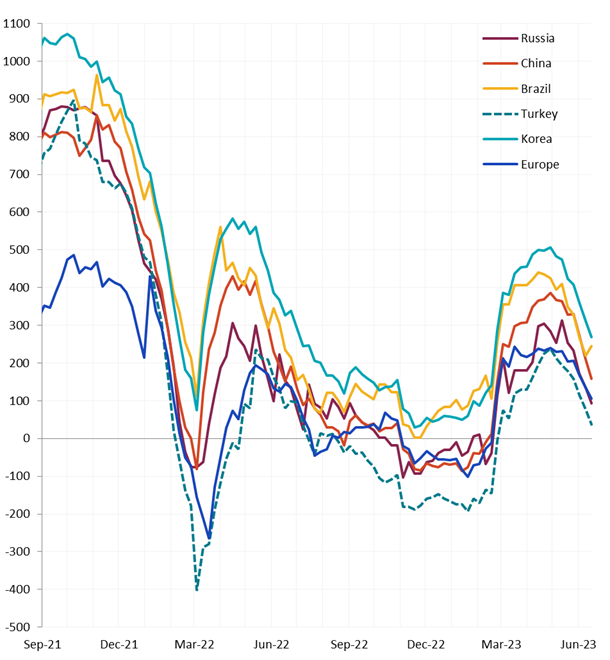
Global differentials were lower again this week, except for Brazil’s. One of the most notable signals below the surface is that this week is the second week in a row with a higher Chinese export price. As the world’s largest steel producer, the trends in their market will always have a downstream impact on the rest of the world.
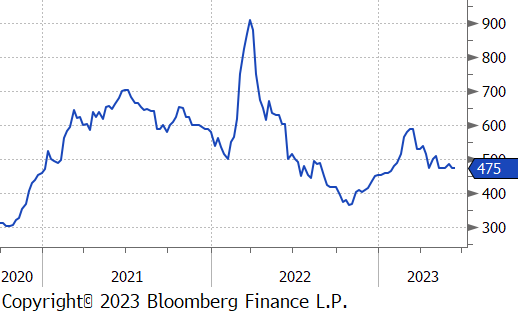
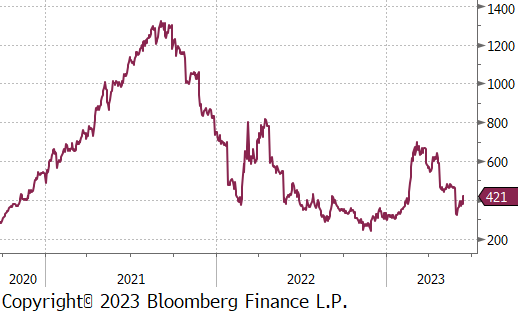
After last week’s settle below expectations, both spot and the 2nd month future for busheling were unchanged. The continued rally in the HRC market led to an increase in mill margin.
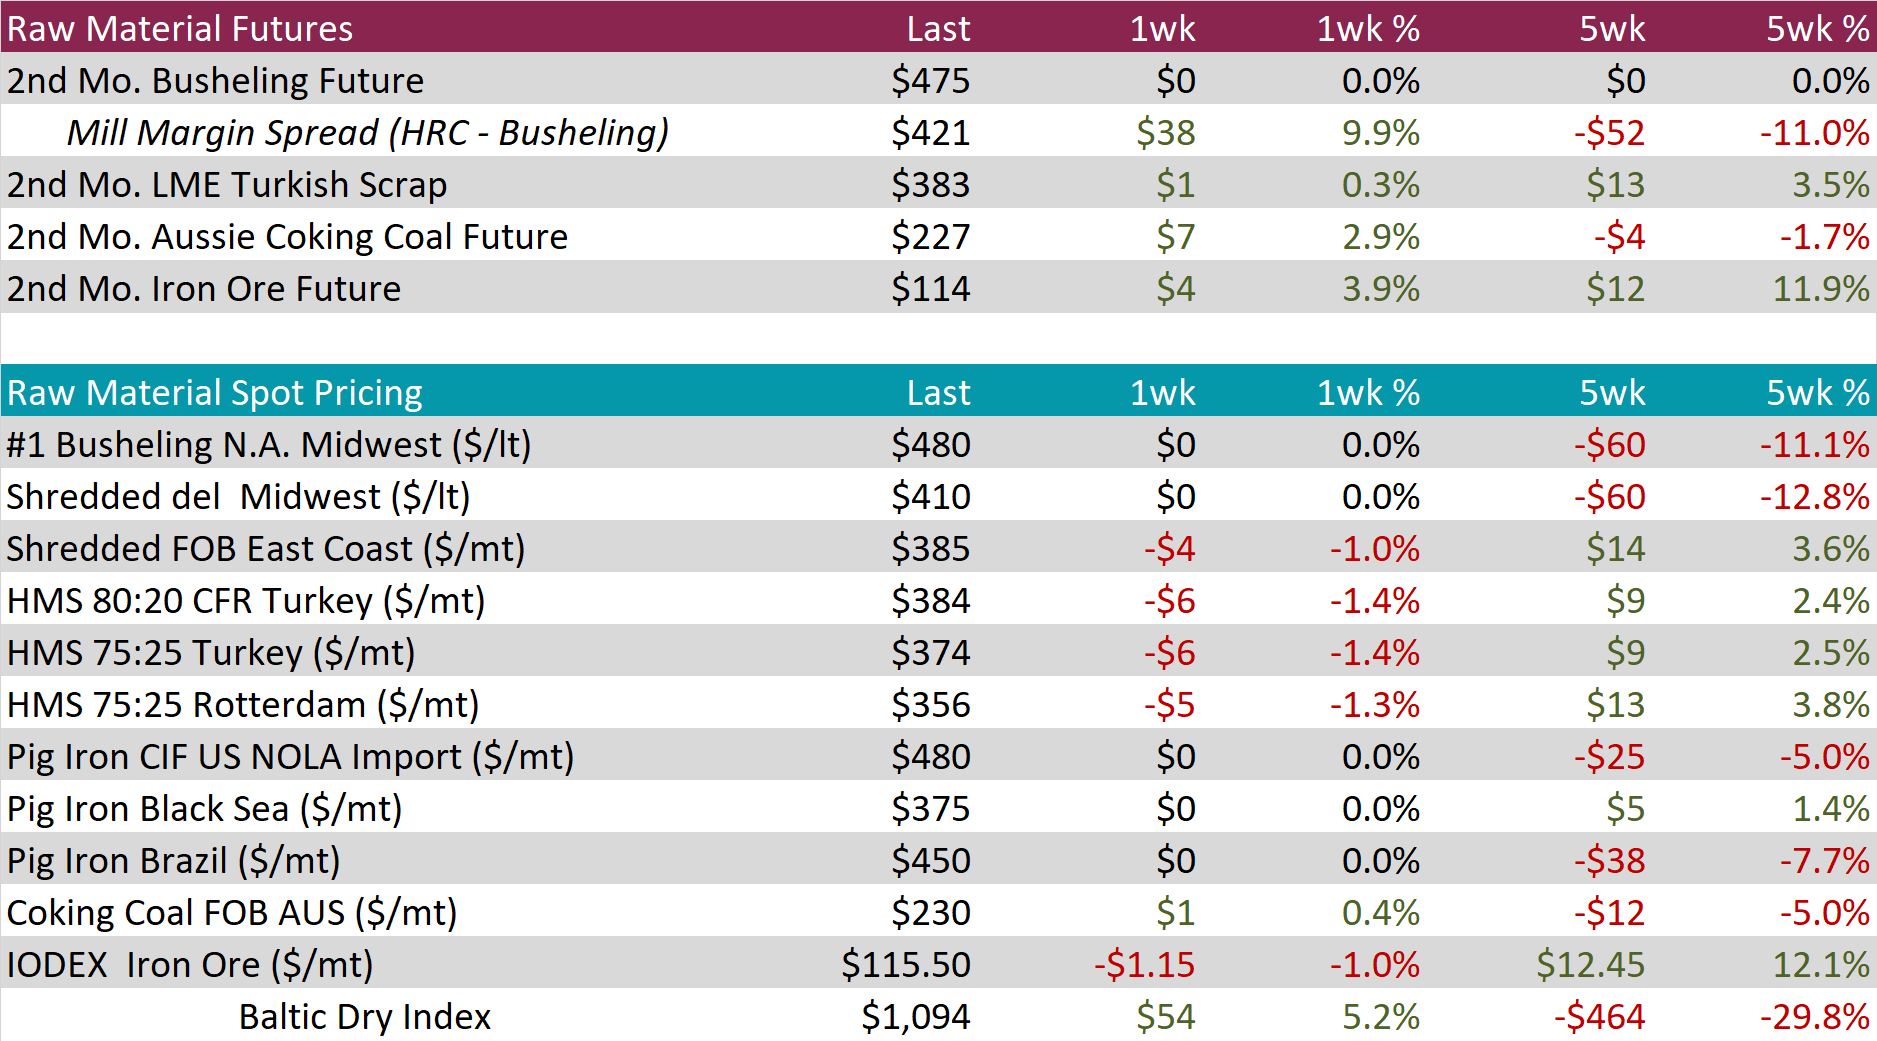
Iron ore 2nd month futures continued their rally, up another $4, or 3.9% this week. However, after a few strong weeks, concerns are again beginning to bubble to the surface around the sustainability of China’s bullish turn.
Dry Bulk / Freight
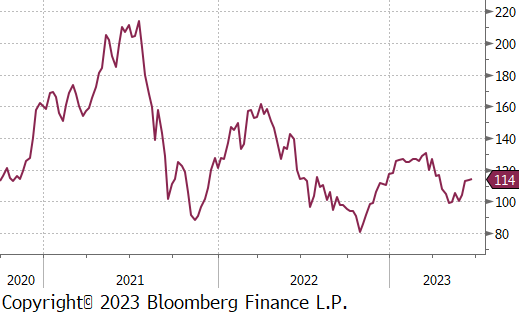
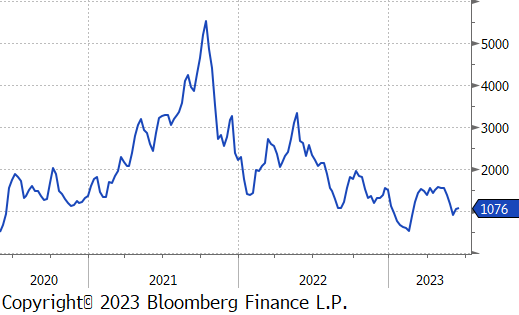
The Baltic dry index was up another $54 or 5.2%. This has anecdotally been largely tied to the uptick in demand for iron ore from China.
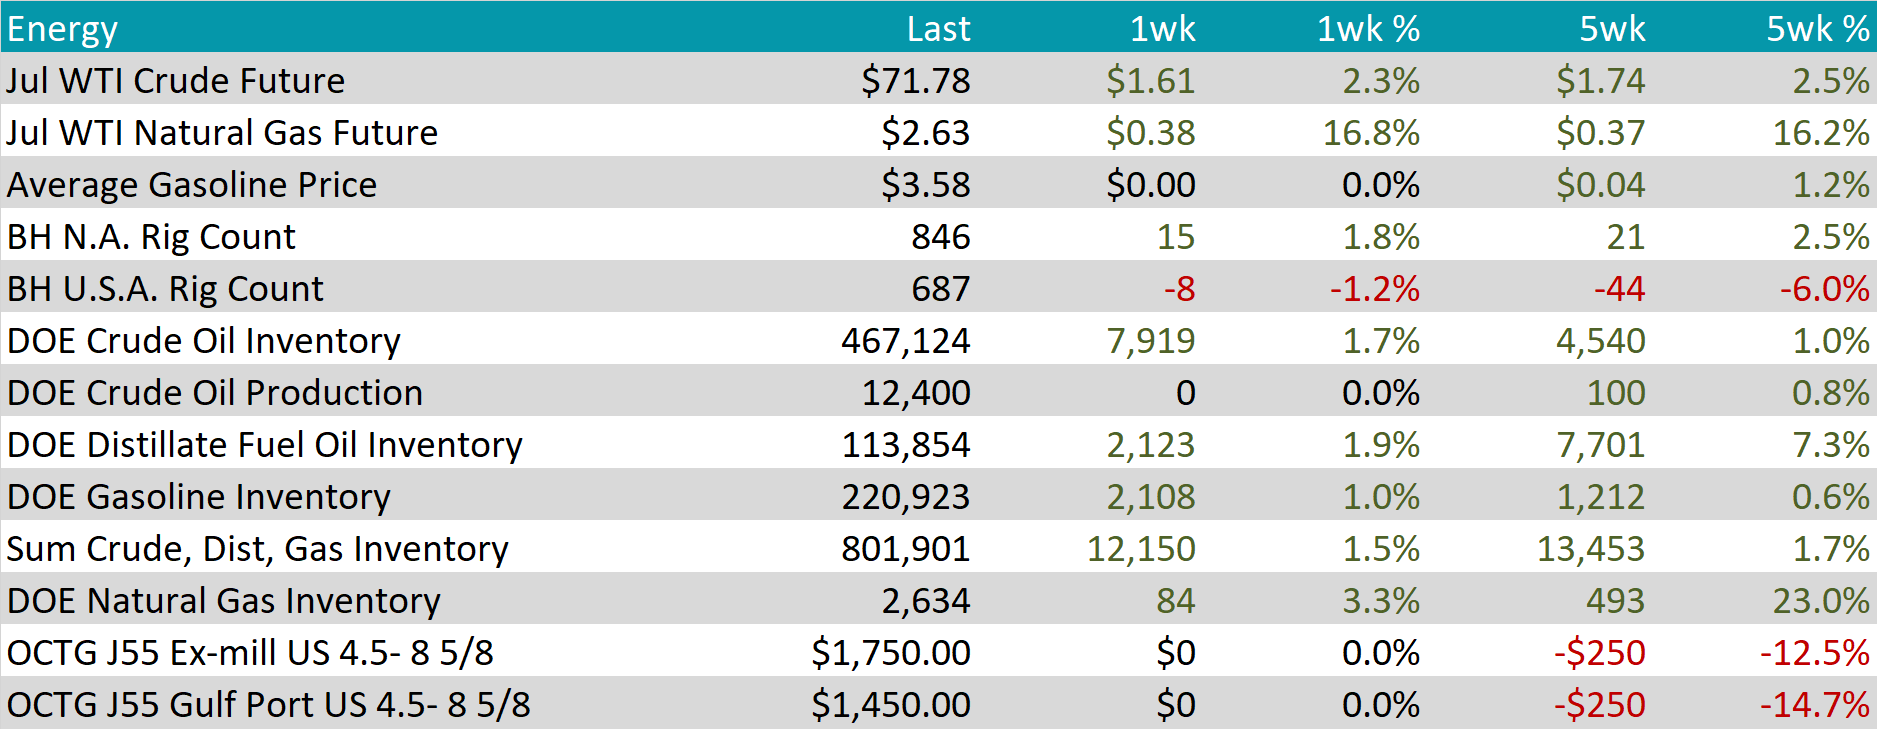
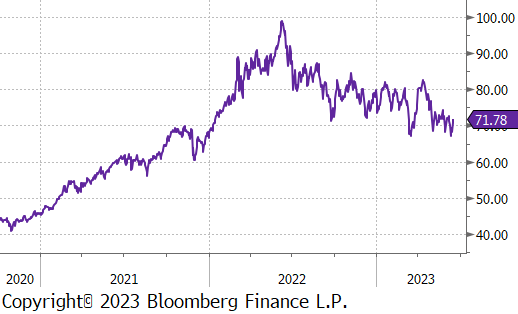
WTI crude oil future gained $1.61 or 2.3% to $71.78/bbl.
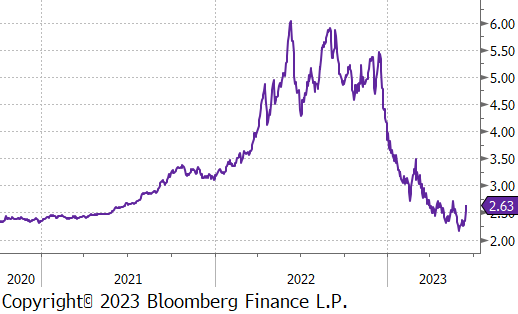
WTI natural gas future gained $0.38 or 16.8% to $2.63/bbl.
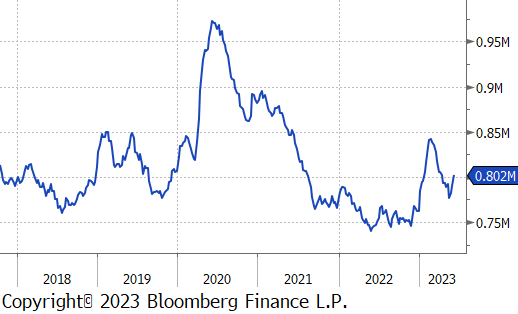
The aggregate inventory level was up another 1.5%, this is the third week in a row of climbing inventories.
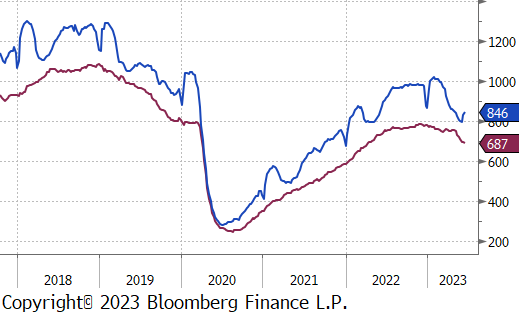
The Baker Hughes North American rig count rose by another 15 rigs, while the U.S. count fell by 8 rigs.
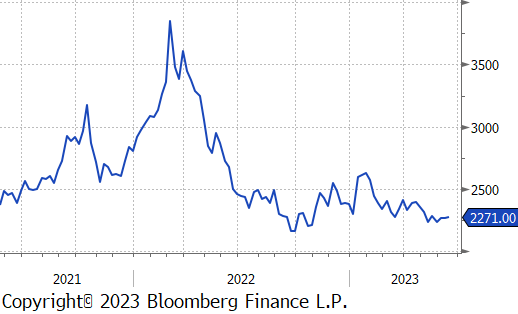
Aluminum futures traded little-changed during the week and underperformed most other base metals which rallied on optimism about future stimulus out of China. Rising stocks of Russian aluminum in London Metal Exchange warehouses are becoming a concern for many market participants as LME inventories have been falling and majority of what is in storage is already spoken for.
CME Copper ended the week 2.9% higher, extending its 3-week rally and recording its largest weekly change in two months. The red metal advanced amid increasing bets on more government stimulus measures in China, but the rally stalled toward the end of the week when LME Copper stockpiles rose by the most in nearly a year. Money managers flipped to bullish from bearish on COMEX Copper as long positions outnumbered short ones by 6,924 contracts according to weekly CFTC data.
Gold futures on the CME ended the week slightly lower for the first time in three weeks after a hawkish US Fed and ECB. The precious metal is still trading at historically high levels even as the monetary policy outlook turns more hawkish, and the US equity markets rally. A stronger US Dollar could further pressure Gold lower, while a break in the US equity markets could support the demand for Gold as a safe-haven.

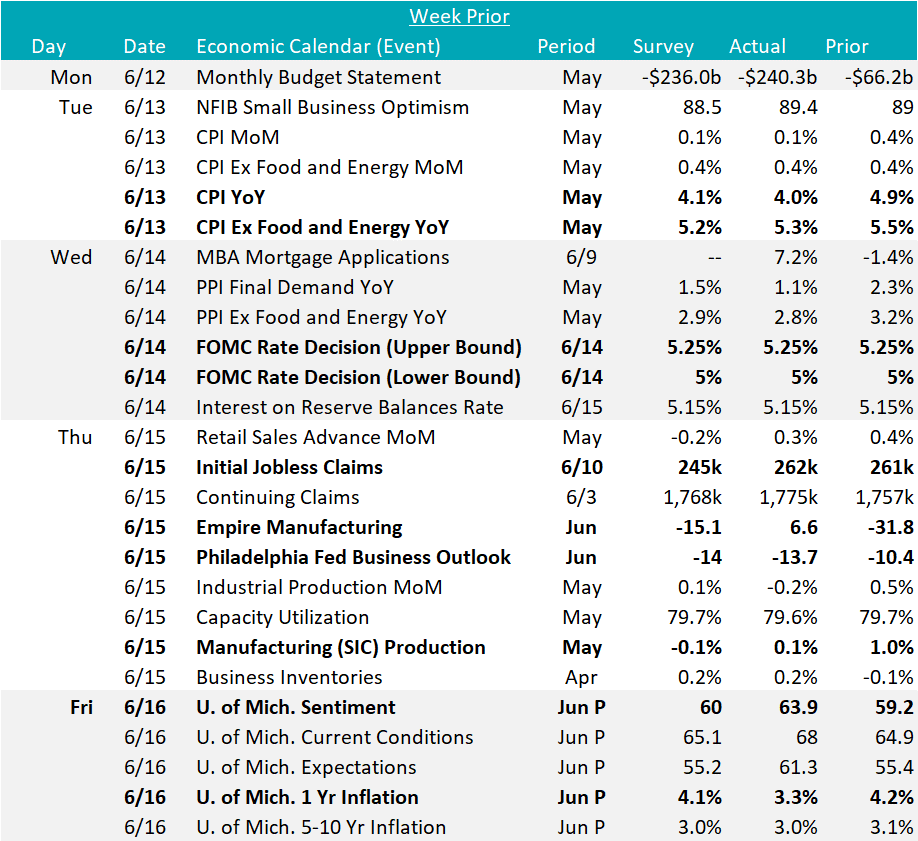
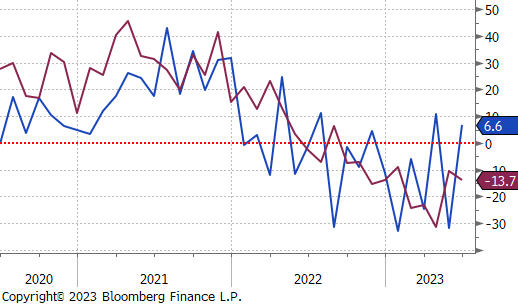
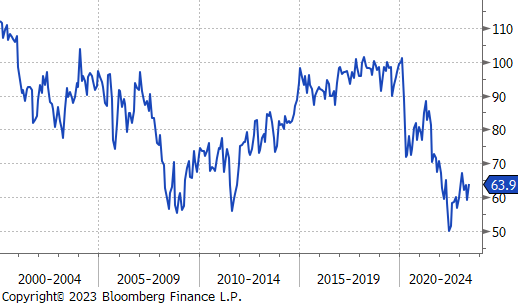
Manufacturing data continues to show mixed results. The Empire (NY) and Philadelphia Fed Manufacturing surveys both printed better than expectations. The highly volatile Empire survey printed in expansion territory for the second time in the last three prints. The six-month-average remains negative but has rebounded off its recent bottom. The Philly survey has been in contraction for 10 months. The Federal Reserve’s Industrial Production for Manufacturing also showed resilience this week, printing up 0.1% and moving into positive territory for the first time in five months.
The University of Michigan Consumer Sentiment survey printed better than expected, with consumers views on both the current conditions, the future and near-term inflation compared to May.
Finally, we saw initial jobless claims at the same elevated level from last week. Continuing claims creeped higher as well, but they remain below their recent peak.
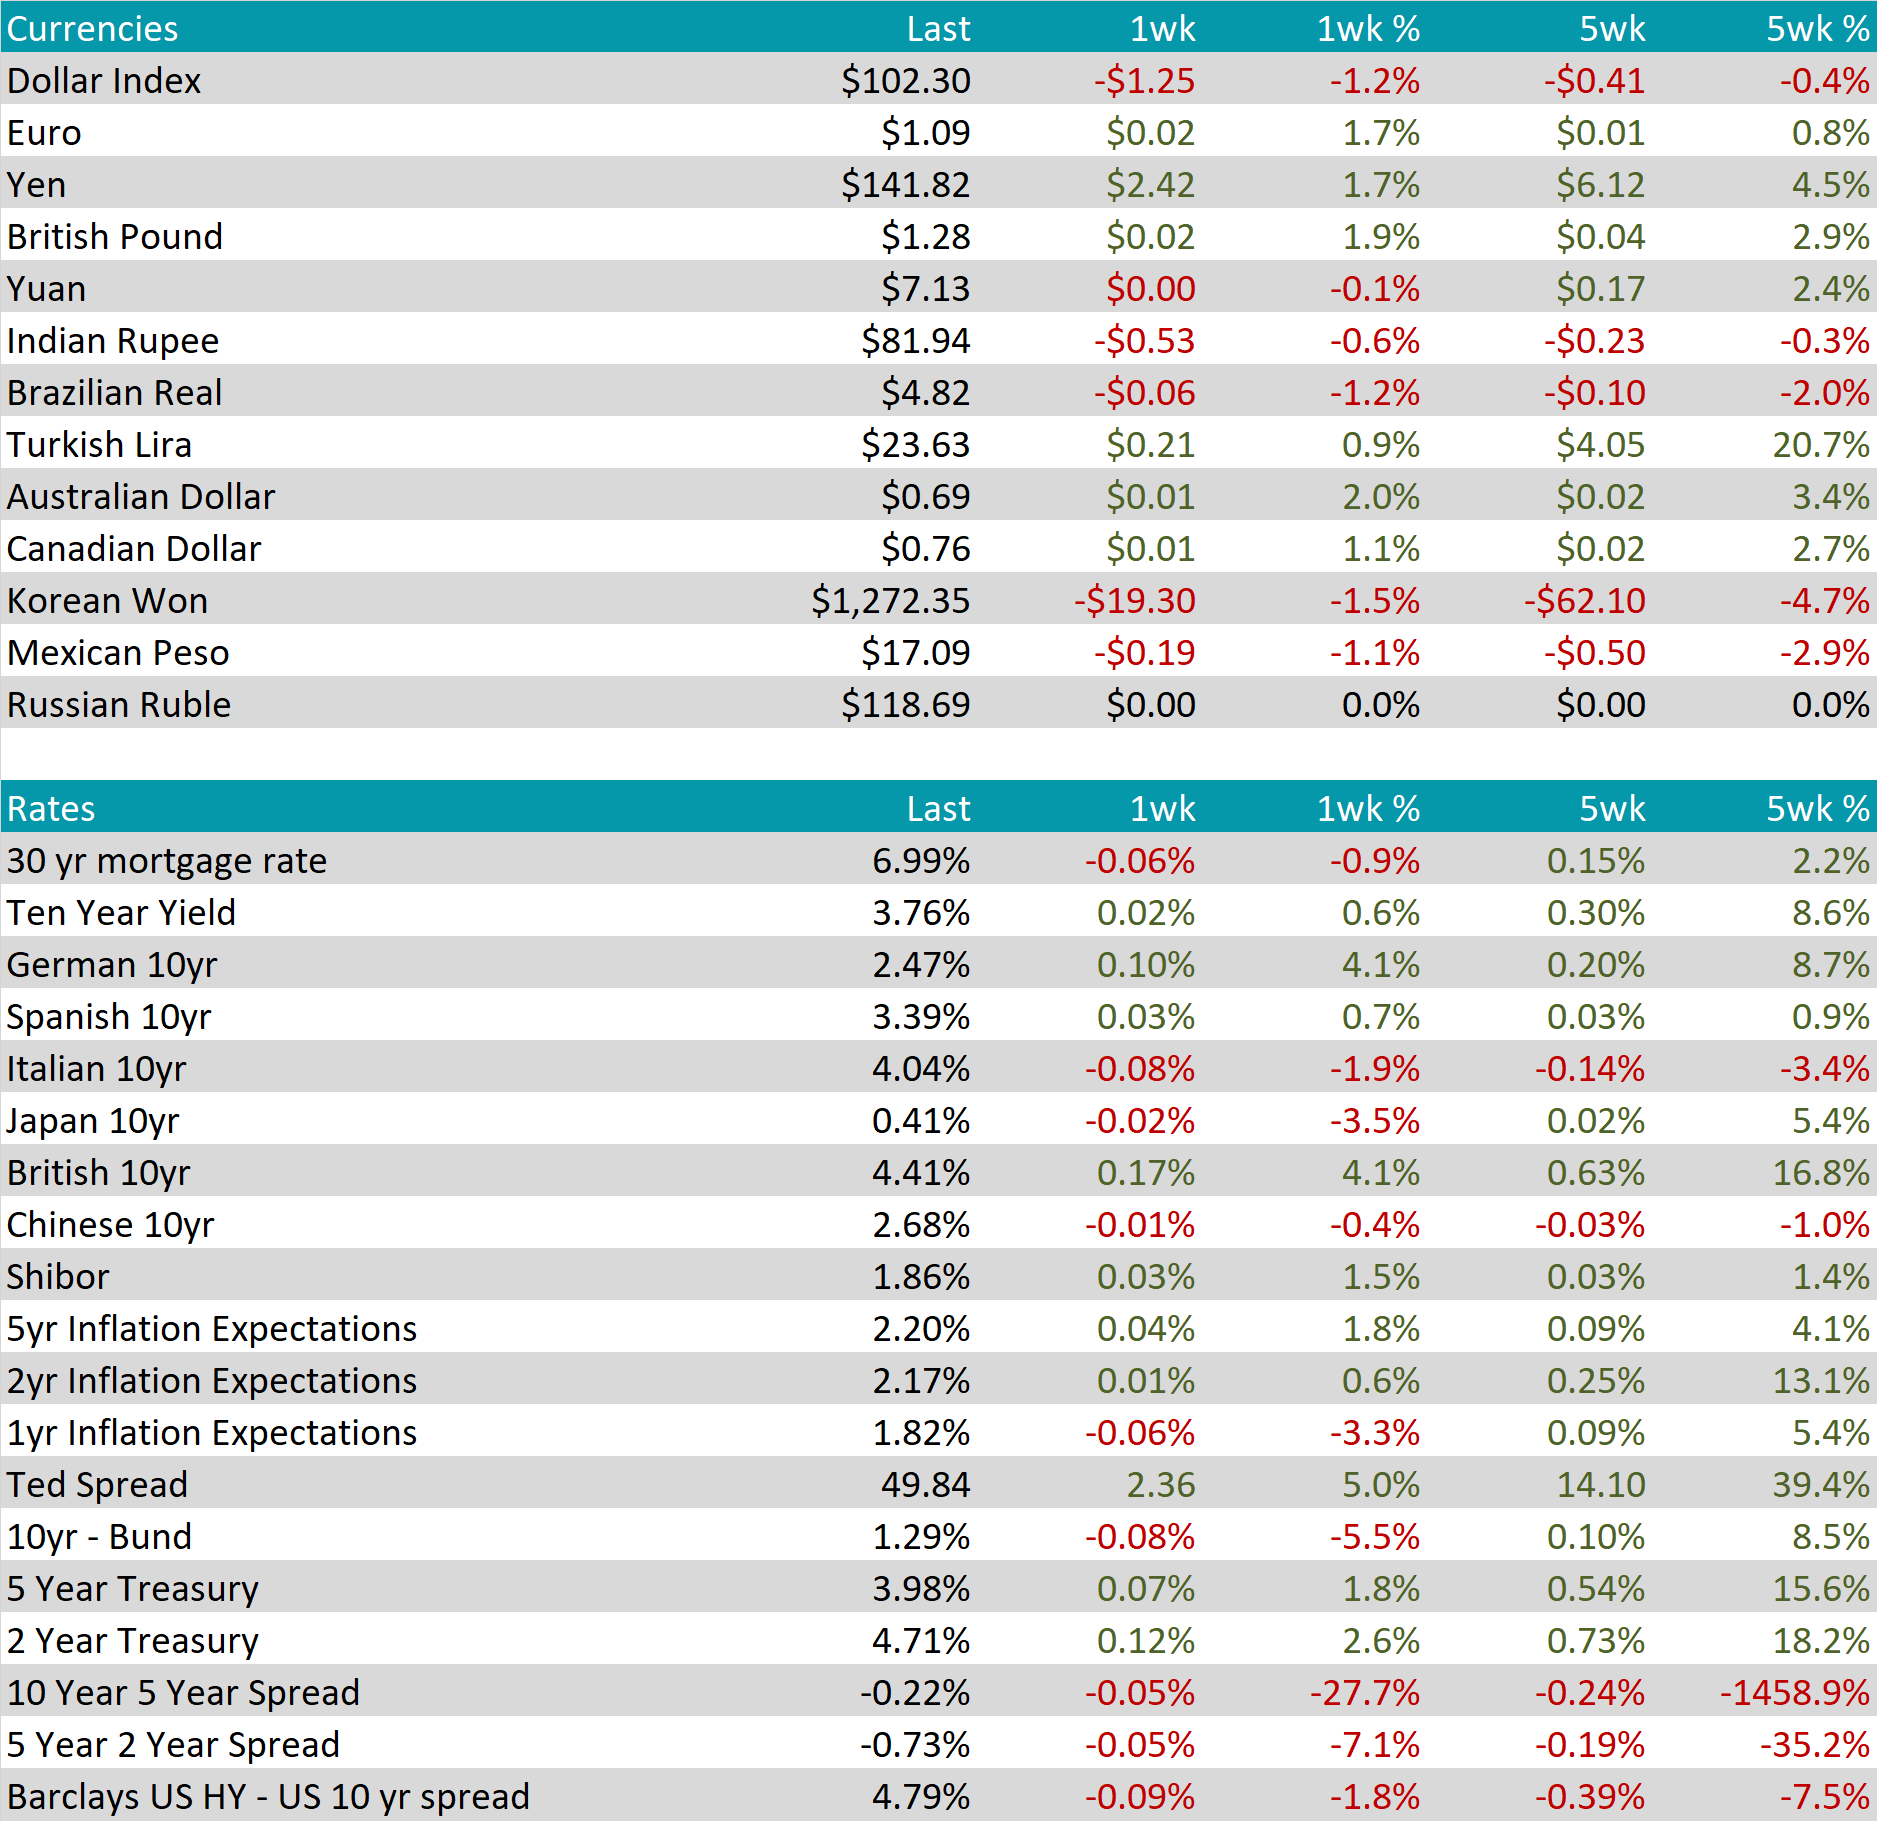
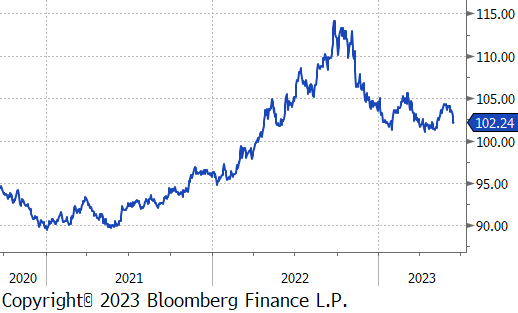
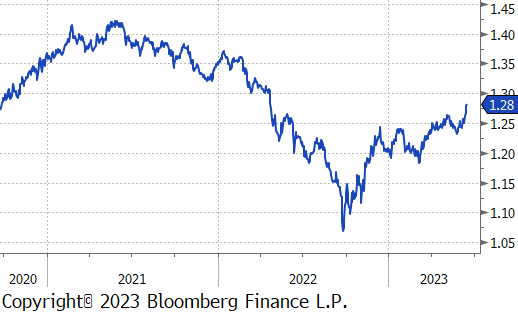
Last week, the U.S. Dollar lost $1.25 and is now down to $102.30. The British pound, Euro, and Japanese all gained against the move, the pound most significantly, up 1.9%, now at its highest level since April of last year.
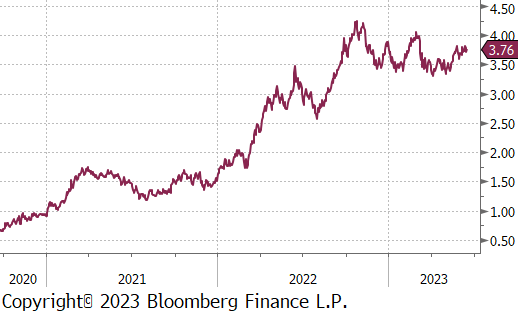
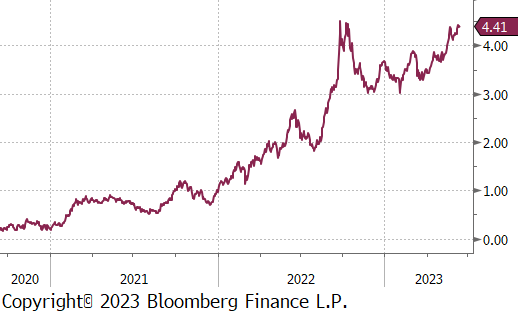
Despite a week filled with noteworthy economic data and policy decisions, interest rates in the US remained relatively stable. Yields continued to rise gradually, aligning with the recent trend, as investors anticipate that the Federal Reserve’s final target rate will be higher than previously anticipated. For several months, the market has positioned itself around the idea of lower interest rates, while the Fed has consistently indicated a commitment to raising rates. This divergence has resulted in notable volatility in interest rates, and so far, the Fed’s predictions have proven accurate. Only time will reveal if the Fed can uphold its hawkish stance while the market leans towards a slightly more dovish outlook. The U.S. and British 10yr Treasury yields both gained on the week, up 2 bps and 17 bps, respectively. The latter saw the significant increase to 4.41% due to a surprise inflation reading suggesting they have a longer road ahead.
