Flack Capital Markets | Ferrous Financial Insider
June 2, 2023 – Issue #382
June 2, 2023 – Issue #382
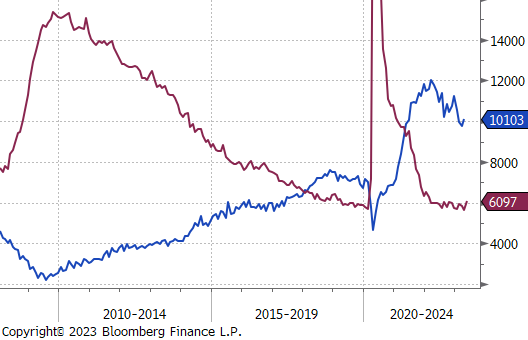
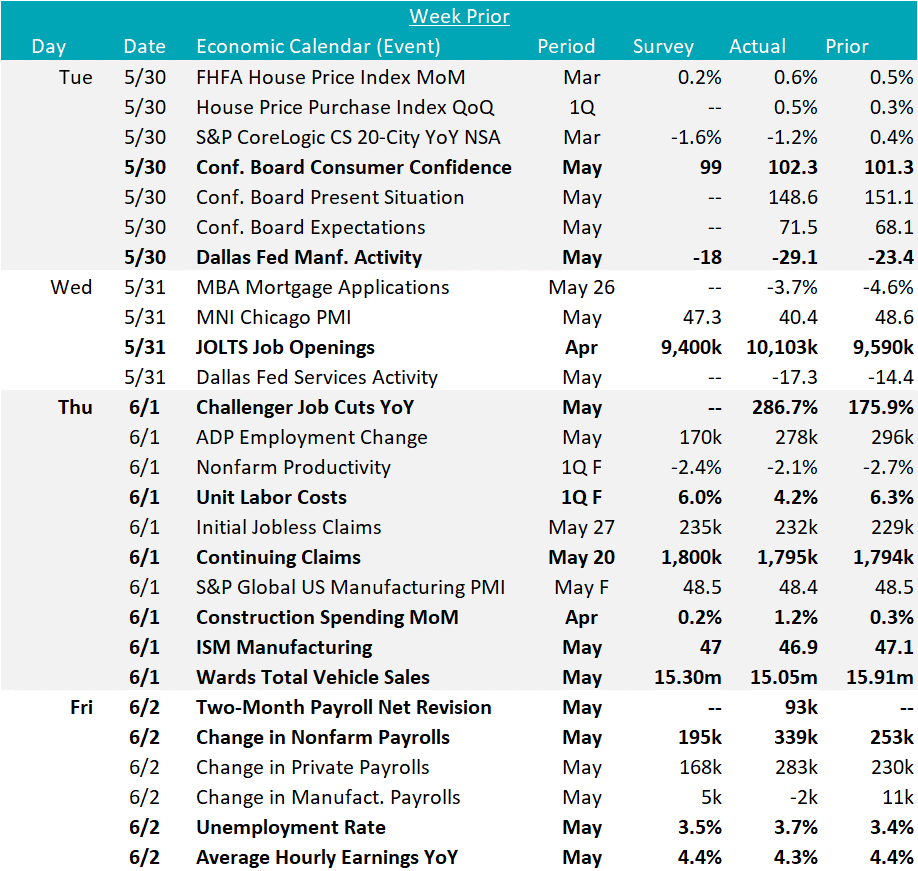
The most important economic data from the week showed that the labor market continues to show surprising resilience given the broad concerns around economic activity at the end of last year. Job openings surprised to the upside, increasing to 10.1M above expectations of a further decline to 9.4M, this was the first increase in openings since December. The best use of this dataset, when attempting to understand exactly what it means for the labor market, is comparing openings to unemployed workers. The current (April) ratio between the two is 1.79 openings per unemployed worker, an increase compared to March, and just below the all-time high of 2.01 in March 2022. The takeaway is that demand in the labor market has only recently started to moderate, and the gap between the two will need to significantly converge before the before a recession occurs.
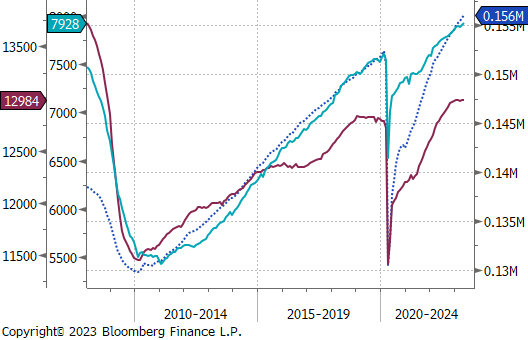
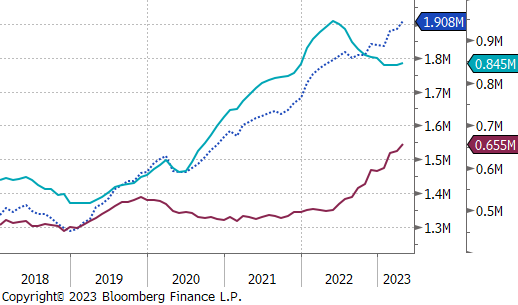
To further highlight economic resilience, non-farm payrolls were strong again in May, with 339k jobs added, versus expectations of 195k. This is the 14th month in a row where payrolls came in above expectations. Looking more closely at the breakouts for manufacturing and construction, both show a fundamentally positive outlook. Current construction payrolls increased by 25k and are at all-time highs. Manufacturing payrolls on the other hand, have recently plateaued around their highest level since November 2008, down 2k this month. The manufacturing payrolls data comes in line with what we have recently observed in the ISM Manufacturing PMI employment subindex, which has been oscillating around expansion and contraction since the end of last year. When viewing manufacturing data specifically, we are bullish over the long term given the significant investment and reported mismatch of skilled workers. Nothing in the data, to date, changes that perspective.
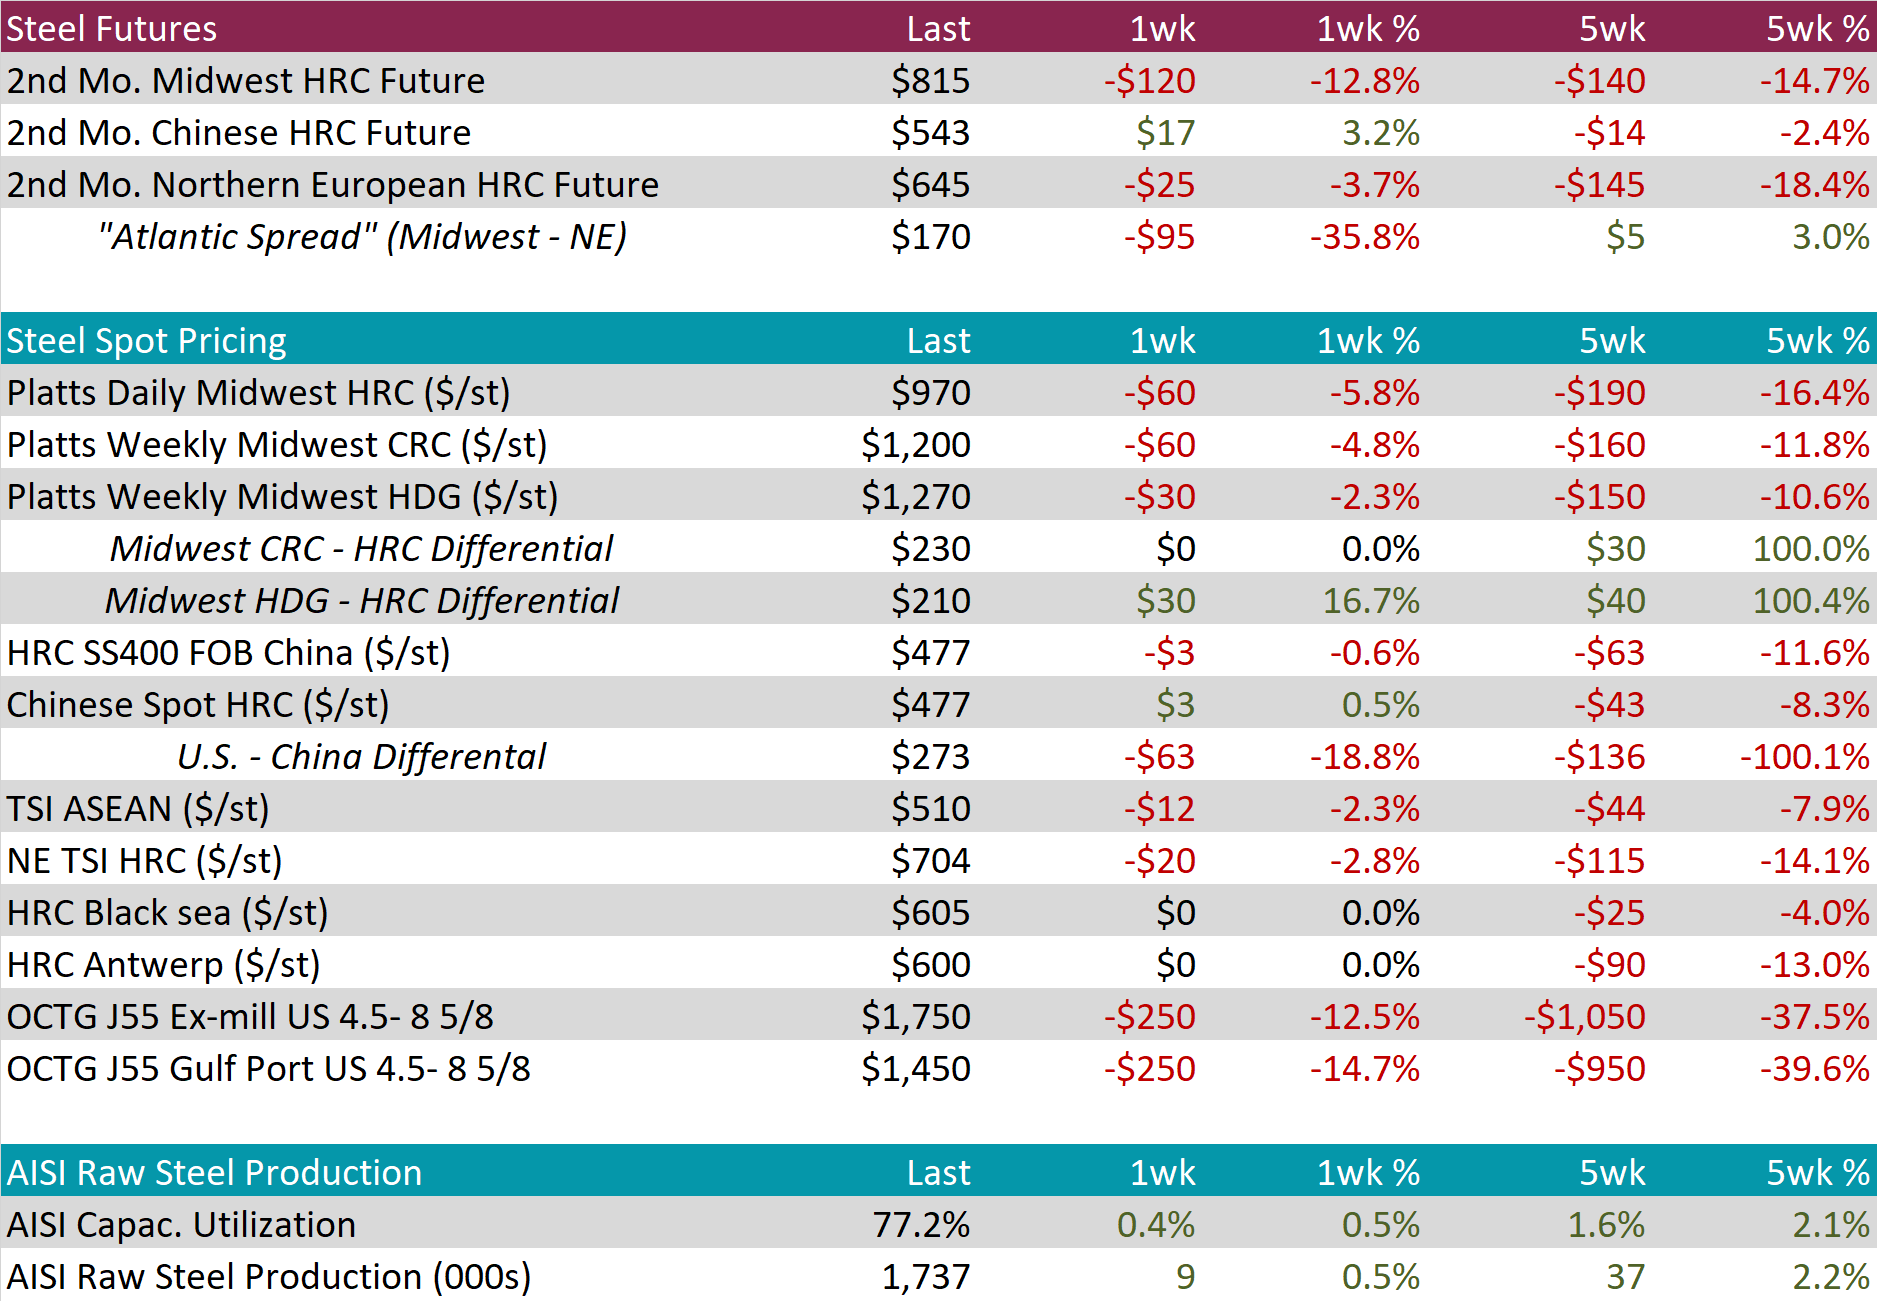
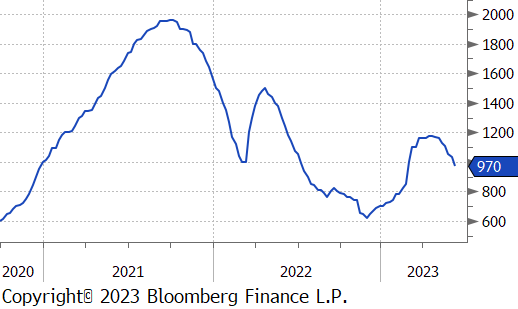
This week, the HRC 2nd month future roll, was responsible for nearly the entire move with the actual July future only down $7. The spot price was printed at $970, down $60 or 5.8% compared to last week. This is the first time the price printed below $1,000 in just over three months. We anticipate further downward pressure on domestic steel prices in the coming weeks.
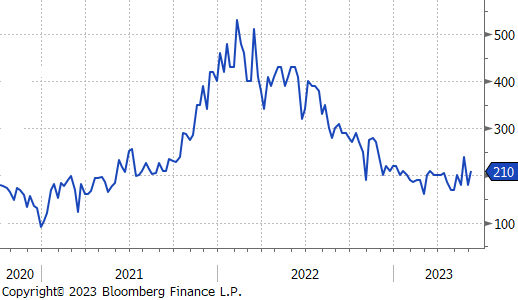
Tandem products were also lower last week, but not as significantly as HRC. CRC was down 4.8% and HDG was down 2.3%. This led to a $30 expansion of the HDG-HRC differential, now up to $210.
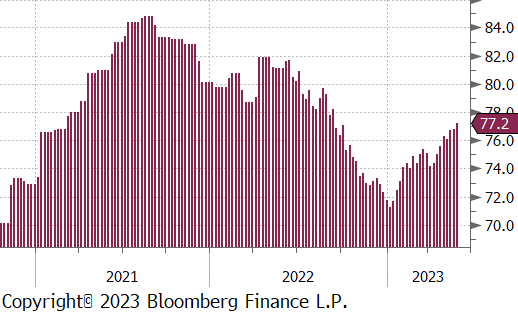
Mill production continues to rise, with capacity utilization up another 0.4% last week, now up to 77.2%.
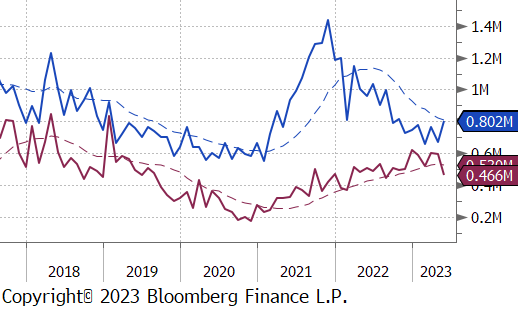
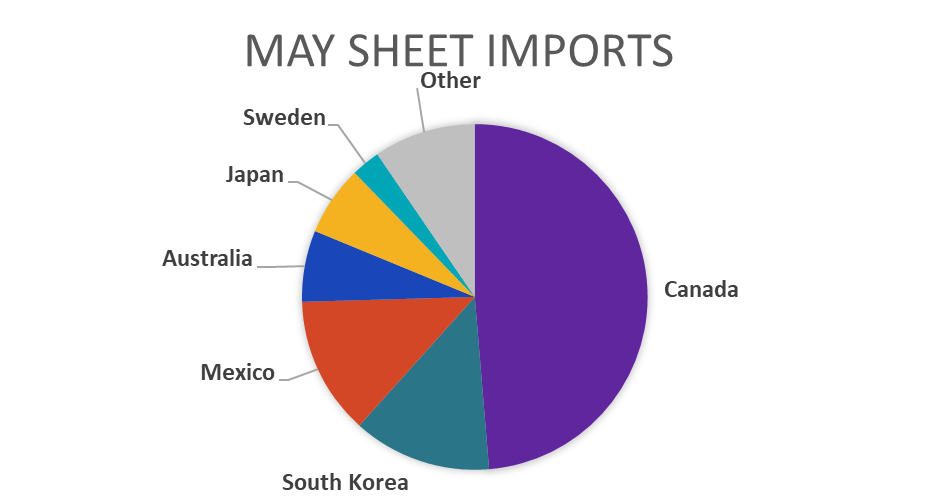
May Projection – Sheet 802k (up 134k MoM); Tube 466k (down 131k MoM)
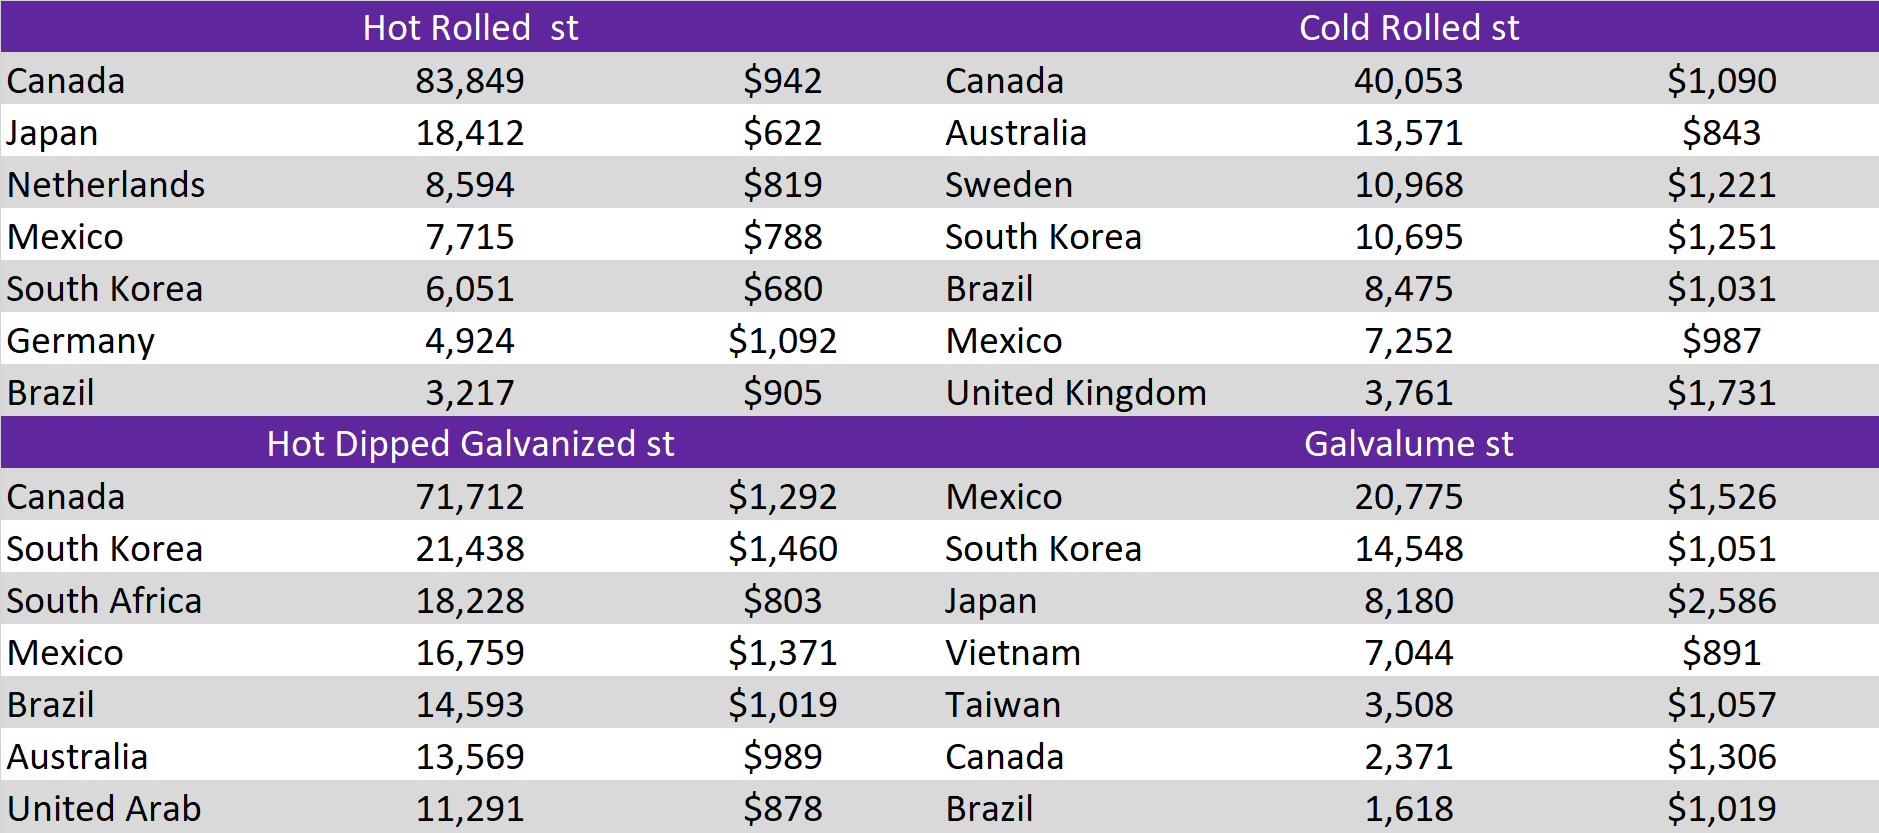
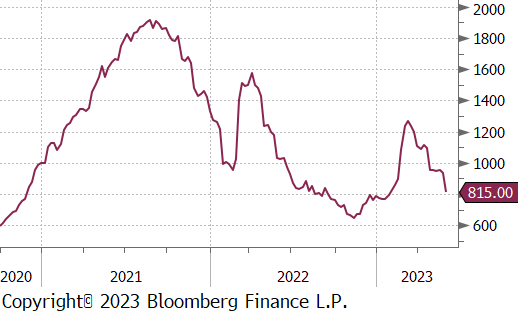
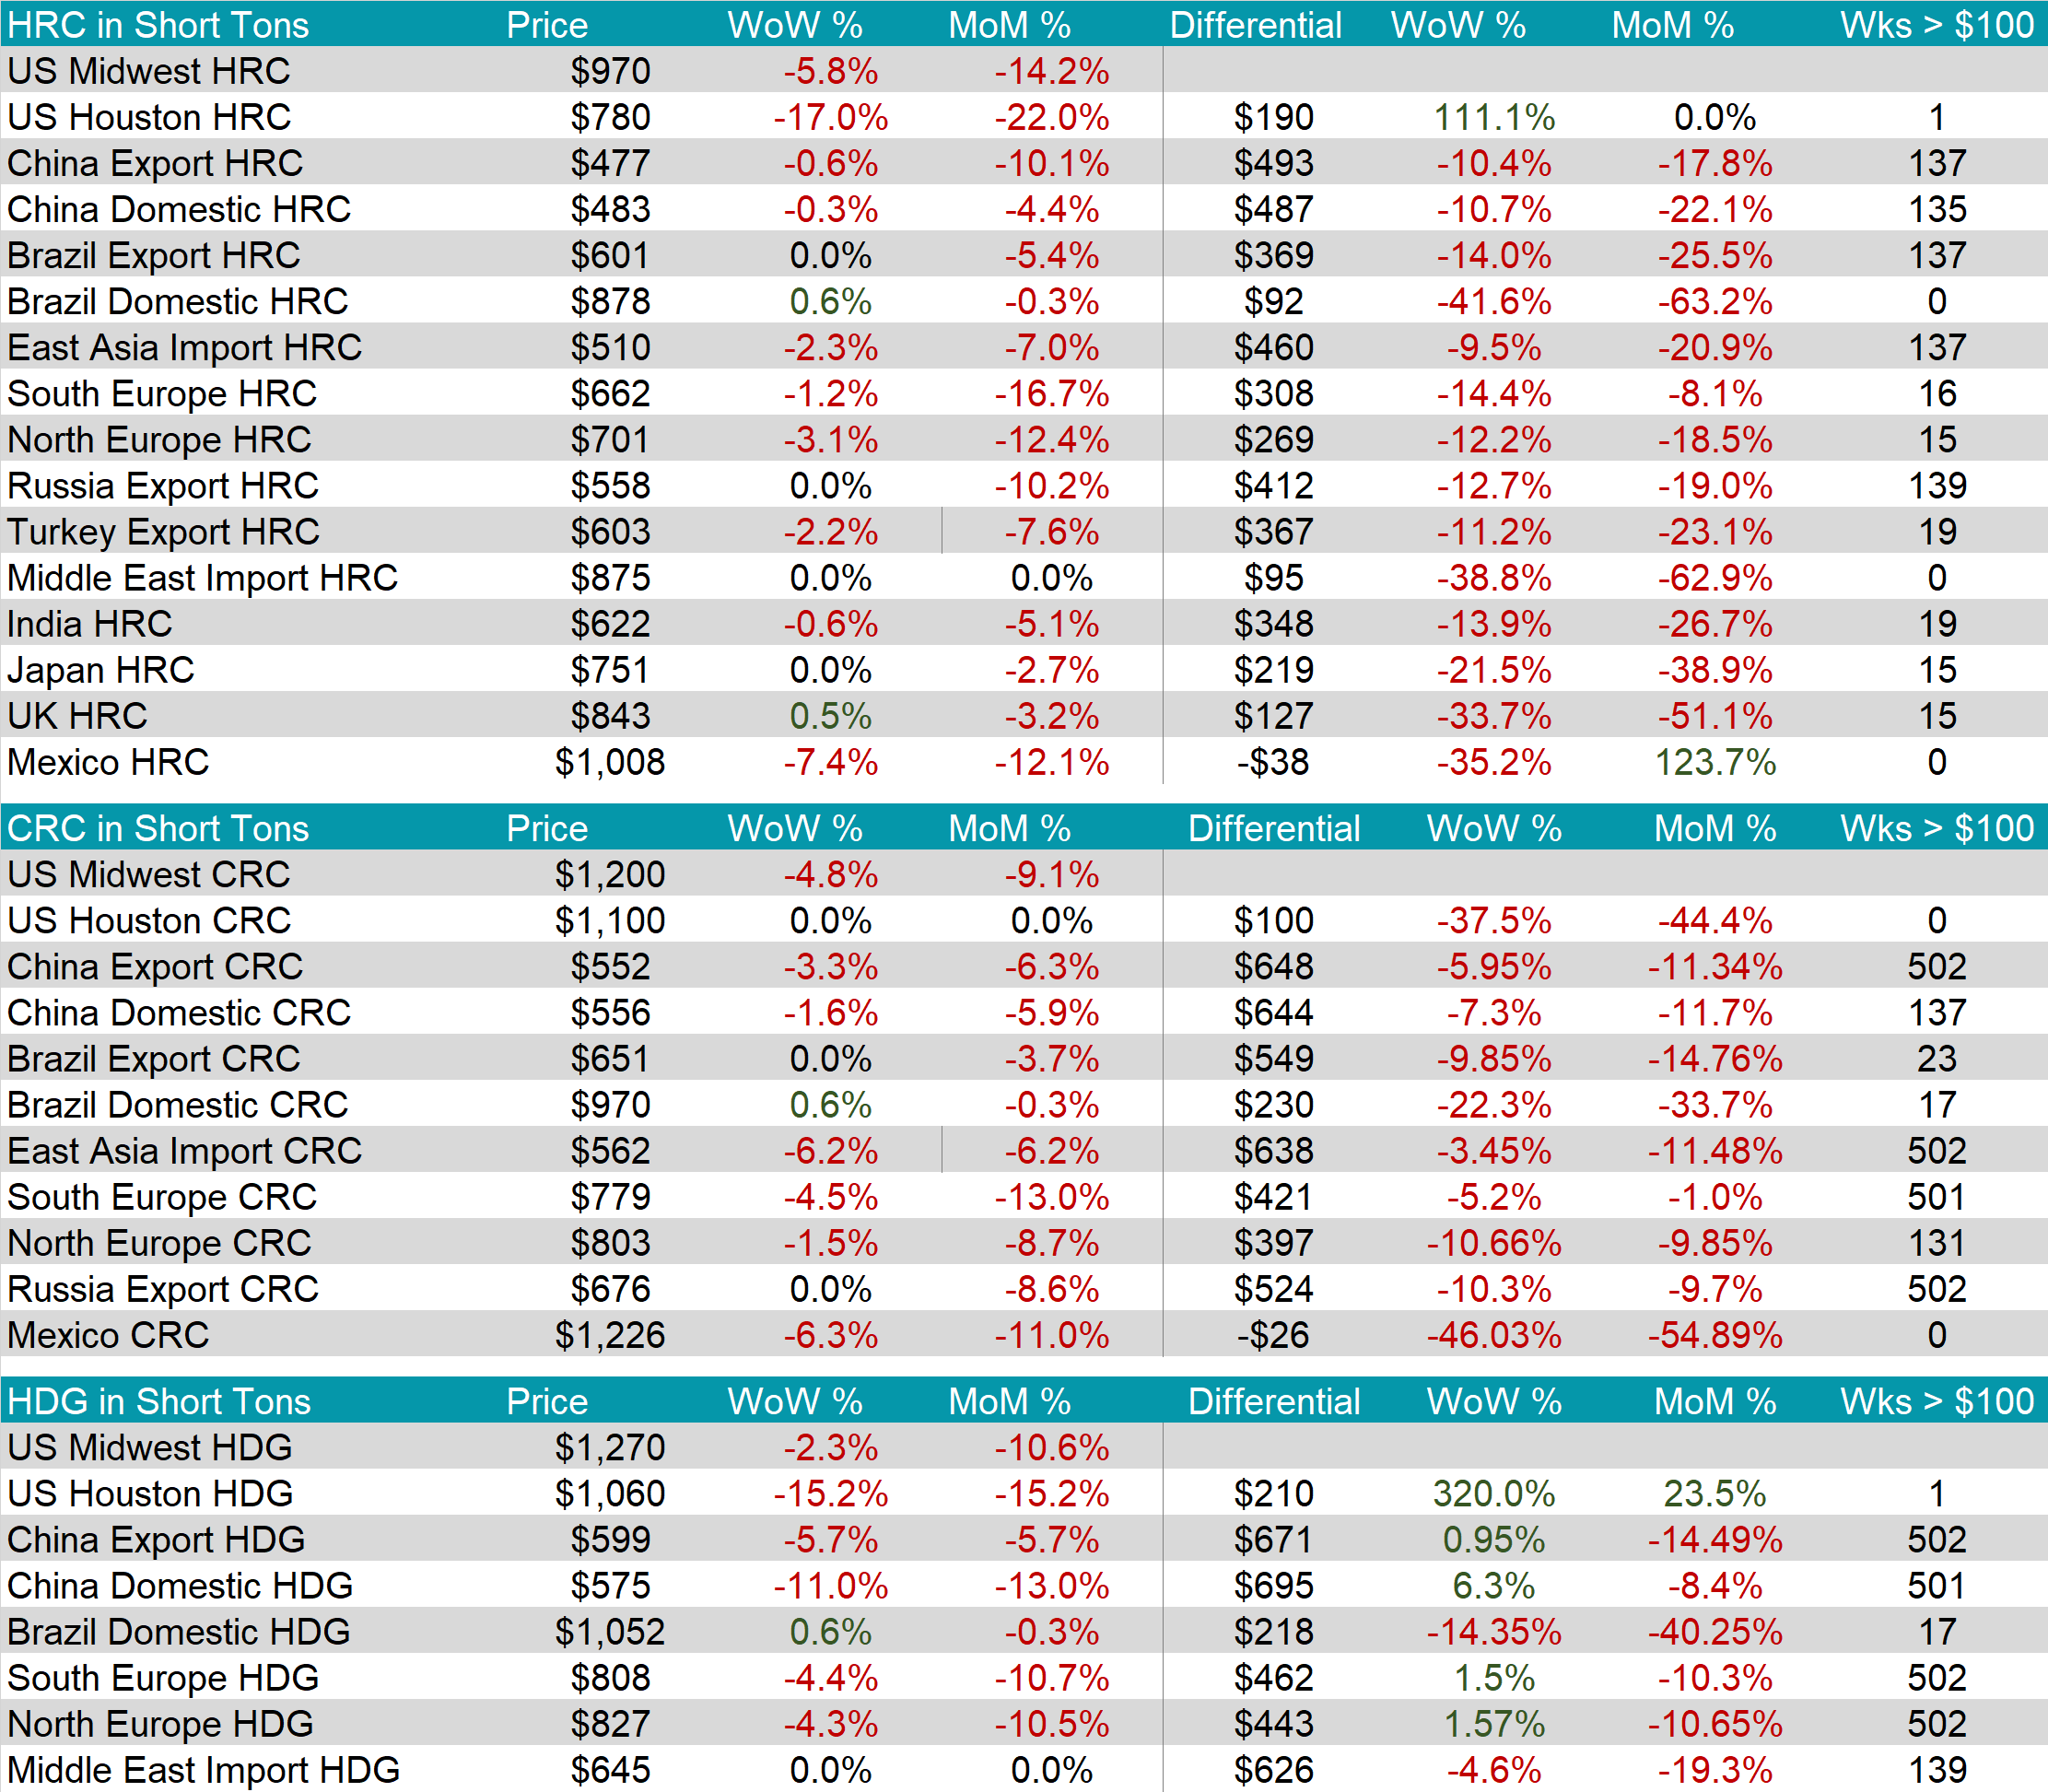
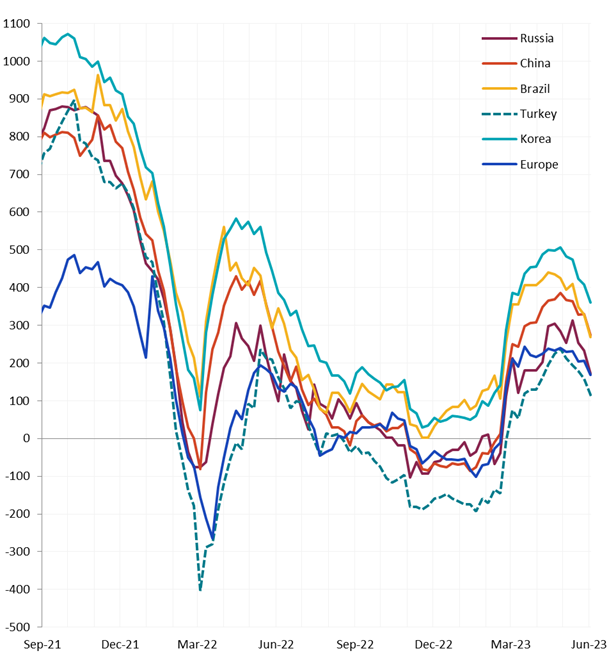
Global differentials fell further this week as the U.S. domestic price led the rest of the world lower. One related data point which is important to highlight here is the significant weekly change in the Houston price. The Houston price is the best stand in for current import arrivals. It fell $160 this week, or 17%, bring the price down to $780. With that in mind, we anticipate further convergence between the Midwest and Houston prices over the coming weeks.
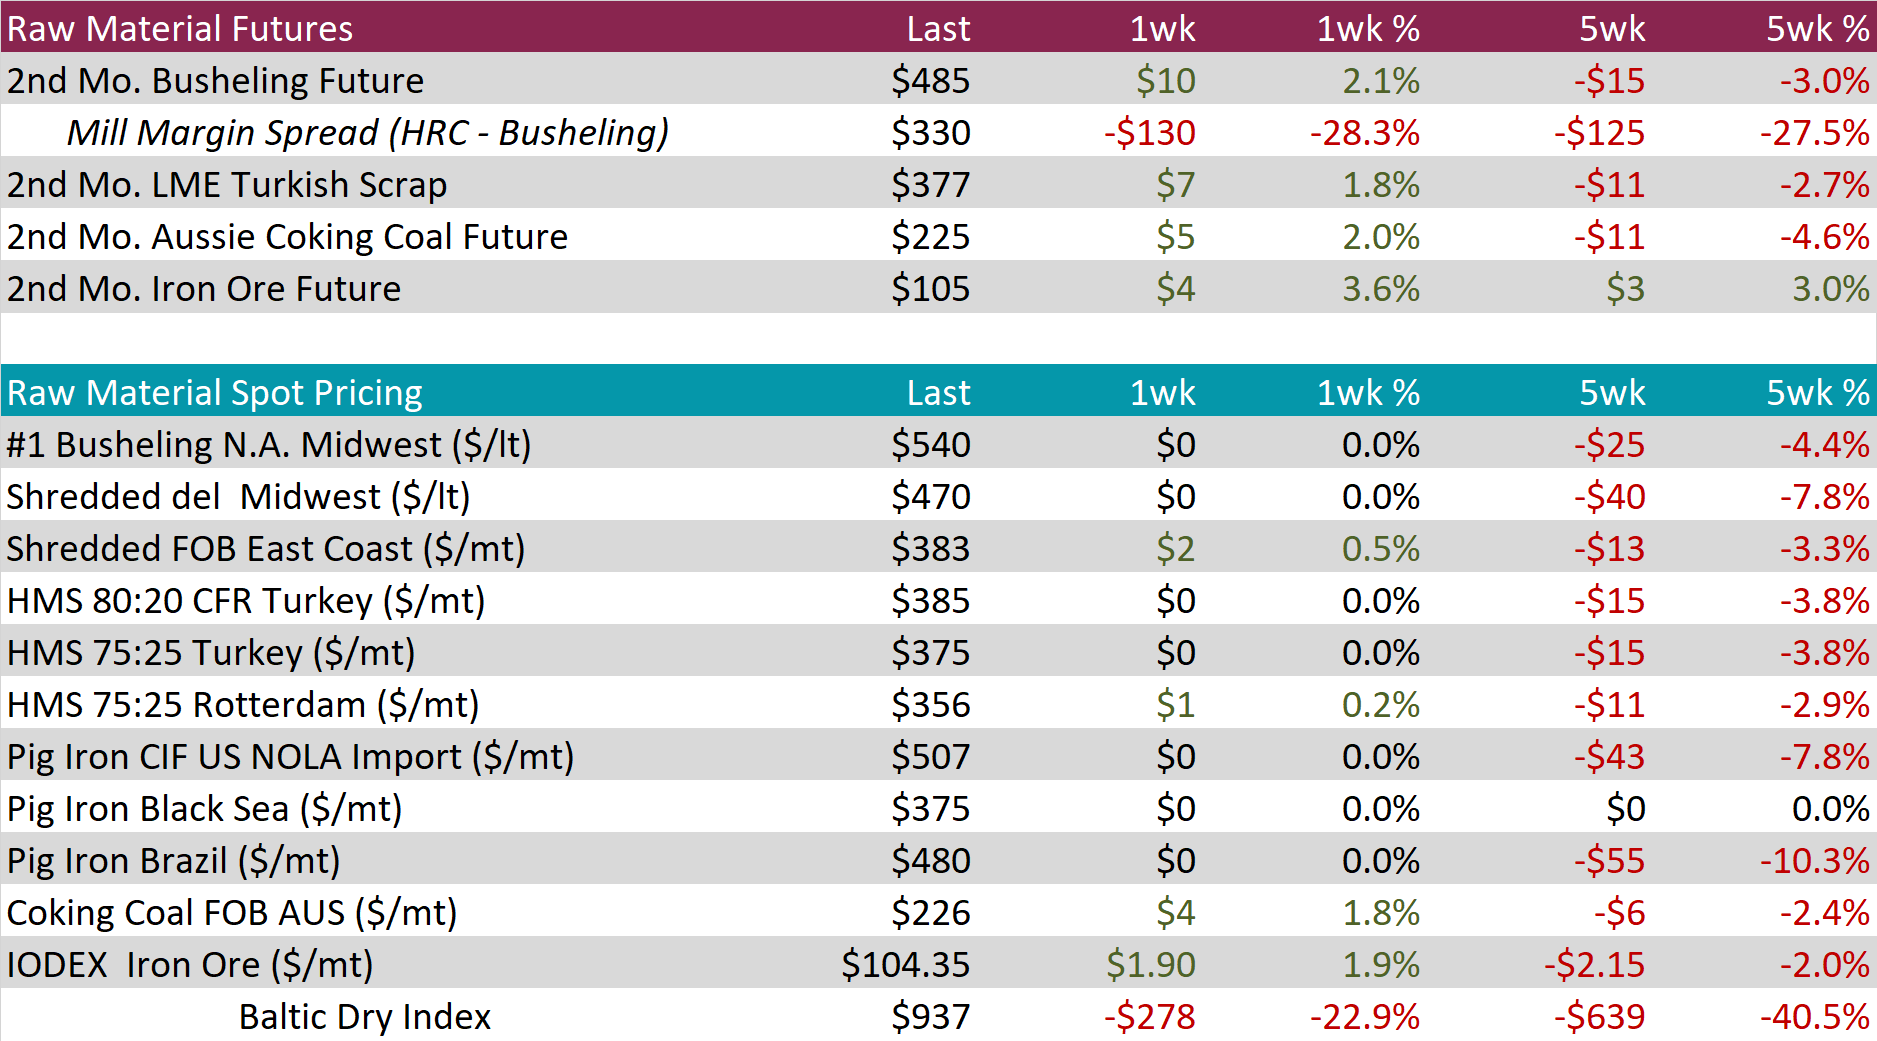
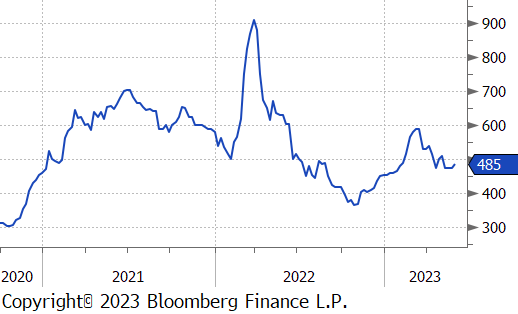
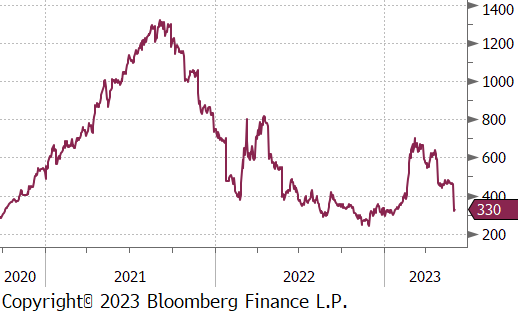
The 2nd month busheling future was up $10, or 2.1%, to $485. The spot price was unchanged again but will likely move at the end of next week, just prior to the June settles. The mill margin spread moved sharply lower, again this was driven by the 2nd month futures roll on the HRC side.
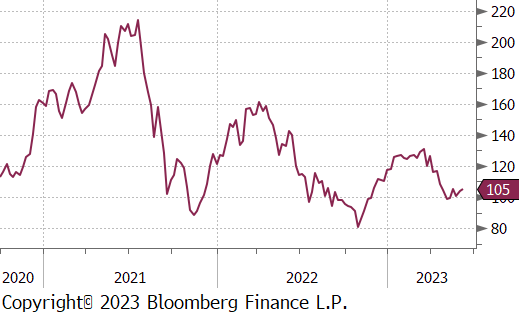
The 2nd month iron ore future was up $4, or 3.6% to $104.35 and it appears to have broken out of the recent downtrend, at least in the near-term, due to increased Chinese stimulus measures and a more stable outlook for demand.
Dry Bulk / Freight
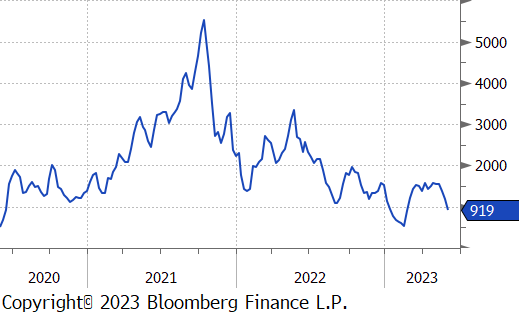
The Baltic dry index was down another 22.9%, this week.
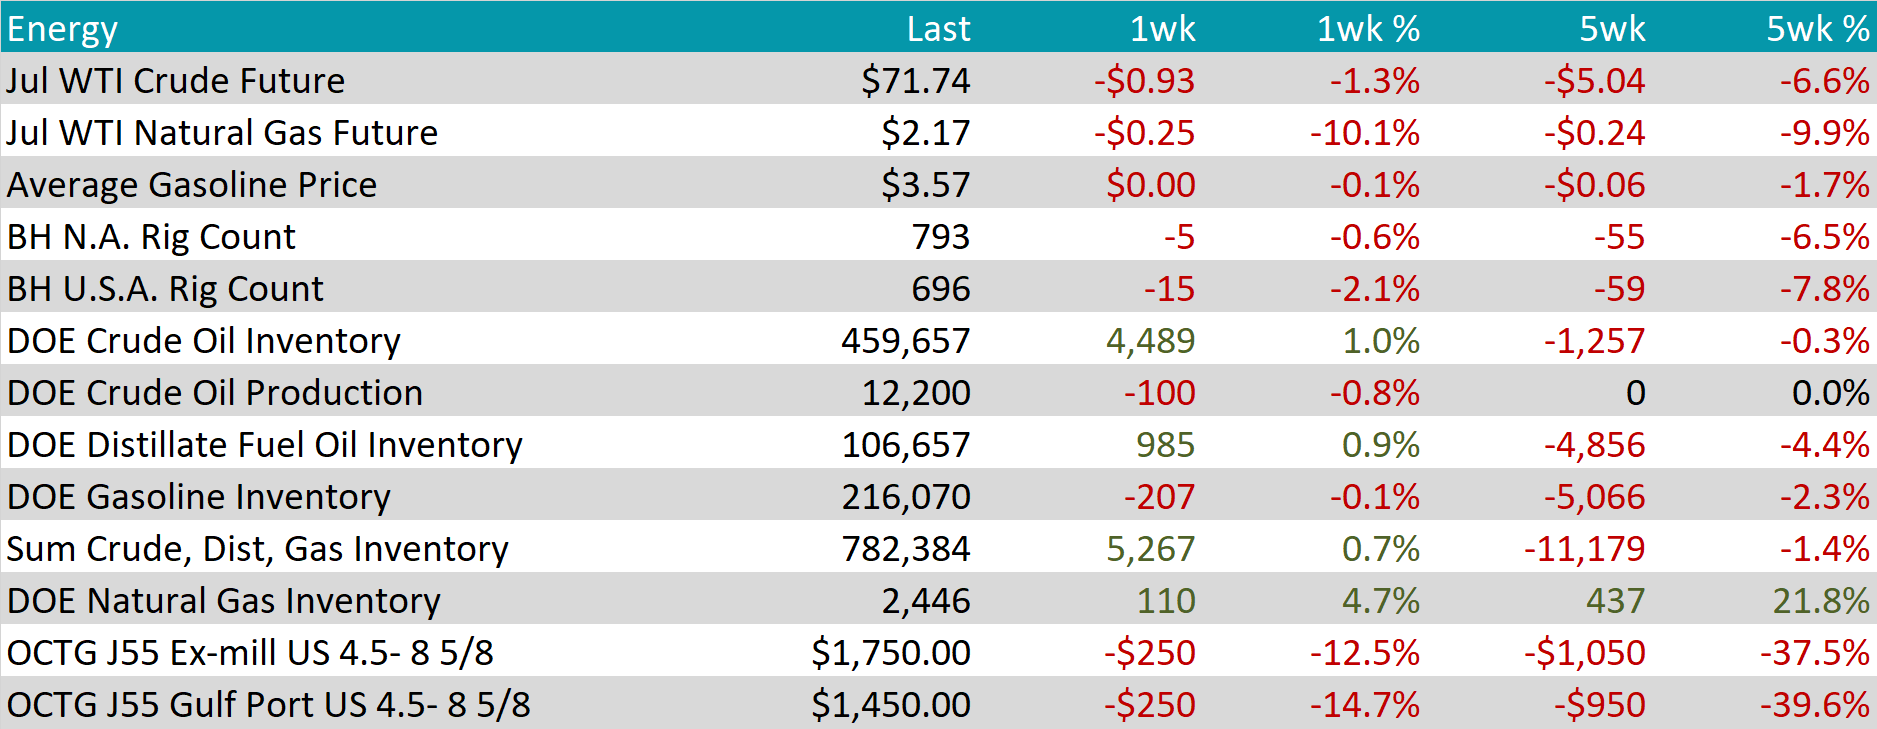
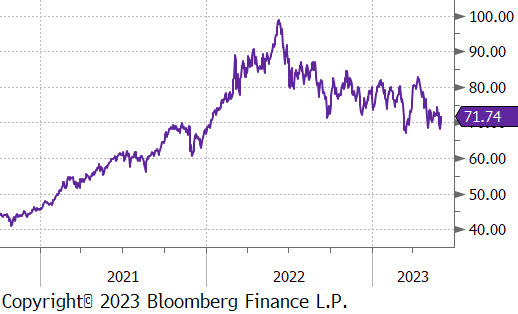
WTI crude oil future lost $0.93 or 1.3% to $71.74/bbl.
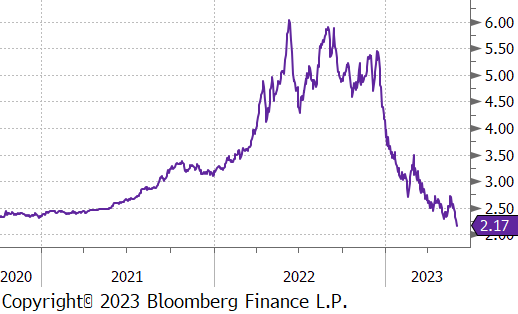
WTI natural gas future lost $0.25 or 10.1% to $2.17/bbl.
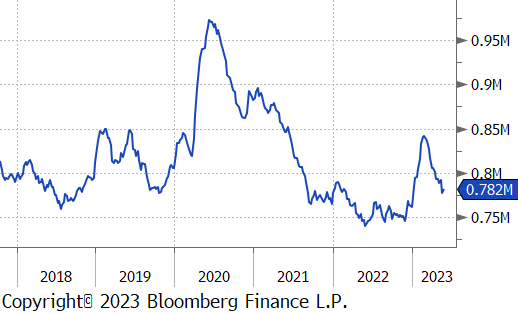
The aggregate inventory level was up 0.7% this week.
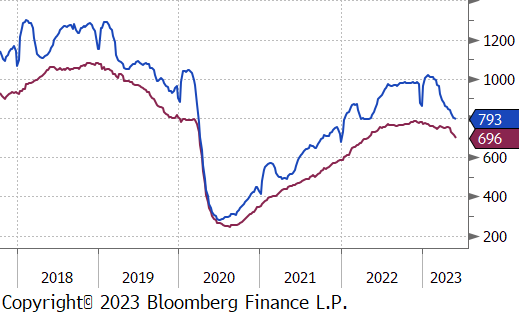
The Baker Hughes North American rig count was down another 5 rigs, and the U.S. count was down another 15 rigs. After holding up from February to early May, U.S. domestic rigs have started to sharply decline since then. The U.S. now outpacing the overall North American count, lower.
Aluminum futures on the LME finished the week higher but failed to fully recoup the previous week’s losses despite orders to withdraw LME inventory from warehouses tracked by the exchange rose to the highest in five months. Aluminum has fallen 4 of the previous 6 weeks but has traded mostly rangebound since falling below its 50-day moving average in the beginning of May.
Copper futures on the LME halted six-weeks of losses, trading higher by 1.3% to finish the week. The red metal extended gains after the US Senate passed legislation to suspend the debt ceiling and rumors that China is working on a new basket of measures to support the property market. The CME’s copper futures contract saw money managers increase their net bearish Comex copper bets to an 11-month high.
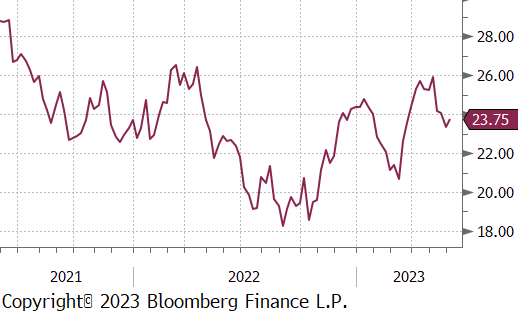
Silver snapped a 3-week losing streak, rising 1.7% to $23.75 after temporarily falling below $23 per ounce for the first time since March. Recent comments by Fed officials signaled that the Fed may not raise rates in the upcoming June FOMC meeting, which may have helped push Treasury yields and the US dollar lower, propelling precious metals off their recent lows.

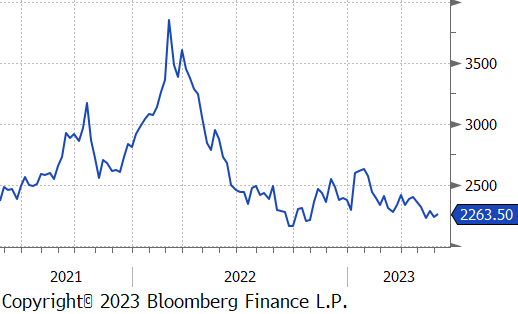
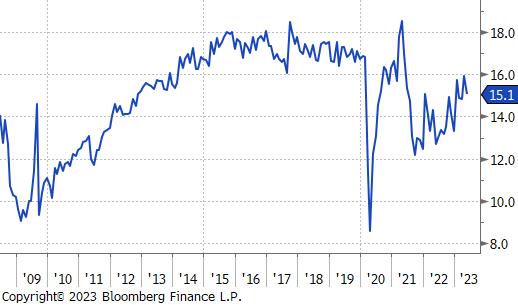
Auto sales (seasonally adjusted, annualized rate) in May printed down to 15.1M units, below expectations of 15.3M. We continue to view this sector with a bullish lens when it comes to demand for steel. Underlying April data shows that auto production continues to ramp up, now at its highest level in 27 months, but still 24.4% below the 2018/2019 average. Furthermore, auto inventories are also starting to creep higher, but current levels are still 82% below their 2018-2019 average. Simply put, the pipeline is dry, but a full recovery will take time.
Total construction spending (seasonally adjusted) was strong in April, up 1.2% and well above expectations of a 0.2% increase. The underlying dynamics in residential and nonresidential spending are fascinating, as well. Nonresidential spending has been remarkably strong, up another 2.4% compared to March and up 31.1% since last year. On the residential side, there was a significant underlying concern around the impact of higher interests on the residential market. Beginning in May 2022, spending started to turn sharply lower, however, this decline ended in January and even ticked slightly higher in the current release.
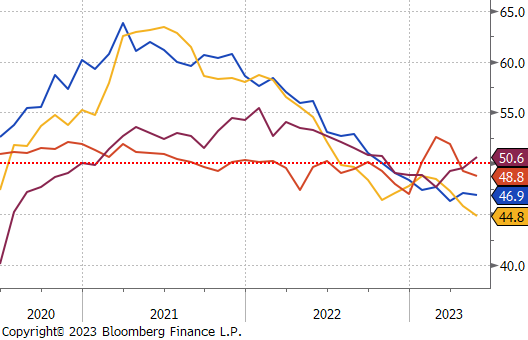
Turning to the manufacturing sector, the U.S. ISM Manufacturing PMI was down to 46.9, slightly below expectations of 47. The European Manufacturing PMI was down significantly, as well, now at its deepest point of contraction since the pandemic recovery. Manufacturing in Japan moved into expansion this month, for the first time since October of last year. Finally, the Chinese Manufacturing PMI fell slightly deeper into contraction. Much like what was written in last week’s report around the FED manufacturing surveys, we continue to view the recent global manufacturing contraction as a correction from the unsustainable growth during the pandemic recovery.
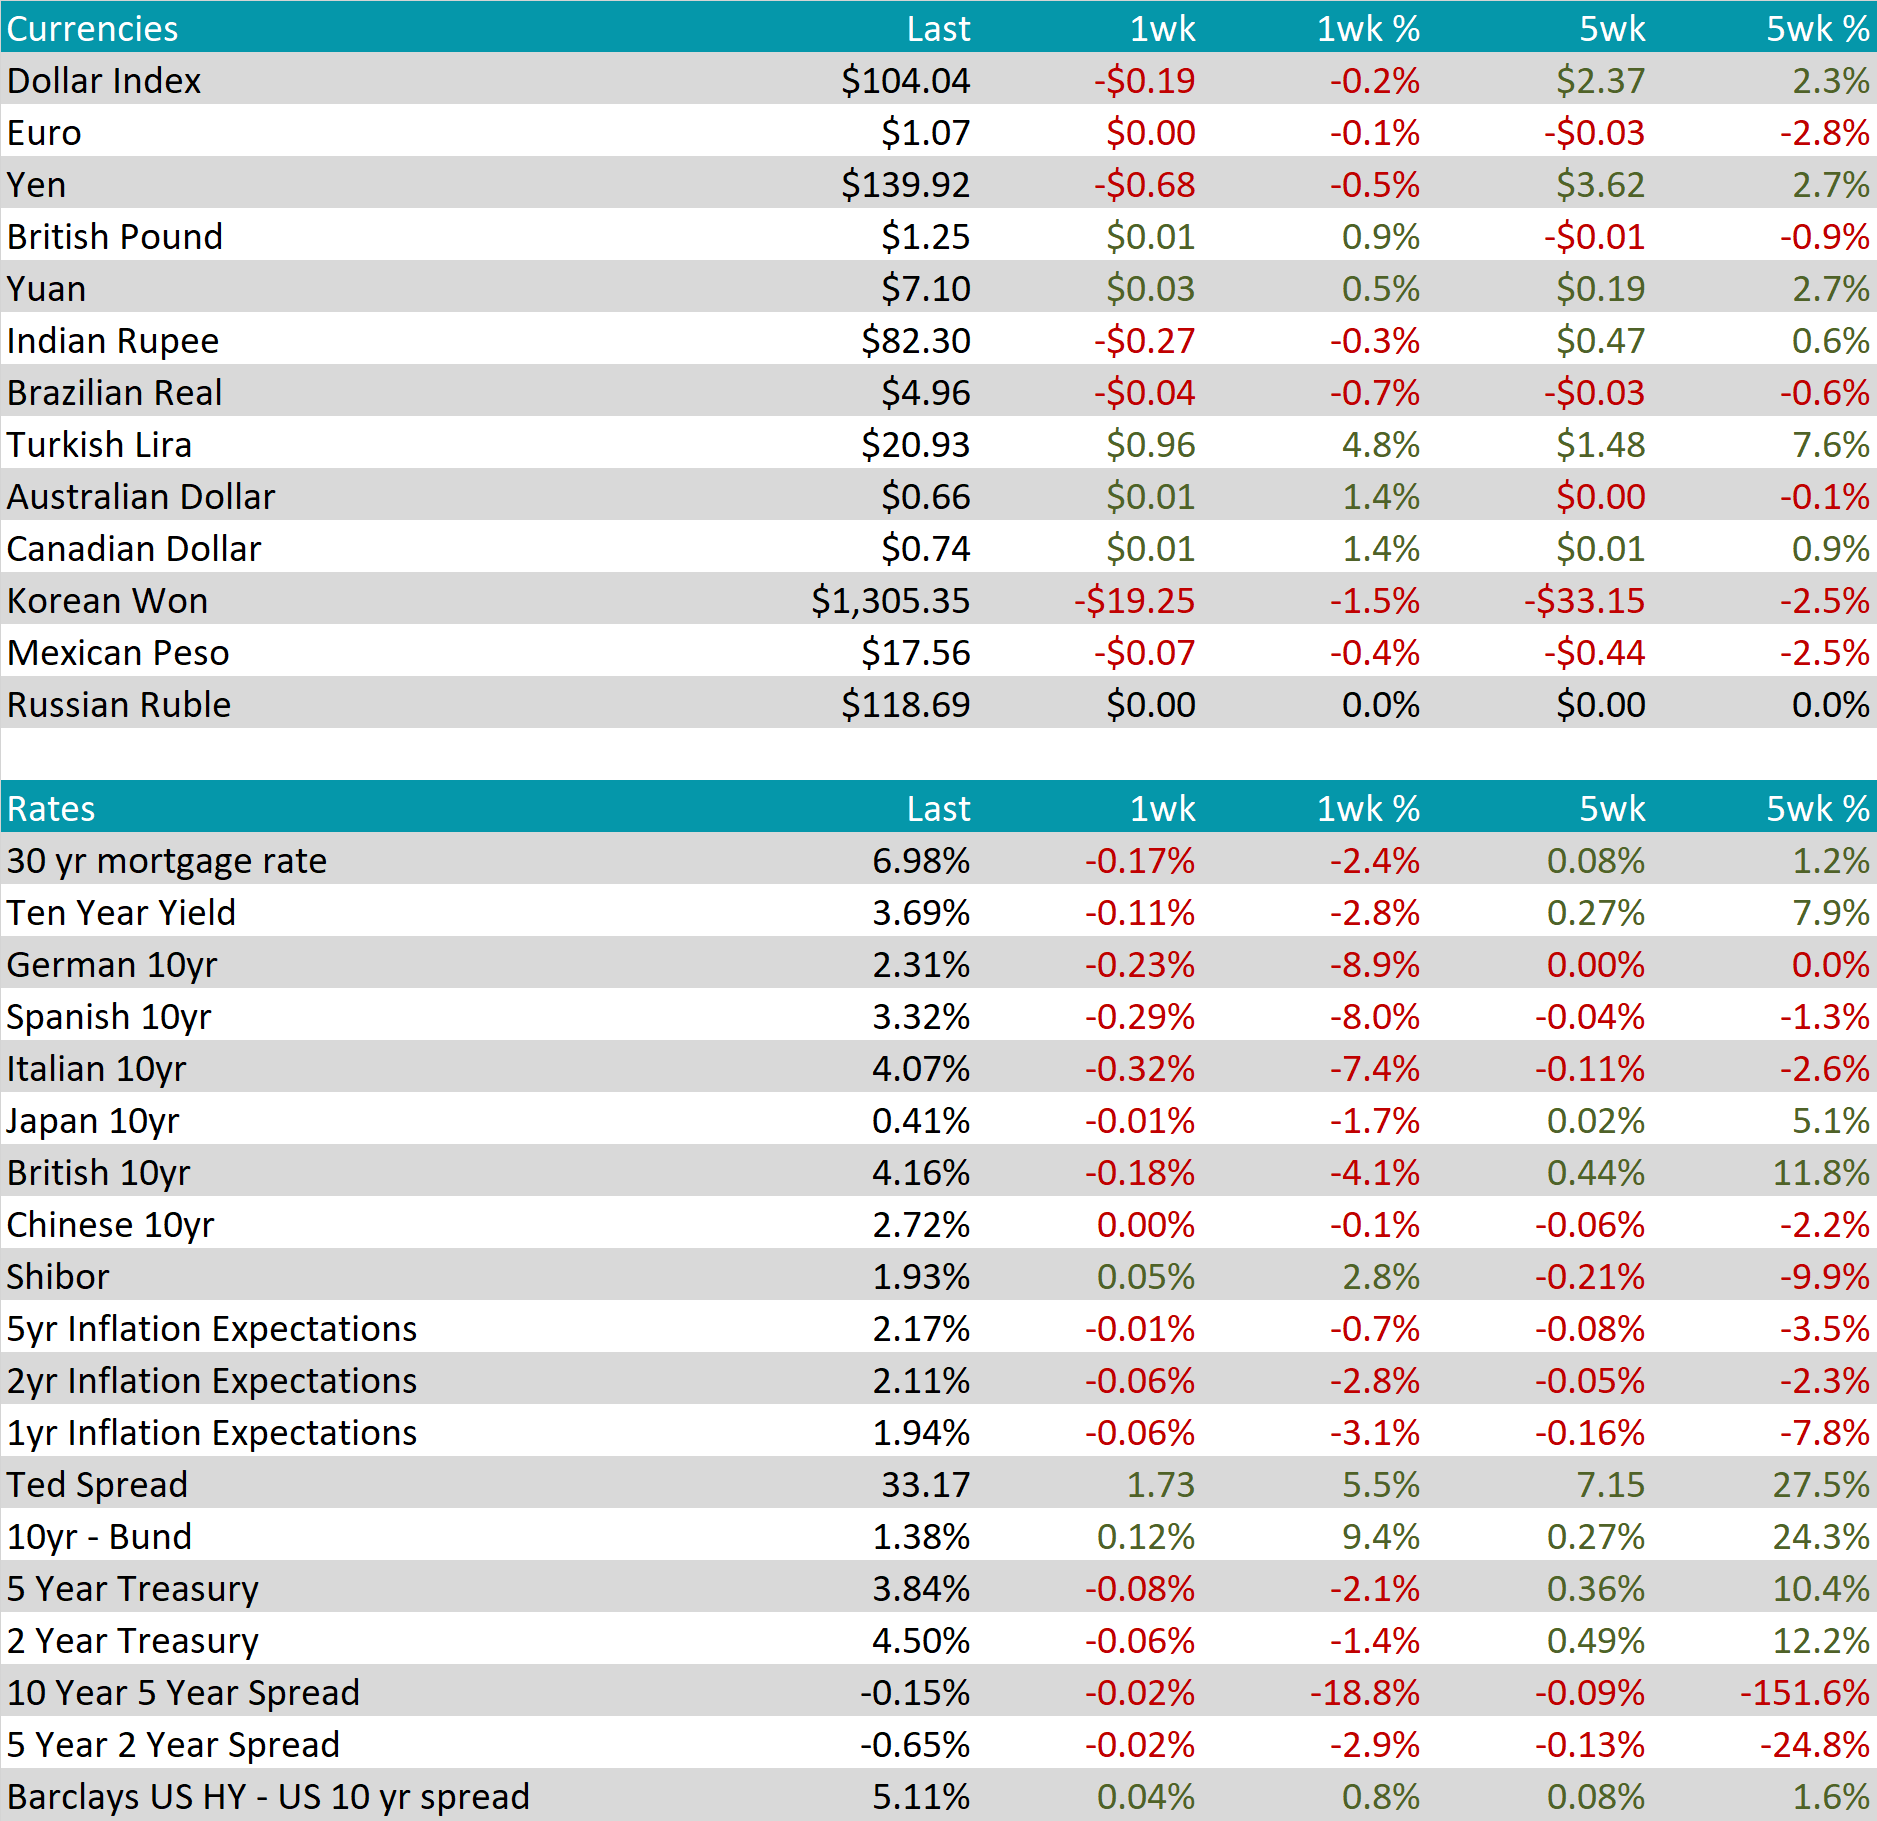
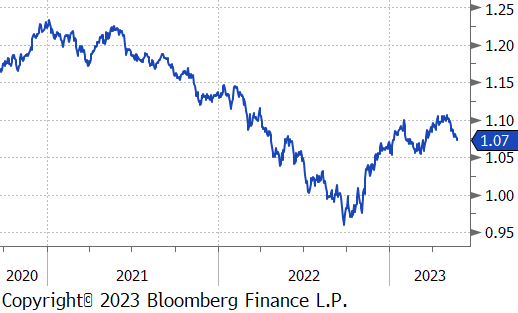
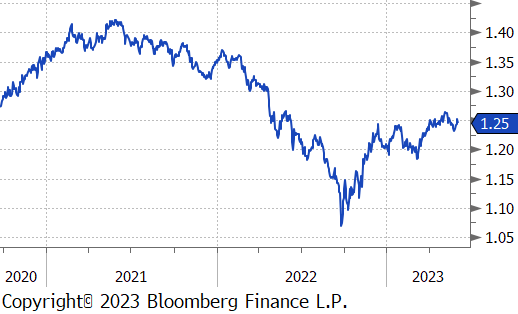
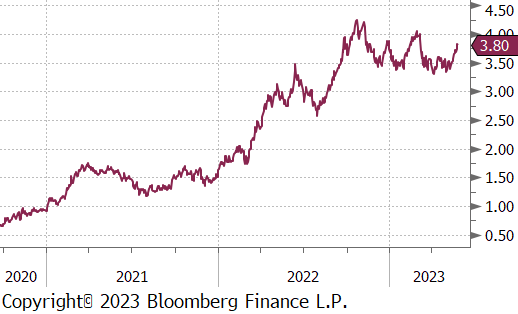
After several weeks of rising rates, markets have found some stability, trading flat on the week with he 10 Year Treasury yield holding near 3.7%. Once again, policy differences between the US FOMC and European Central Bank will likely be the primary driver for currency movements. The EURUSD currency cross remained flat on the week and has now returned to more “normal” levels, flat over the past week, and flat over the past year. The resilience of the US economy has been questioned with weakening PMI data in the services sector. Despite the general strength in the US dollar against the British pound and the euro, the USD has weakened significantly against the Aussie Dollar.
Traders are pricing in an 80% probability that the FOMC keeps their target rate at 5.00-5.25% at their June 14th meeting, with a 20% probability of a hike. However, the market is pricing in over a 50% probability of raising the target rate to 5.25-5.50% in July.
From current levels, traders are pricing in the first cut in January 2024.
Current rates are now consistent with the FOMC dot plot projections at the end of March 2023.
