Flack Capital Markets | Ferrous Financial Insider
June 23, 2023 – Issue #385
June 23, 2023 – Issue #385
***NOTE***
There will be no FFI report for the week of 6.30.2023 due to the holiday. The next published report will be dated 7.7.2023
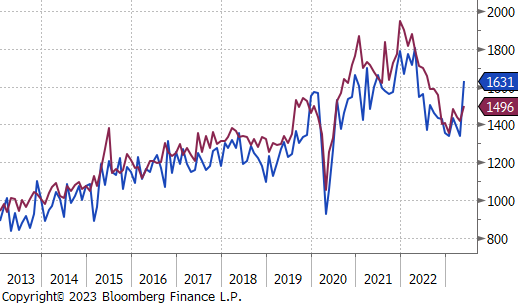
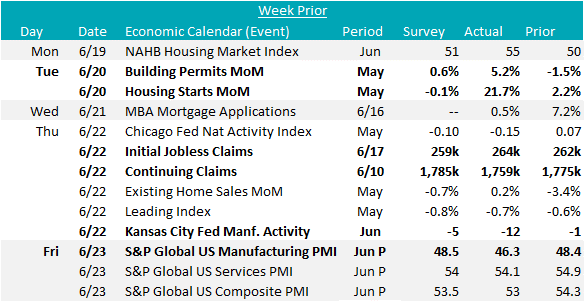
One of the most surprising developments in the 2023 U.S. economy has been the resilience in the residential construction. As one of the most sensitive to interest rates, we viewed this industry as the canary in the coal mine for the rest of the economy, when the FED hiking cycle began. Both building permits and housing starts peaked prior to the first interest rate hike and had a sharp and immediate reaction lower as the cycle continued into the beginning of the year. However, both found support just above the 1.3M level and permits have been grinding higher since January. In the release of the most recent (May) data, Housing starts were shockingly strong, up 21.7% versus expectations of a slight 0.1% decrease. Permits were better than expectations as well, up 5.2% versus the expectation of a 0.6% increase. The key takeaway from this data is that underlying demand for housing remains intact. The shock from interest rates were a strong headwind, but U.S. demographics and the reluctance to build following the GFC have caused a structural shortage. Without a meaningful shock higher in interest rates, we anticipate volatility in the monthly figures going forward, but a mostly stabile, potential for upward overall trend.
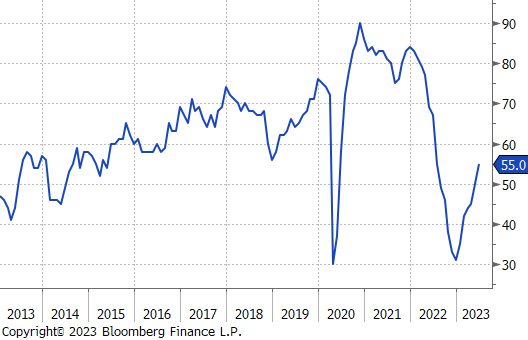
This optimistic perspective is starting to be shared by homebuilders as well, with the NAHB homebuilder sentiment survey clearly trending higher, up for 6 straight months and at its highest level in the last 11.
Taking a step back, it would be a mistake to take the very distinct housing market dynamics and extrapolate these positive trends onto other steel consuming sectors. The point of this analysis, however, is to highlight the fact that the most sensitive sector to interest rates is significantly outperforming expectations. This means that simply anticipating a collapse in the broader economy only because the terminal fed funds rate is at its highest level in the last 16 years would be a mistake. There are underlying dynamics in each sector that must be closely watched.
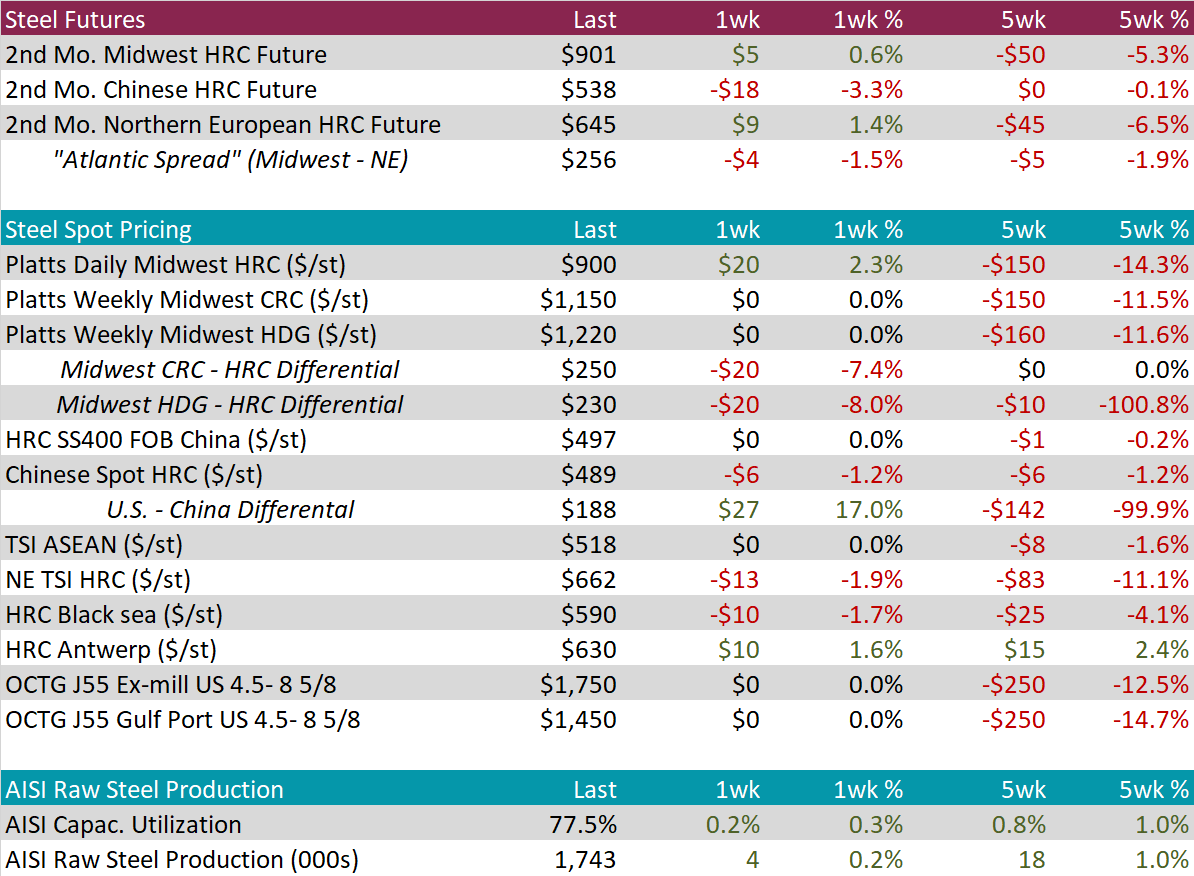
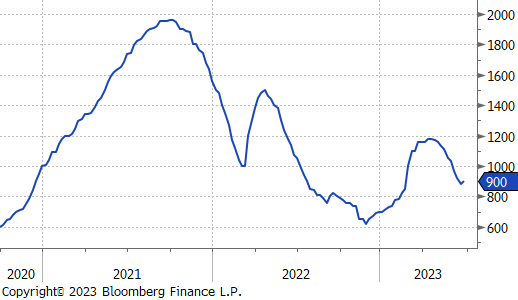
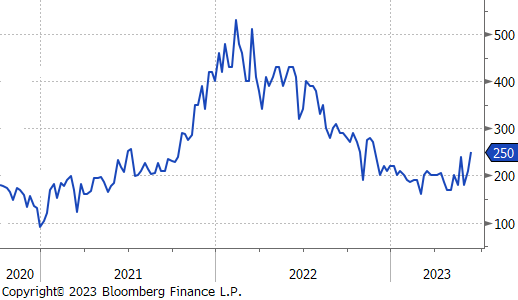
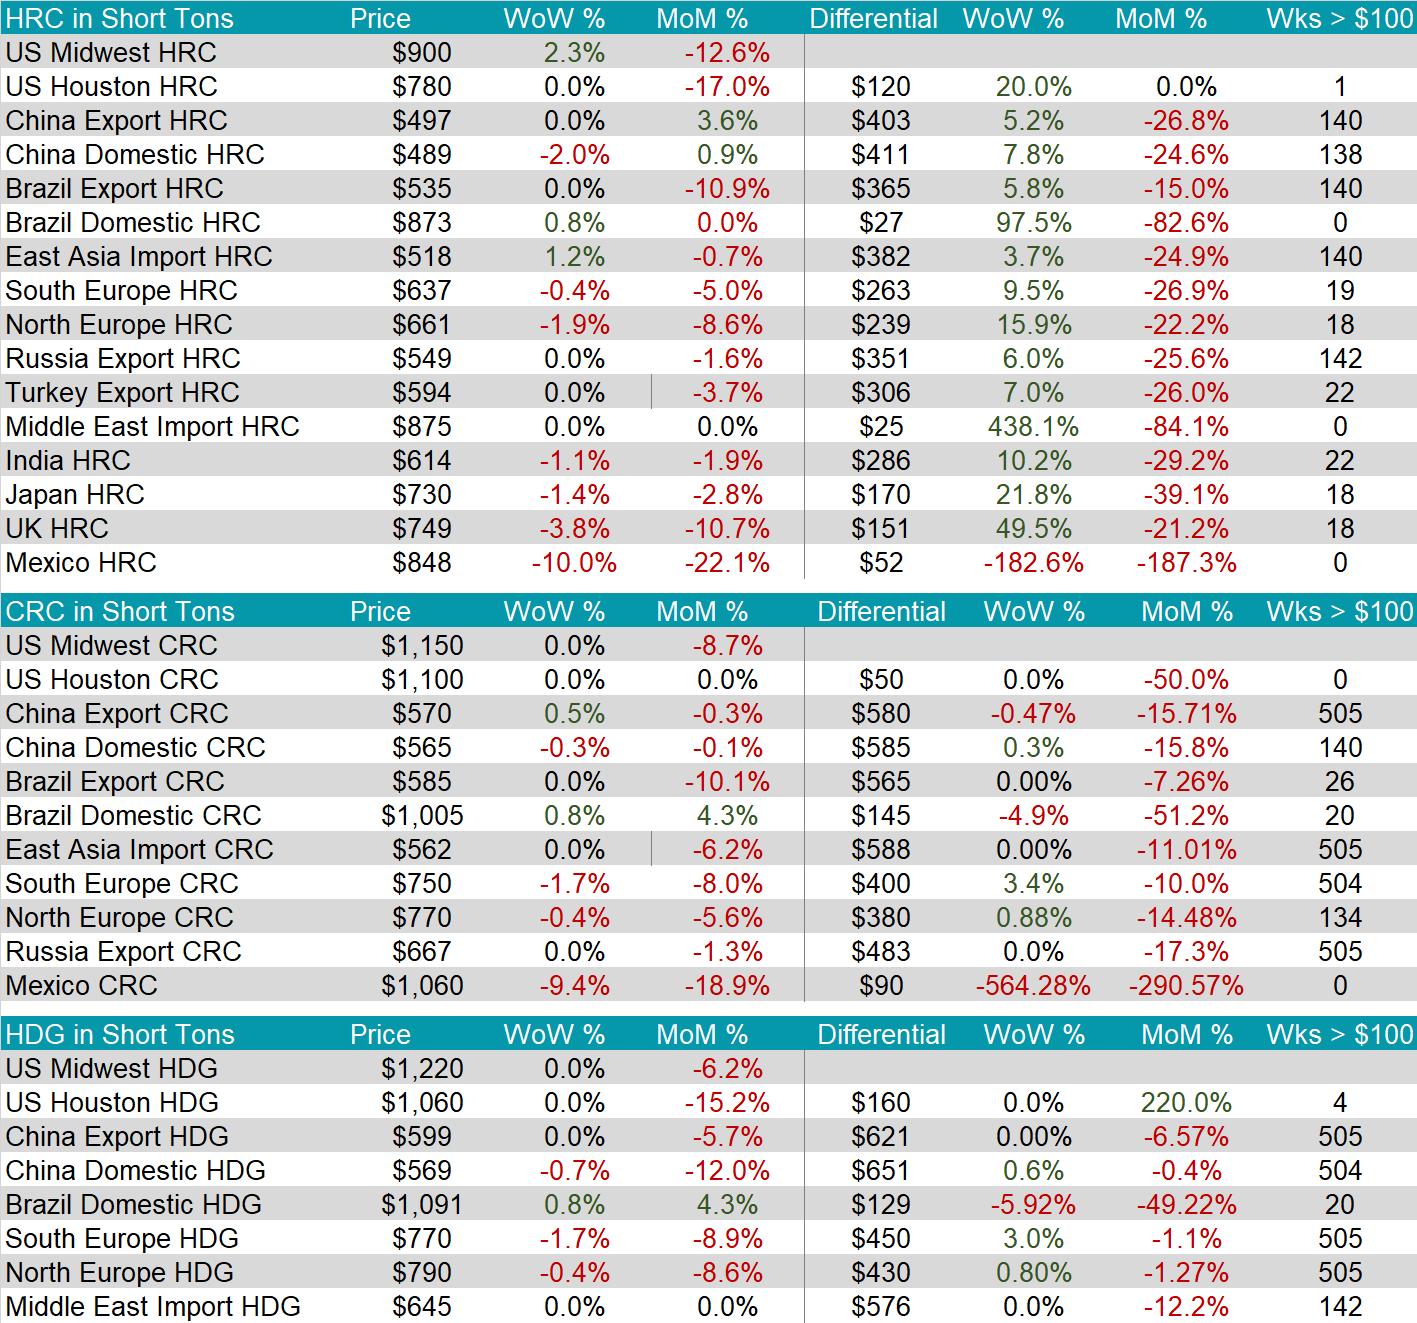
The HRC spot price was up for the first time in 11-weeks on the heels of a flurry of price increase announcements. The 2nd–month future (July) was up $5, or 0.6%, as well, but much of the remarked upon rally in the futures came from later expirations. The August expiration, has rallied $129 over the past 5 weeks.
Tandem products were unchanged this week, putting pressure on the HDG-HRC spread. It is still elevated at $230 but off the recent high.
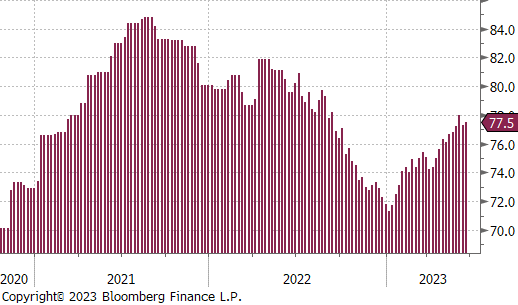
Mill production was up 0.2% this week, now up to 77.5%
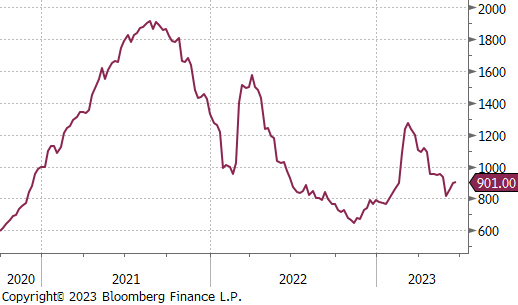
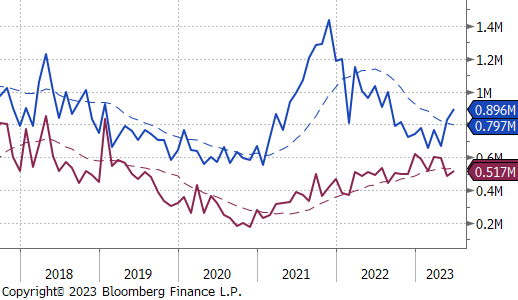
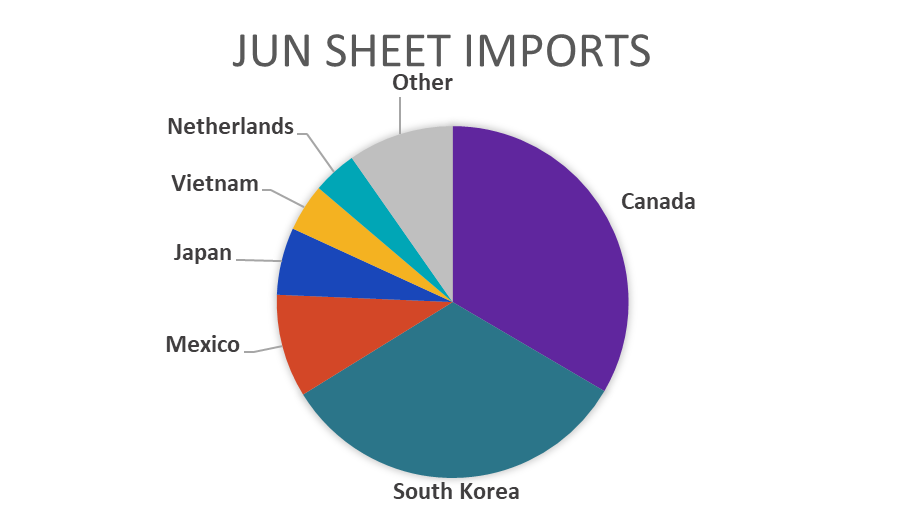
June Projection – Sheet 896k (up 6k MoM); Tube 517k (up 24k MoM)
May Projection – Sheet 836k (up 190k MoM); Tube 484k (down 146k MoM)
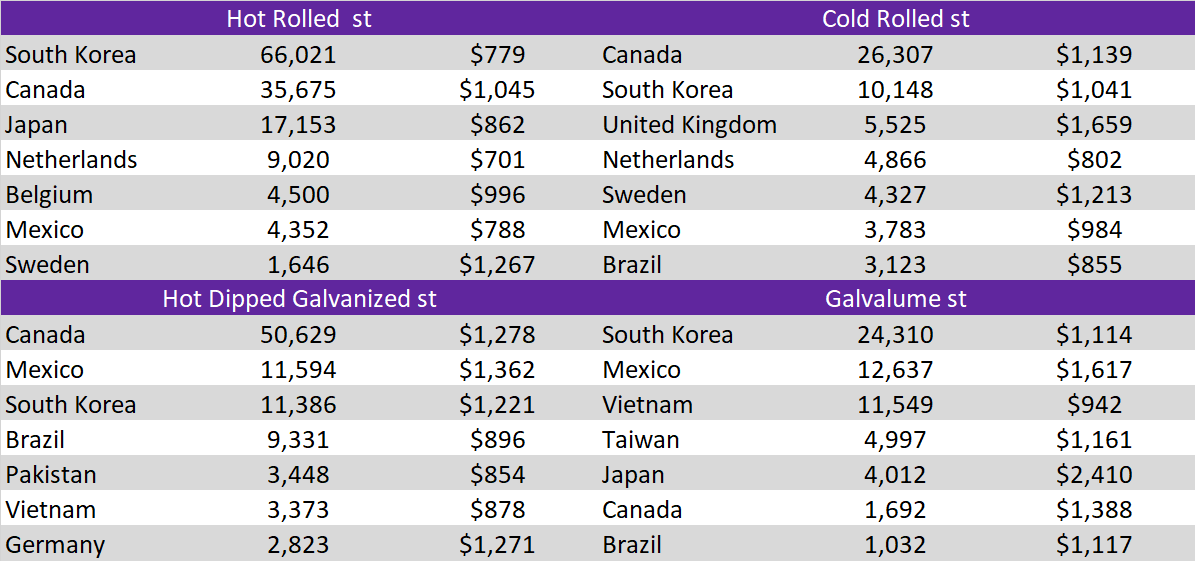
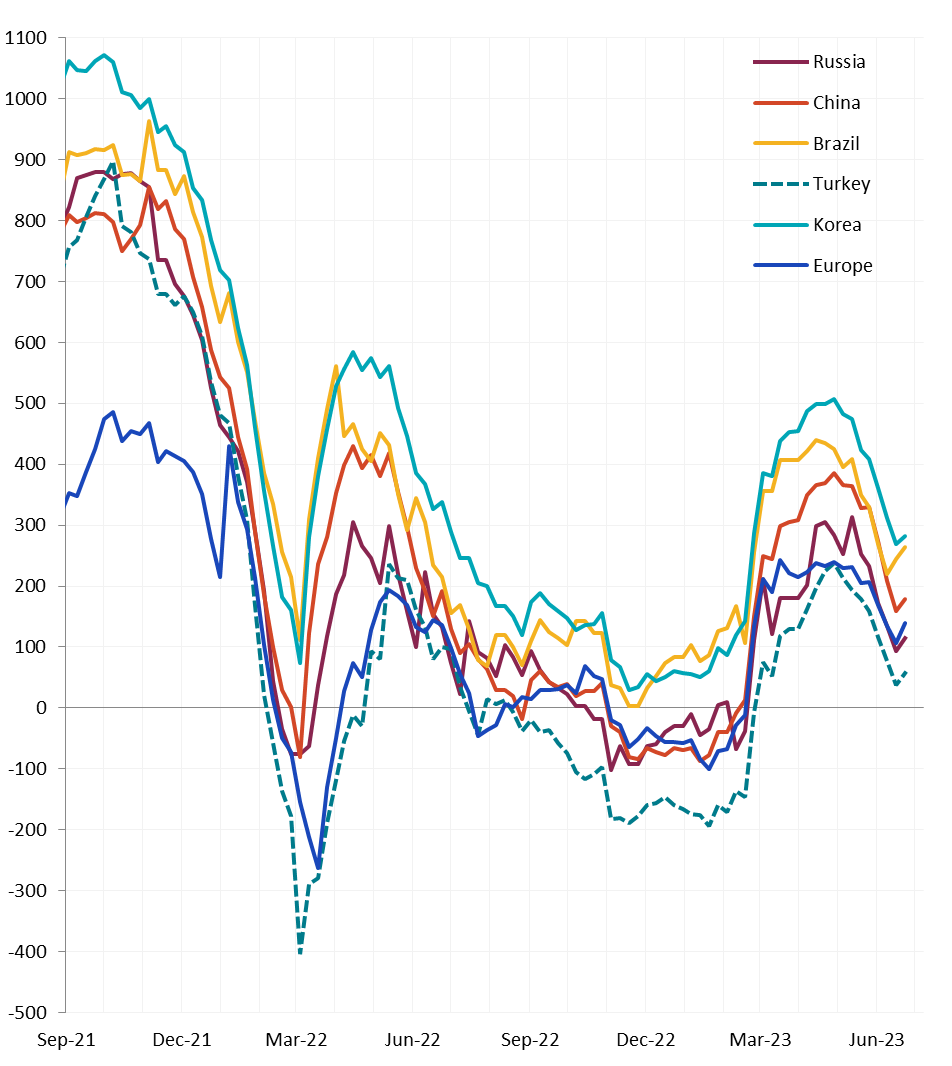
Global differentials increased this week, as well. This driver was the U.S. spot price with the rest of the world mostly unchanged. Underneath the hood, however, prices out of Asia are on a 3-week uptrend.
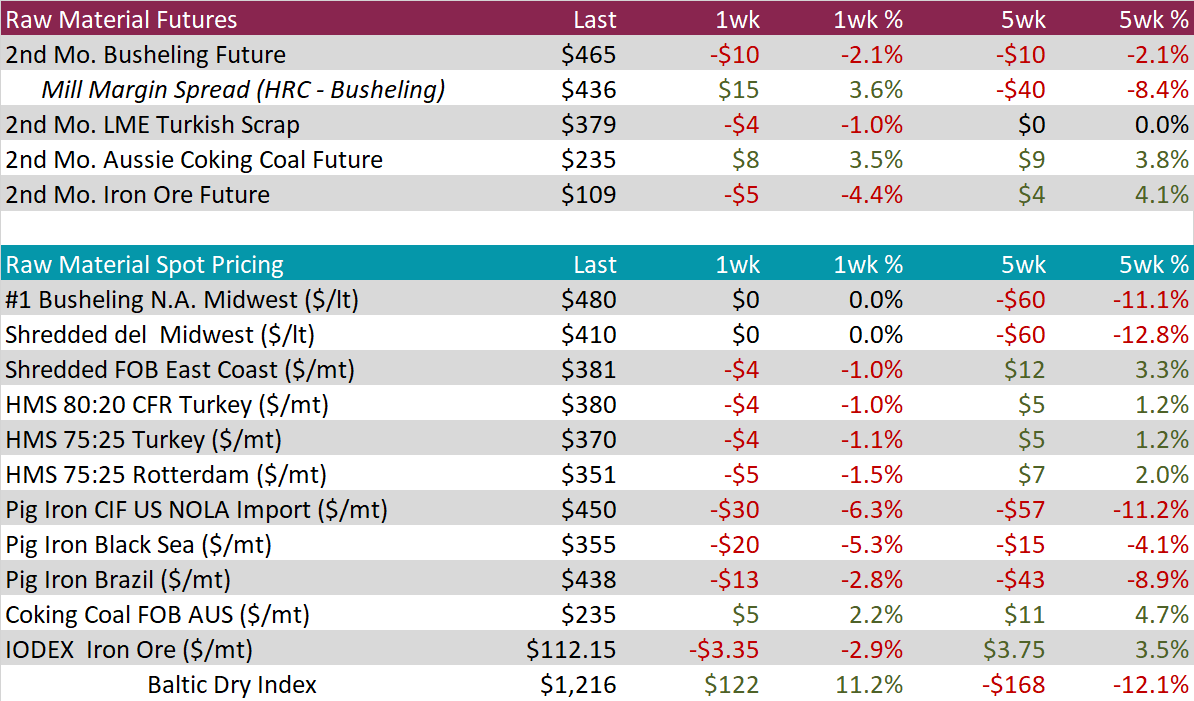
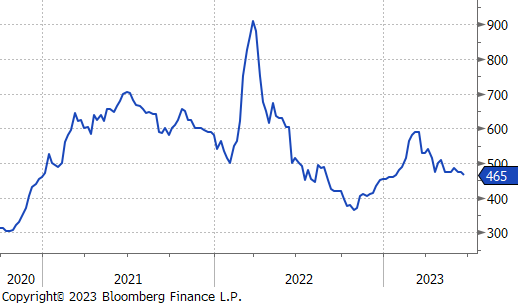
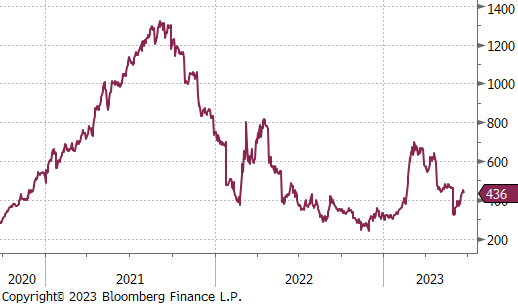
The 2nd month (August) busheling future was down $10, or 2.1%, while the July settlement is just over 2 weeks away. The higher HRC and lower busheling drove the mill margin spread up another $15.
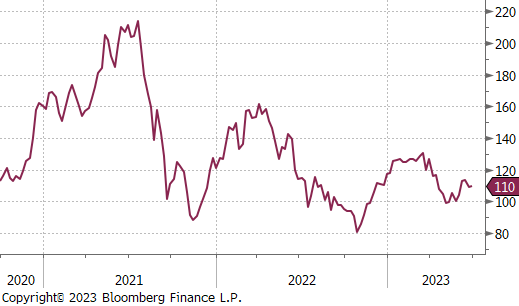
The 2nd month iron ore future ran out of steam and rolled over, down $5 or 4.4% on the week. News out of China continues to suggest that demand is waning.
Dry Bulk / Freight
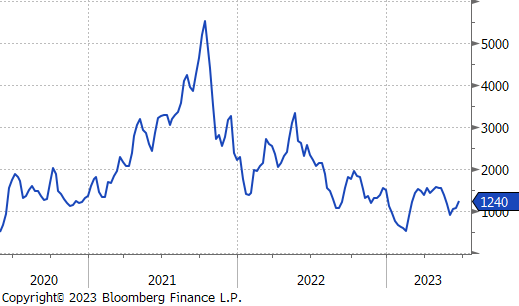
The Baltic dry index was up for the second week in a row, this time by 11.2%.
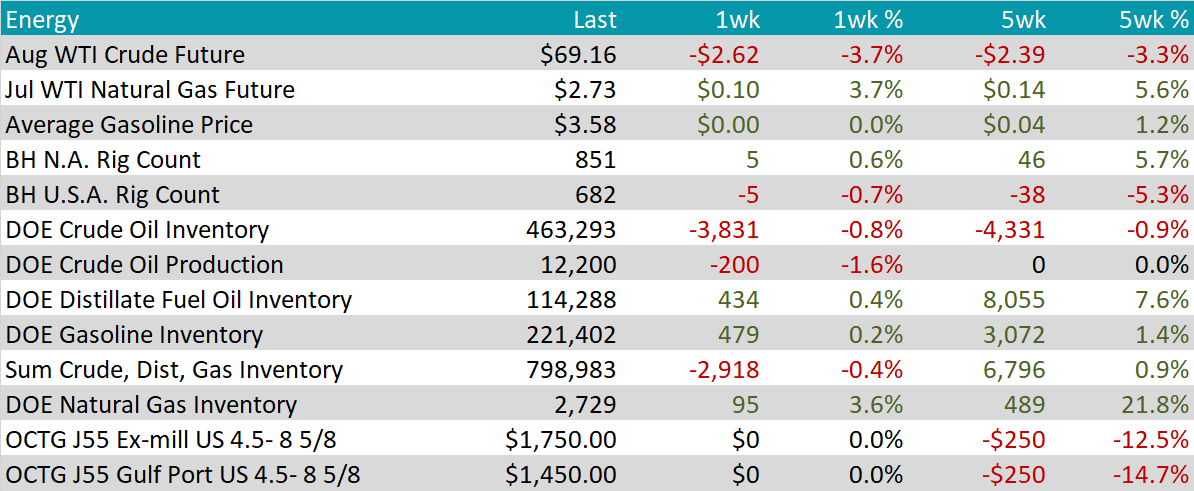
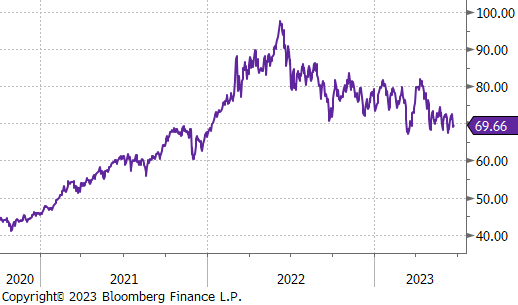
WTI crude oil future gained $13.15 or 16.5% to $92.64/bbl.
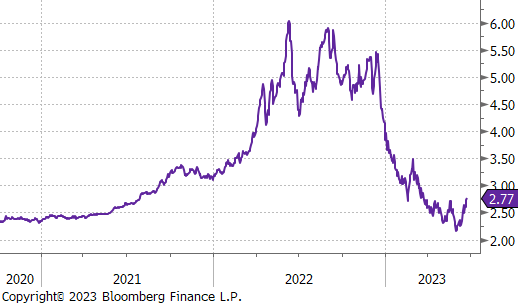
WTI natural gas future lost another $0.02 or 0.3% to $6.75/bbl.
The aggregate inventory level was down 0.4%, reversing the recent uptrend.
The Baker Hughes North American rig count was up 5 rigs while the U.S. rig count was down 5 rigs.
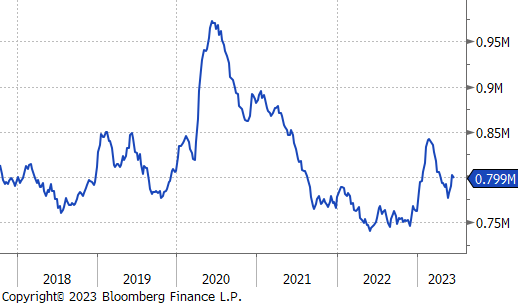
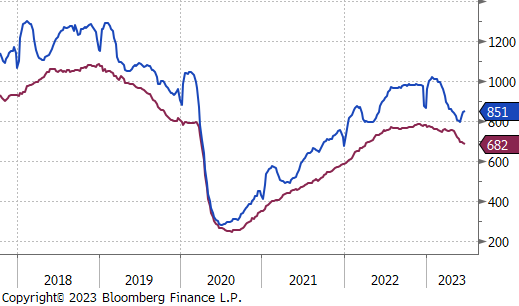
Aluminum prices fell the most in 18 weeks as European factory output gauges plunged, and Germany’s PMI slid for the 12th consecutive month of contraction. Furthermore, the market has recalibrated their expectations on rate hikes by the US Federal reserve which has supported the US Dollar, while market participants anticipate what China will do in the next few weeks regarding further stimulus measures.
Copper prices snapped a 3-week winning streak, falling by 2.1% on both LME and CME. The drop in prices comes despite inventories in warehouses tracked by the LME dropping to the lowest levels since October 2021 and net bullish bets by money managers reaching the most bullish in 20 weeks.
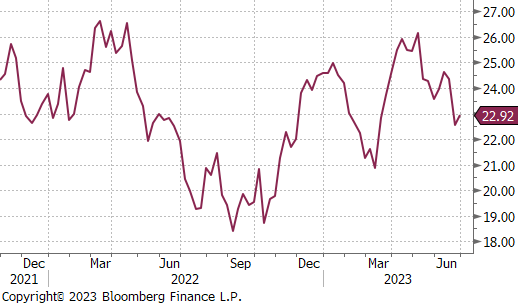
Silver futures plunged 7.4%, recording the second consecutive week of losses and slipping under $23 per ounce for the first time since March. Precious metals were hampered by the likelihood of more interest rate hikes by the US federal reserve, as higher interest rates diminish the appeal of non-yielding assets like silver and gold. Hedge funds cut net bullish bets to a 3-week low.

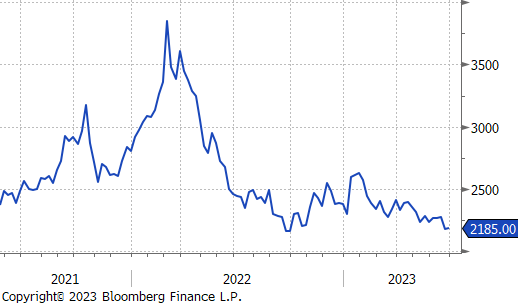
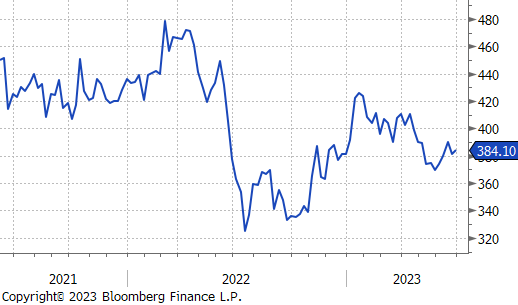
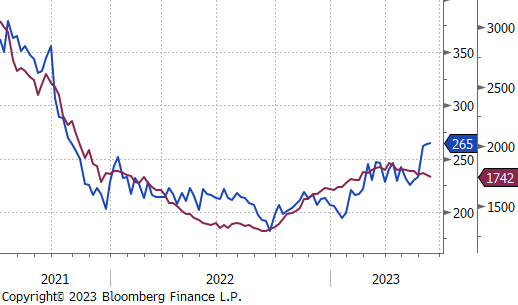
The divergence between initial and continuing jobless claims continued this week, with initial claims slightly accelerating up to their highest level since October 2021, while continuing claims trended lower.
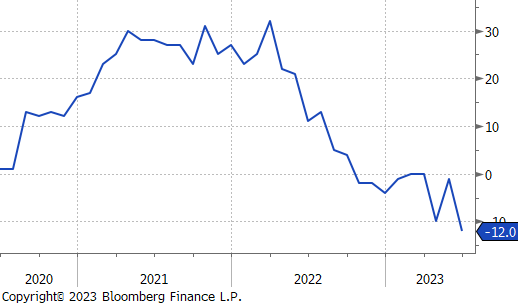
The Kansas City Fed Manufacturing Survey moved sharply lower, printing at -12, below expectations of -5. This is its lowest level since bottoming in May 2020 and points toward a deepening contraction within the manufacturing sector.
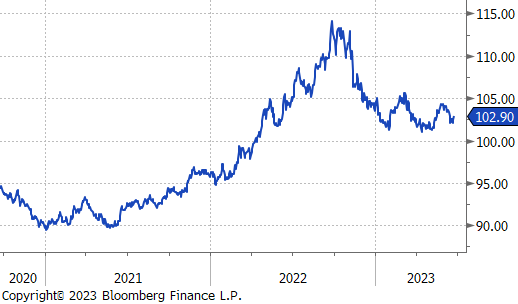
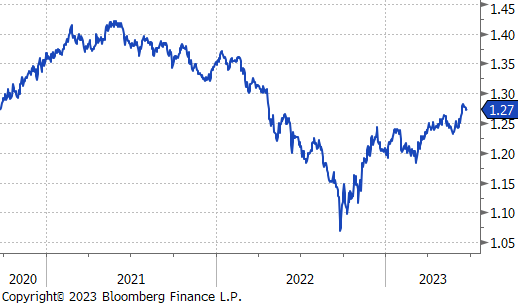
The US dollar index rebounded by about half a percent, fueled by aggressive monetary tightening and hawkish messaging from major central banks, increasing safe-haven demand for the dollar. Fed Chair Jerome Powell expects further rate increases, while European central banks surprised with larger-than-expected rate hikes. U.K. policymakers implemented their 13th consecutive rate hike, showing their commitment to further tightening measures due to stubbornly high inflation. Investors anticipate a peak interest rate of 6.1% by February 2024, causing Sterling to decline to $1.27 from a 14-month high. The Japanese yen depreciated past 143 per dollar for the first time in over seven months. Currency diplomat Masato Kanda warned that the government is considering market intervention, as the yen’s depreciation against the dollar is rapid and one-sided, posing risks to the economy.
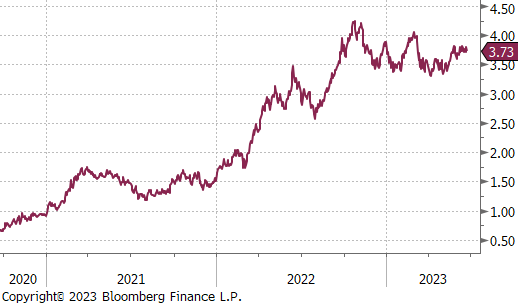
There was very little change in the U.S. 10yr treasury yield, down 3 bps and just below recent highs in May, at 3.73%.
