Flack Capital Markets | Ferrous Financial Insider
June 9, 2023 – Issue #383
June 9, 2023 – Issue #383
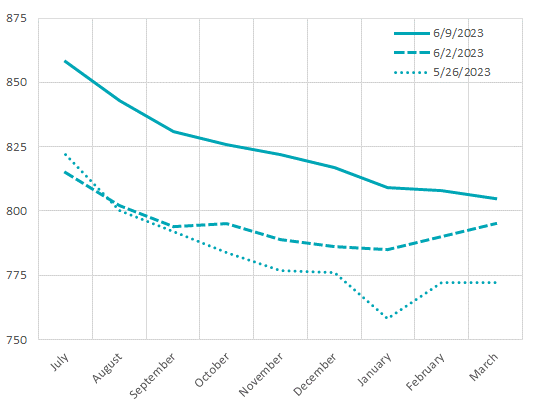
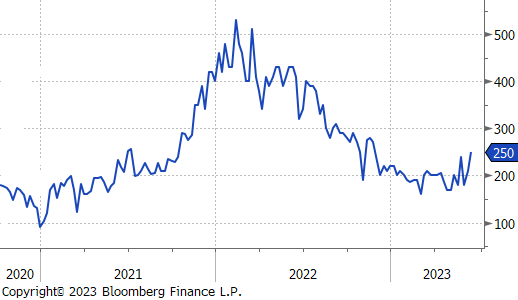
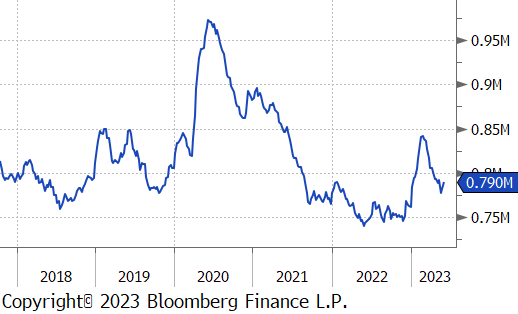
Since mid-April, 4Q23 & 1Q24 were stuck in a tight trading range, right around $800. Over the last couple of weeks, however, there has been a noticeable shift as spot prices have continued their decline and converged with the forward curve. Through our analysis, we’ve found a strong relationship, in terms of direction between the forward curve and the spot market, with the futures leading spot prices by about 1 month. Taken at face value, this would suggest that the recent increased pace of falling steel prices has brought us closer to the bottom. This is even more clear given what has transpired in the current week (i.e., sharp increases across the curve and 2 mill price increase announcements).
However, whether this means a respite or an impending rally in the spot market is to be determined. There are two opposing, tectonic forces that will have to be resolved. First, profitability levels at the mills are historically elevated, while they have come off recent highs, there is still a meaningful existing cushion which is typically squeezed before we see mills take meaningful action. On the opposite side of that, inventories across the supply chain are flashing red, and are currently below the levels which we believe had a large part in causing the 1Q23 rally.
It will take time to see which of the two wins out over the longer-term, but the price action over recent weeks should be added to a long list of cautionary tails for trying to time the bottom. Unfortunately, for those who waited to hedge their 2024 material, $800 HRC is no longer on the table.
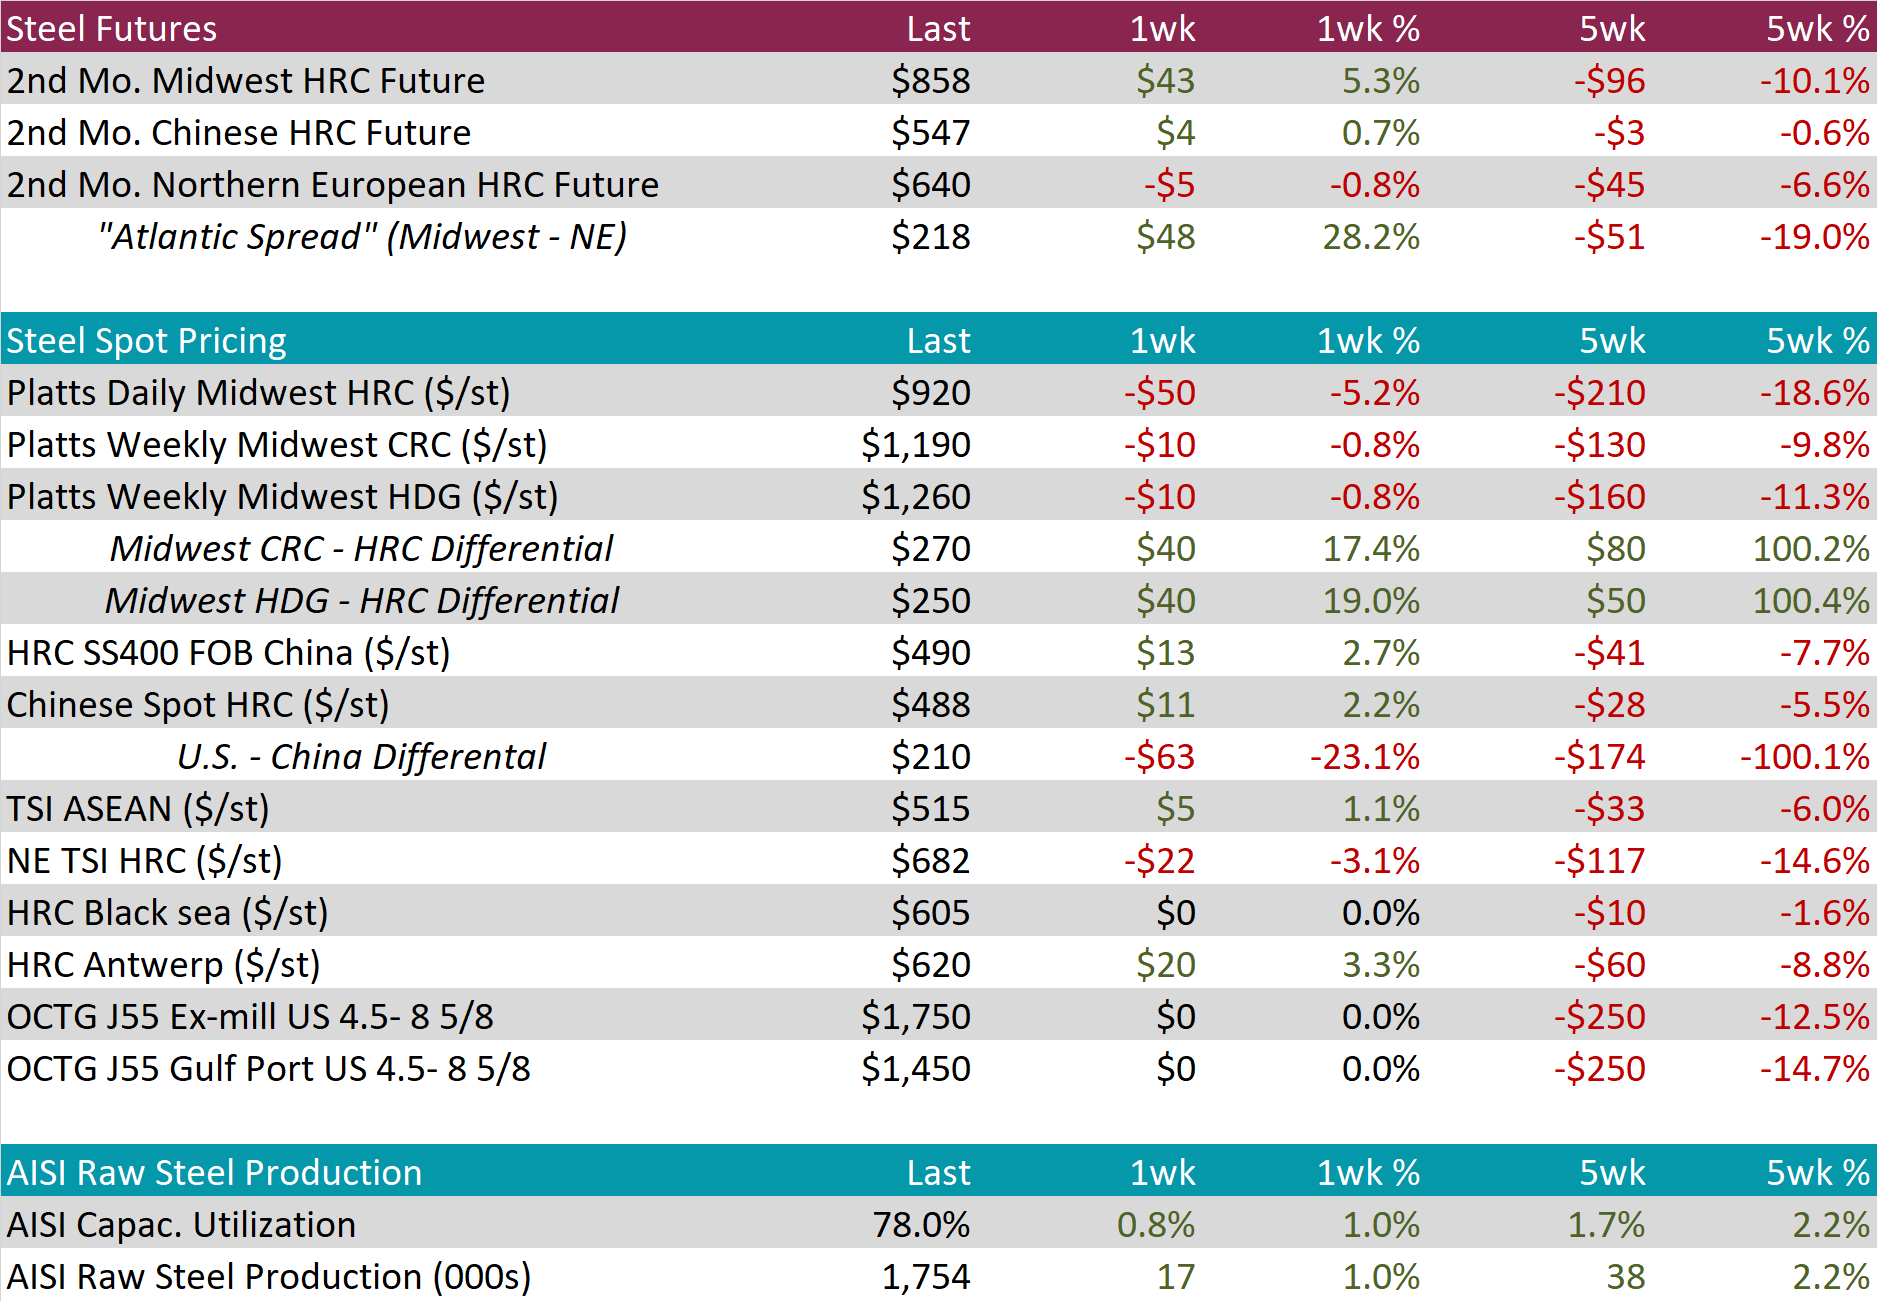
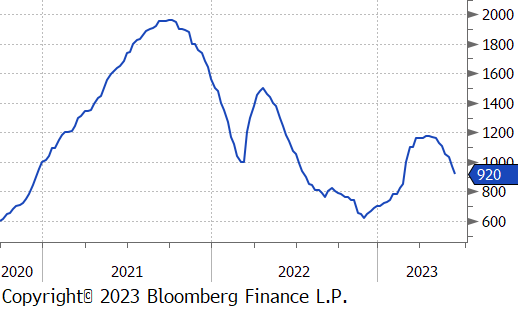
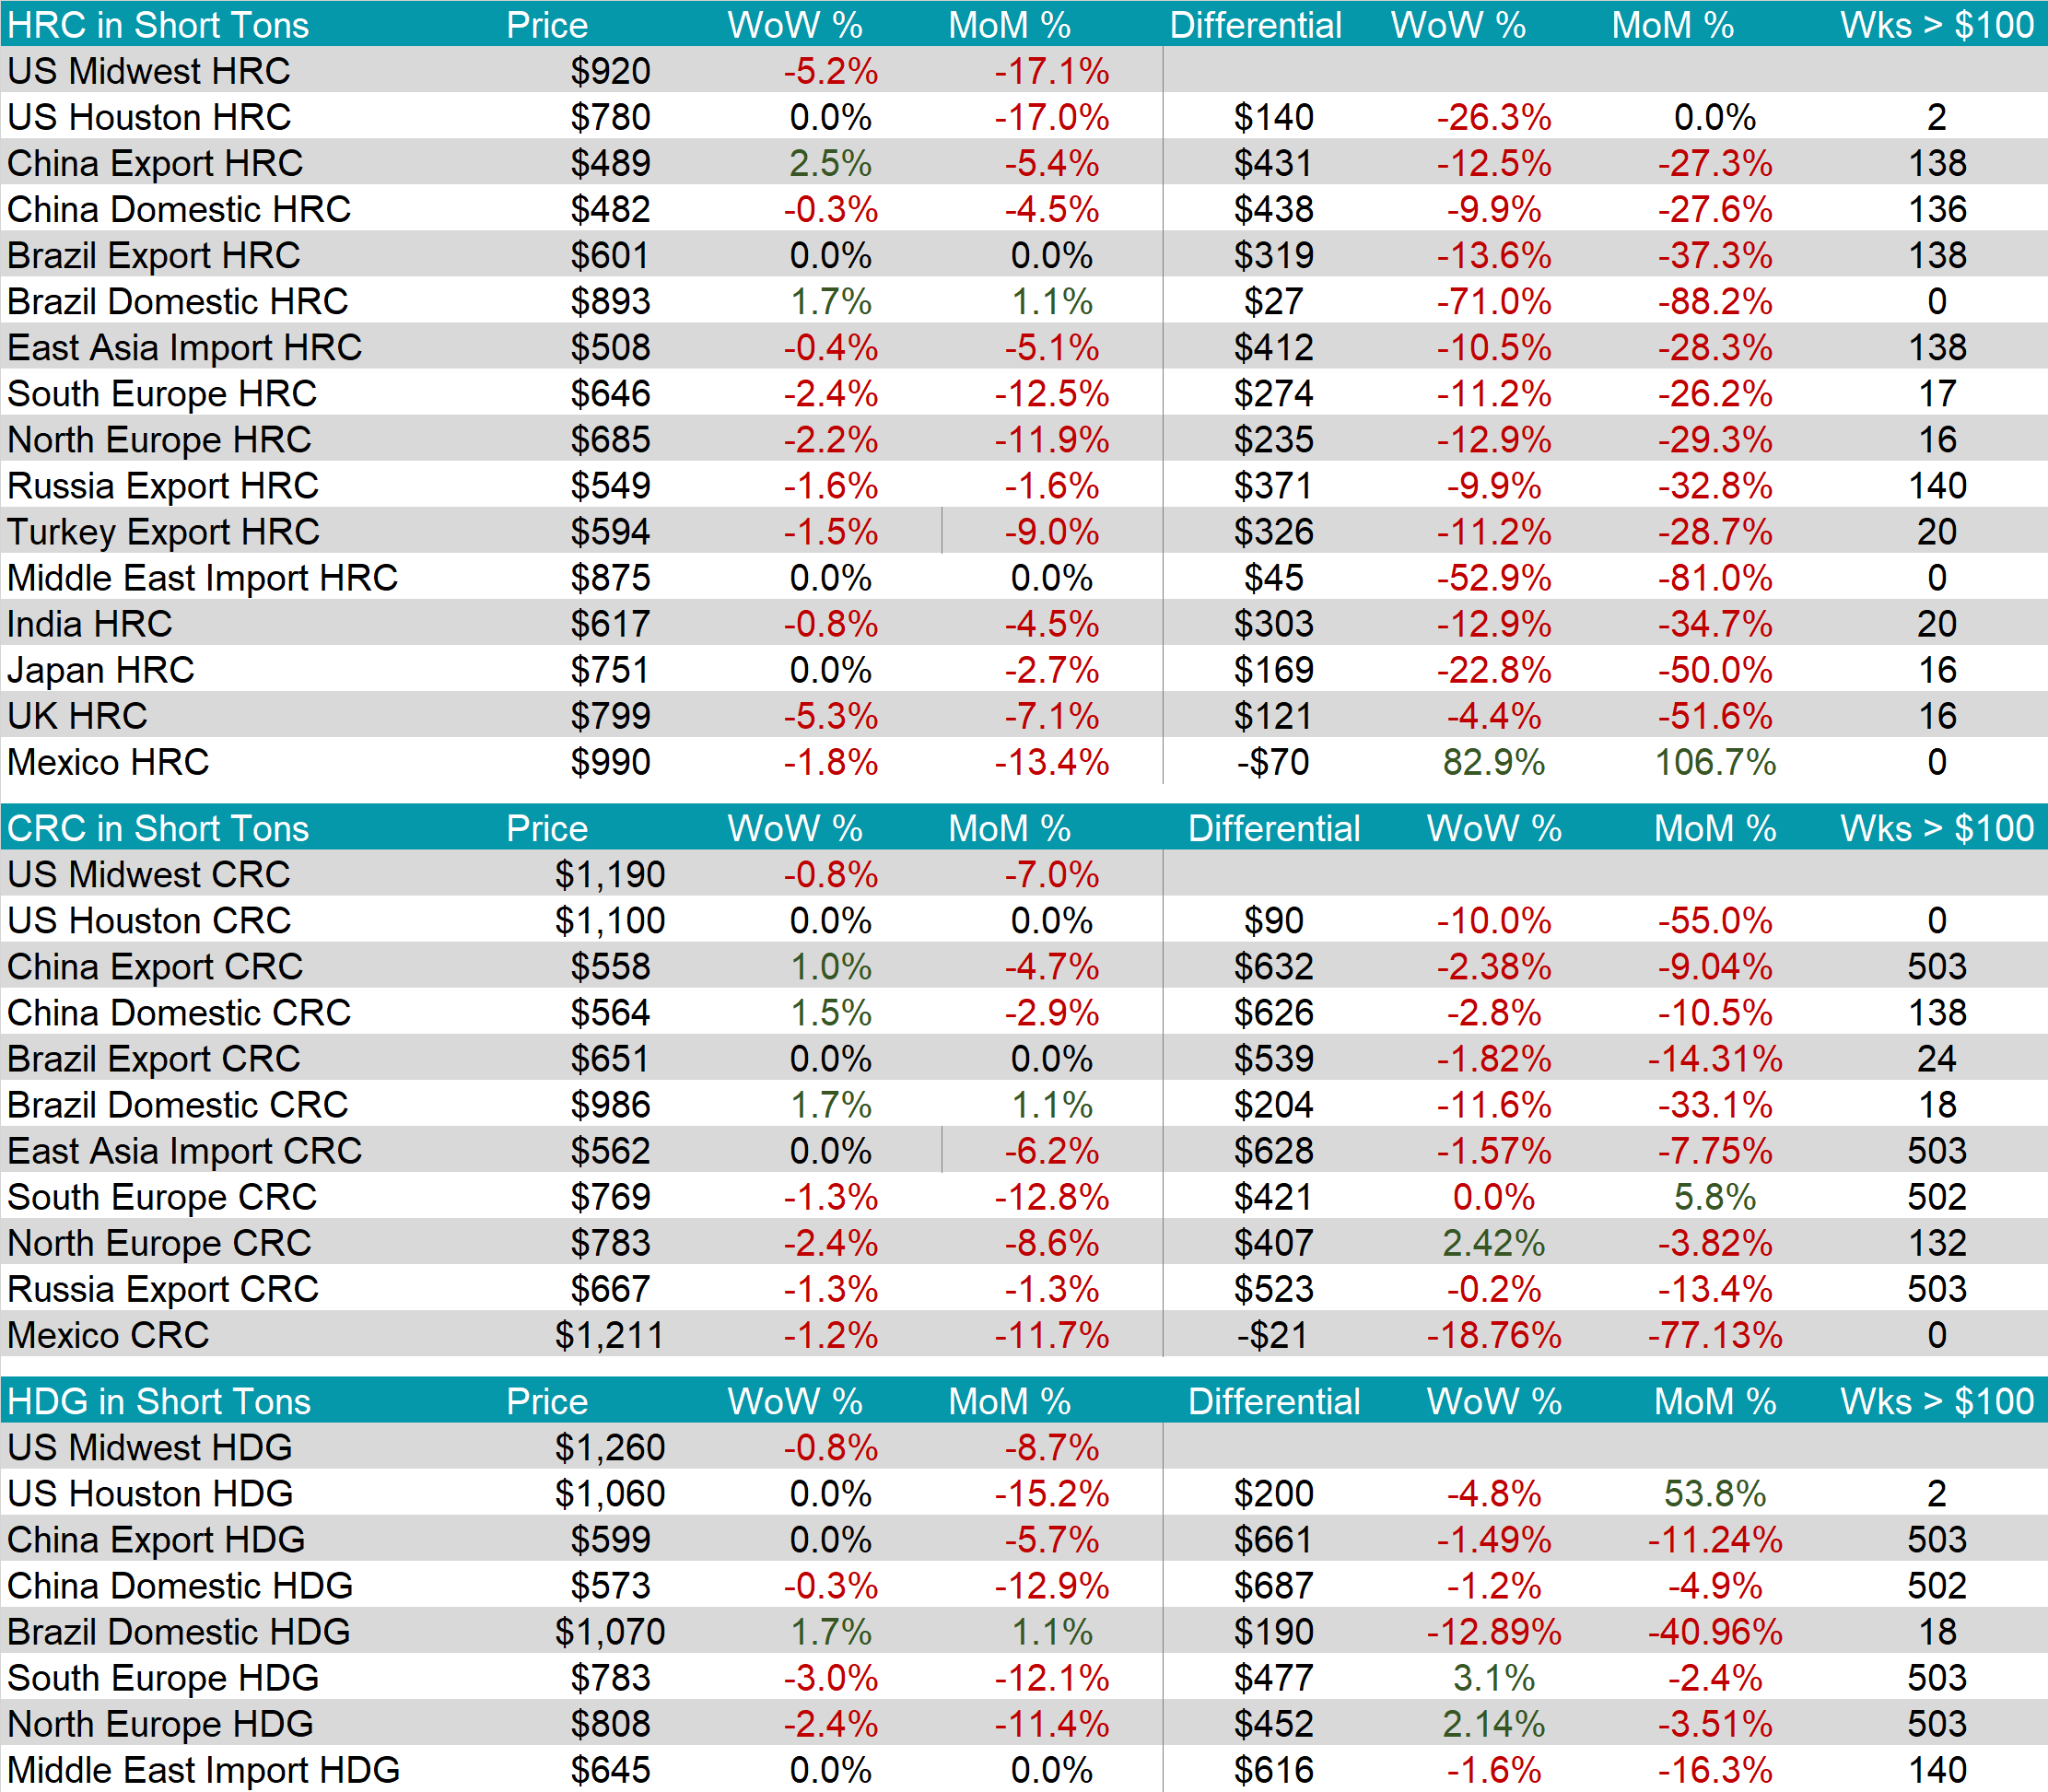
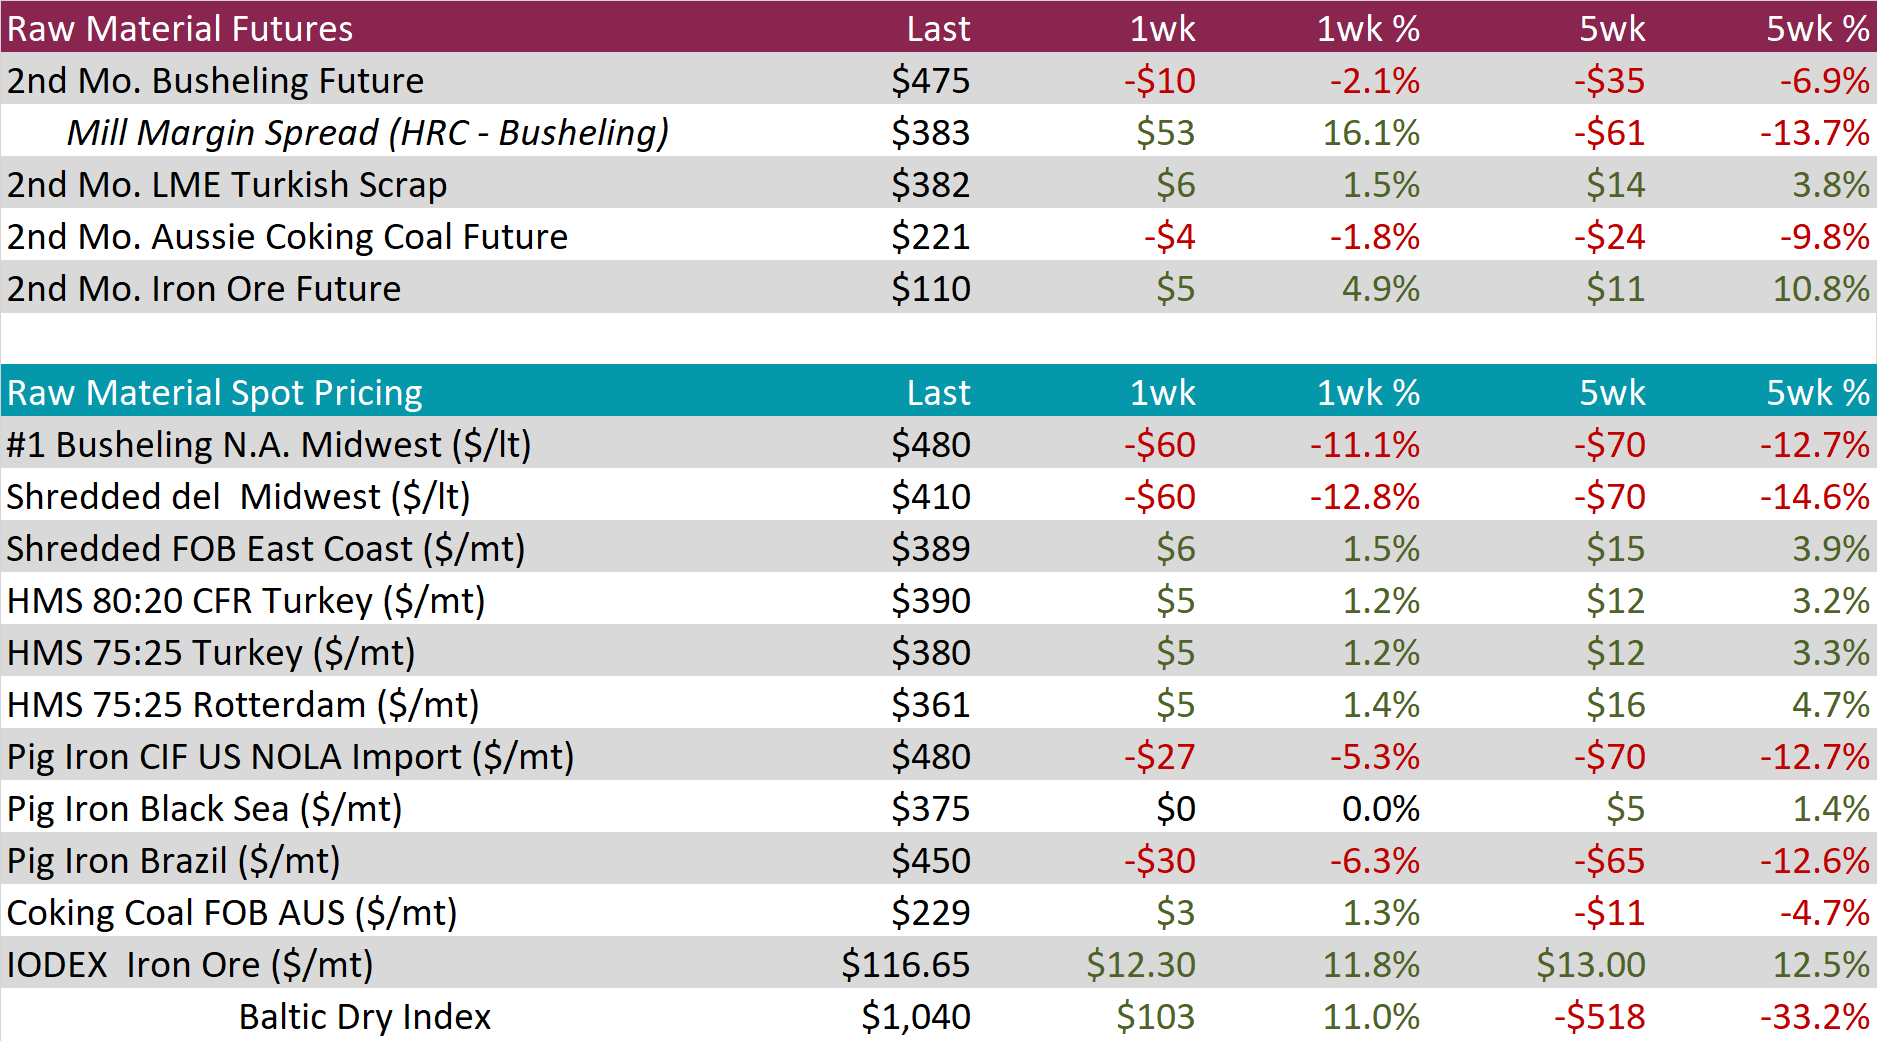
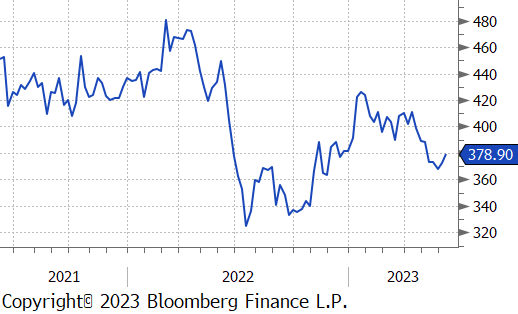
HRC spot prices fell sharply again this week, down another $50, or 5.3%. Over the last five weeks, the spot price is down $210, or 18.6%.
Tandem products have held up significantly better over the last couple of weeks. CRC and HDG were down only $10, this week, and $130, and $160, respectively over the last five weeks. This has caused the HDG-HRC differential to expand to $250, its highest level since mid-November. We do anticipate that these will converge as spot prices continue their decline.
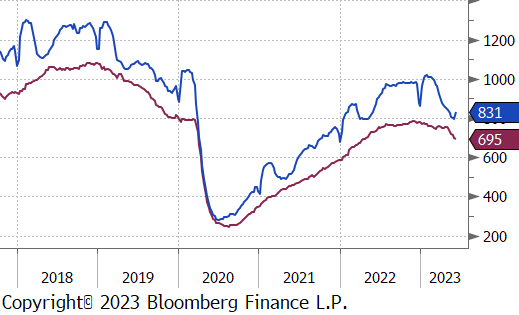
Domestic mill production continued to increase last week, up another 0.8% to 78%. This is the highest level of utilization since early-September.
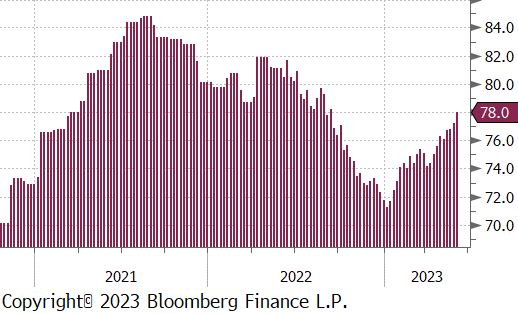
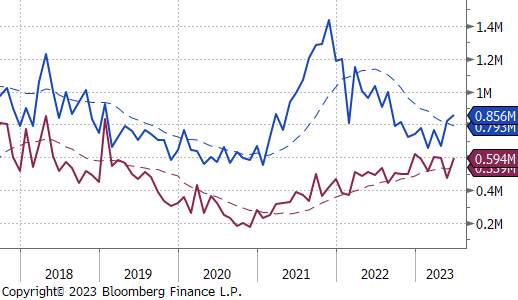
June Projection – Sheet 856k (up 34k MoM); Tube 594k (up 120k MoM)
May Projection – Sheet 822k (up 154k MoM); Tube 474k (down 123k MoM)
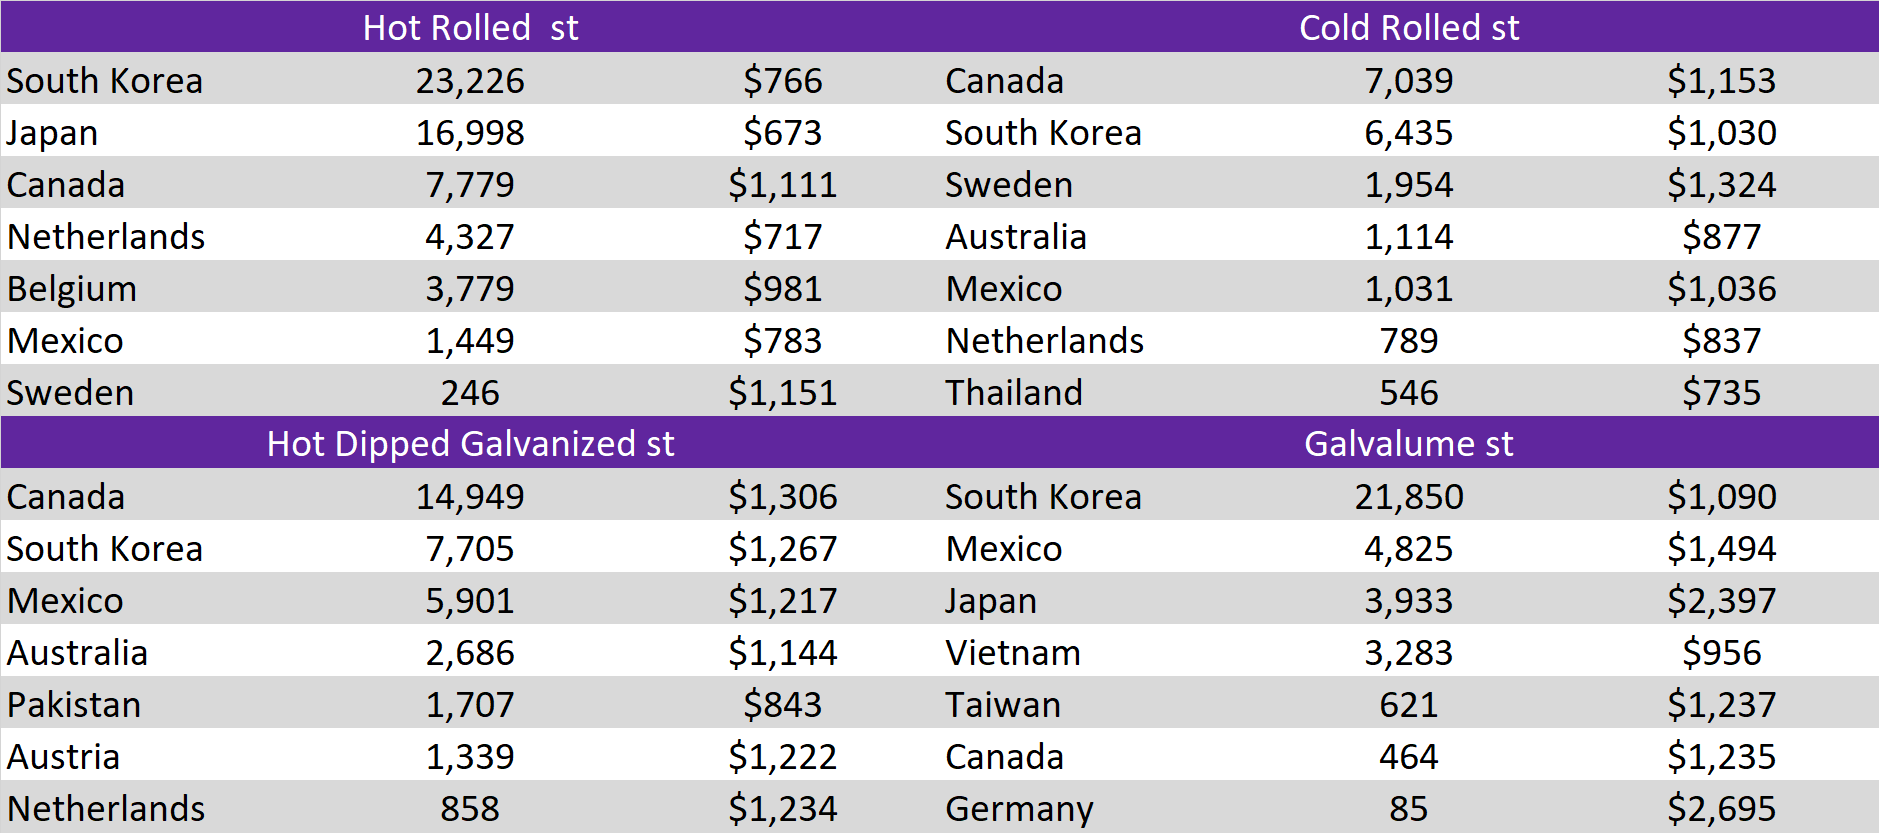
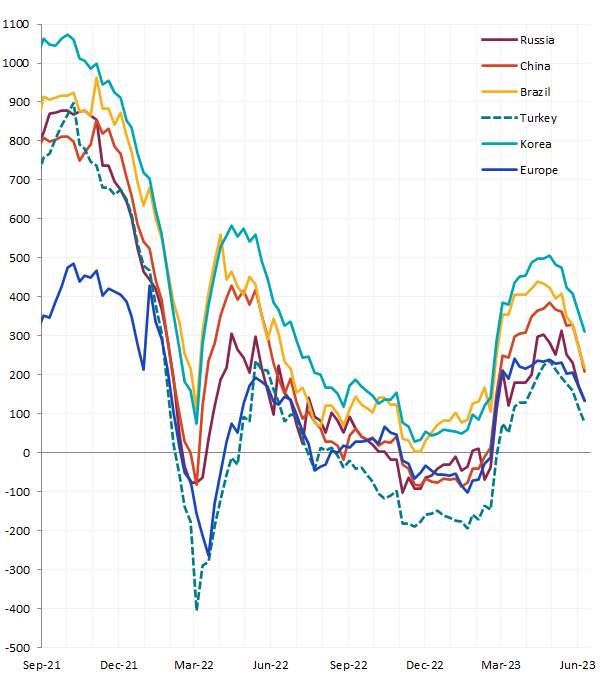
Each of the global differentials were sharply lower again this week, the window to capture the spread between imported and domestic material has rapidly closed.
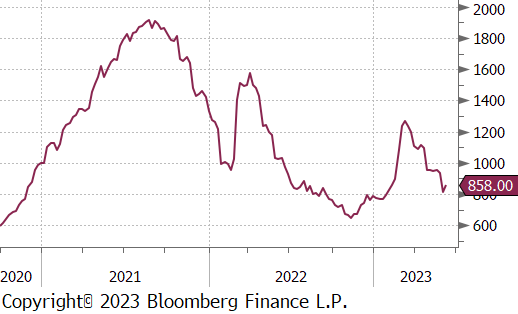
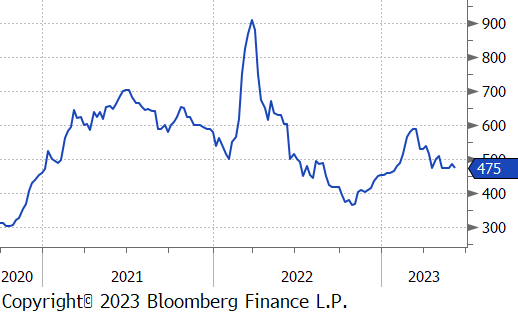
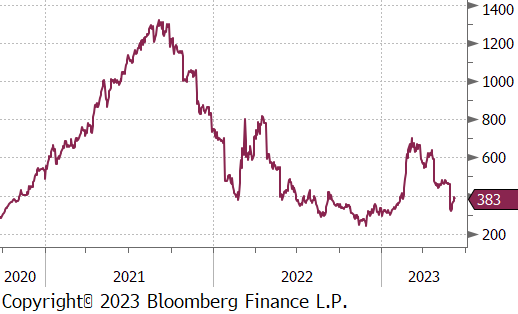
This month’s domestic scrap settlements came in on the lower end of the recently rumored range, with June Busheling settling down $60, or 11.1%. The 2nd month future (August) sold off another $10 as well. The sharp move lower suggests there the floor for domestic HRC has also decreased, by providing EAF mills with additional breathing room. This is most evident in the mill margin spread which increased by $53.
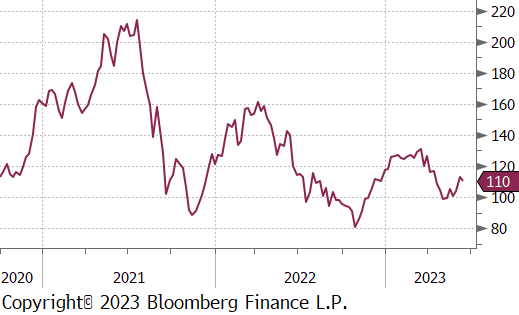
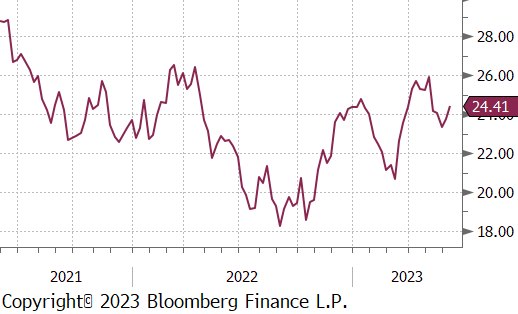
2nd month Iron ore futures continued to climb this week, up another $5, or 4.9%, the move was largely driven by increased stimulus measures from the Chinese government.
Dry Bulk / Freight
The Baltic dry index was higher last week, as well, up $103, or 11%. This ended a three-week slide.
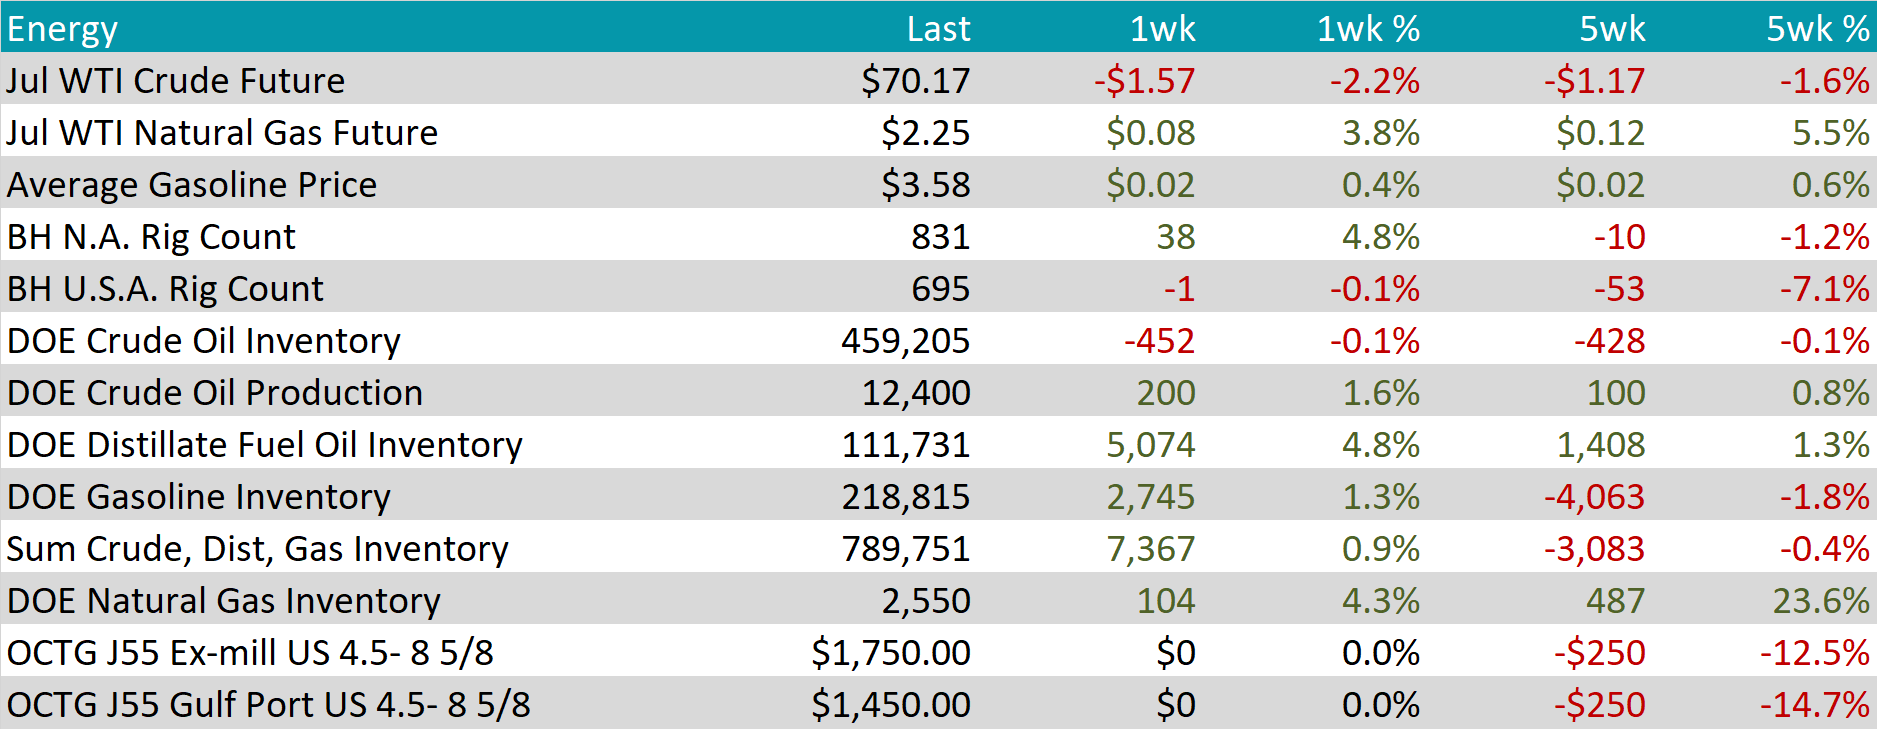
WTI crude oil future lost another $1.57 or 2.2% to $70.17/bbl.
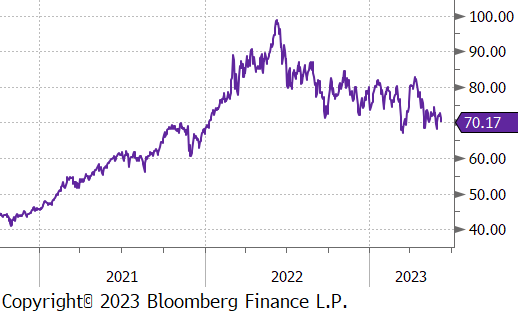
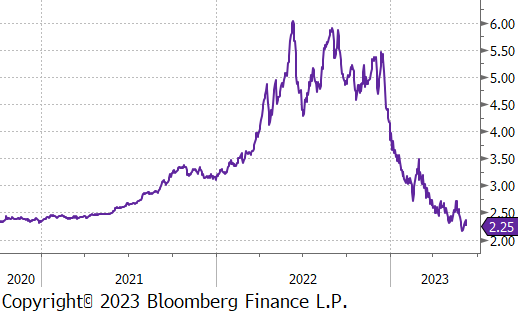
WTI natural gas future gained $0.08 or 3.8% to $2.25/bbl.
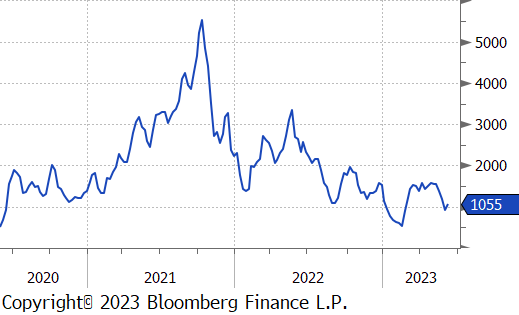
The aggregate inventory level was up another 0.9%, this week.
The Baker Hughes North American rig count was up 38 rigs, this is the first increase since the end of January, 19 weeks ago. The U.S. count was down slightly, losing 1 rig, this week.
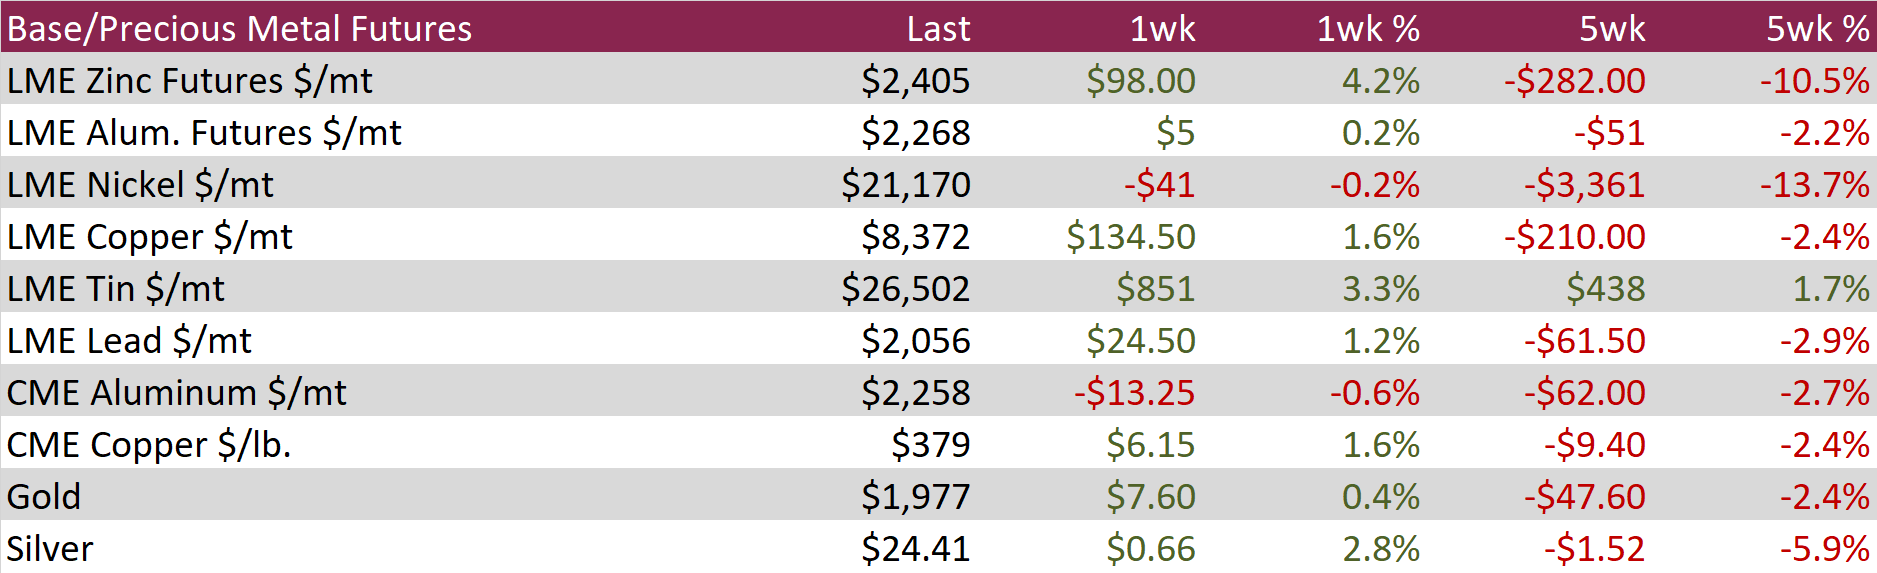
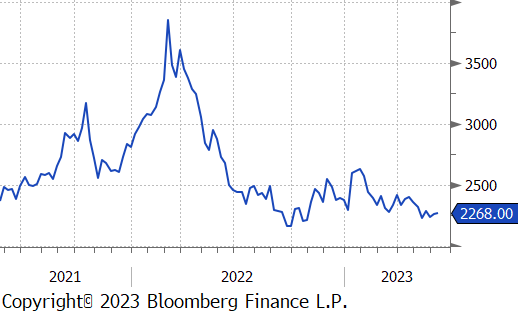
Aluminum was mostly flat during the week ending June 9th as it failed to break out of its recent trading range and as many market participants gathered at the Harbor Aluminum Summit. Most headlines from the conference paint a gloomy demand picture amidst a few bright spots in the sector, including aerospace and automotive.
Copper rallied 1.6% during the week, marking the second consecutive weekly gain following a six-week consolidation period through April and May. The gains followed substantial declines in stockpiles on the Shanghai Futures exchange and rising orders for metal stored in LME warehouses in Singapore and Busan. While worries persist over demand conditions in China, low inventory levels are providing support for the red metal.
Silver ended the week 2.8% higher, finishing higher for the second consecutive week and marking the largest one-week percentage gain since mid-April. Gains were likely due to a combination of profit taking from the recent selloff, a softer US Dollar, and concerns about the Fed’s decision next week on interest rates.
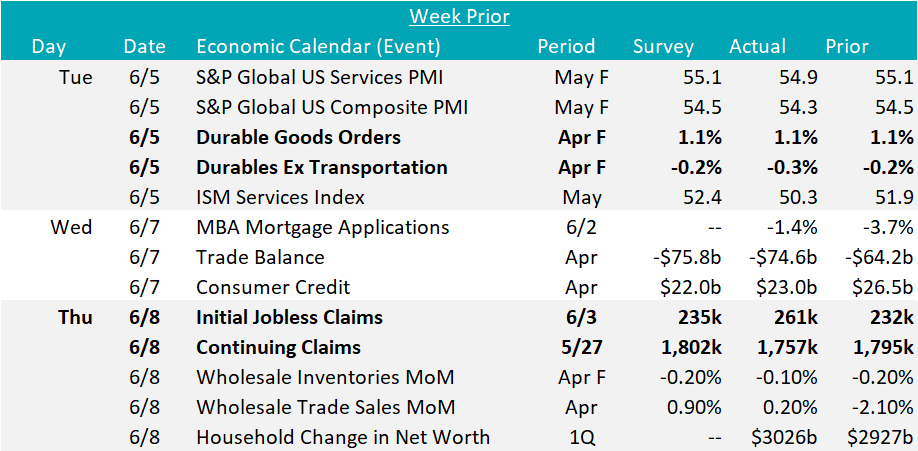
There was very little meaningful economic data this week. Final April durable goods new orders were in line with preliminary data, up 1.1%, while new orders ex. transportation were slightly lower, down -0.3% versus the -0.2% preliminary reading.
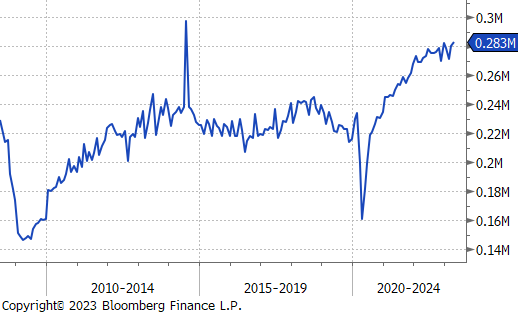
Initial jobless claims increased to 261k, their highest level since October 2021 and well above expectations of 235k. Continuing claims, however, fell from 1.795, down to 1.757M versus an expectation of up to 1.802M. While individuals are losing jobs at a meaningfully higher rate than in the last 18 months, many of these workers are quickly finding another position, due to significant existing demand.
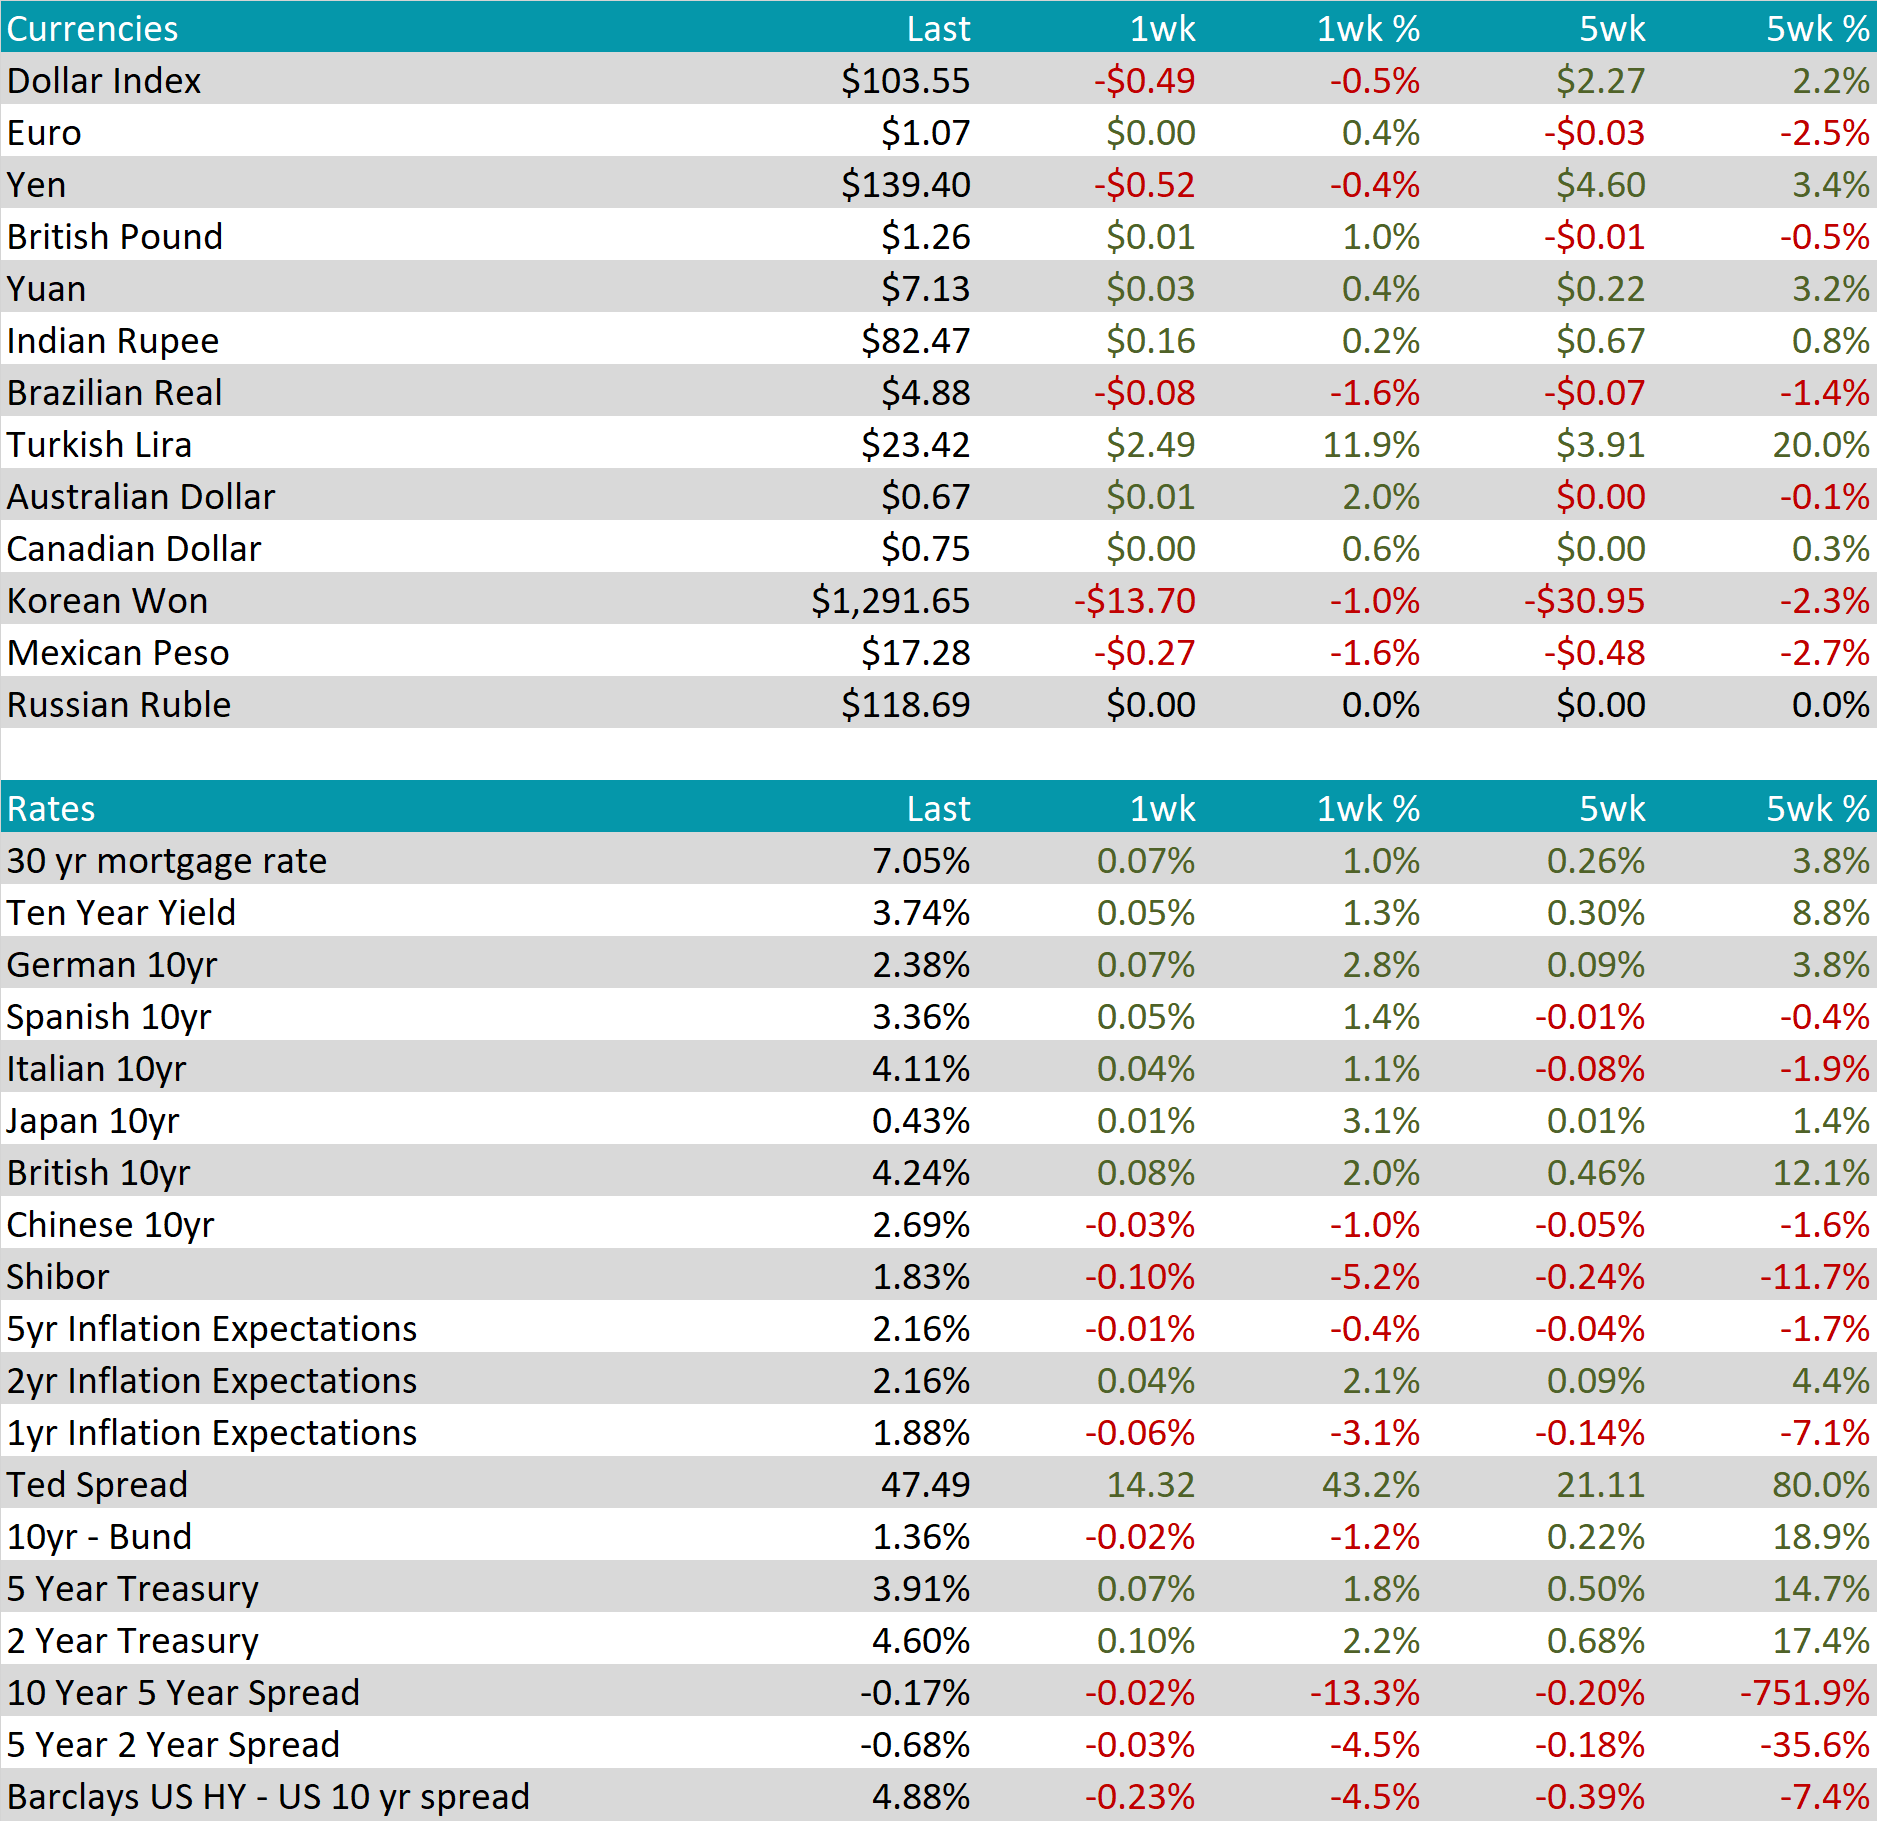
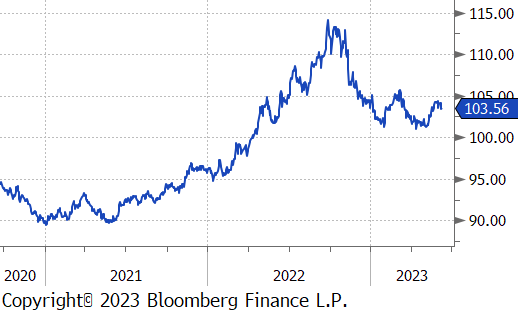
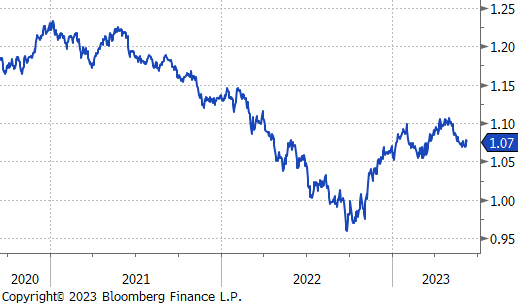
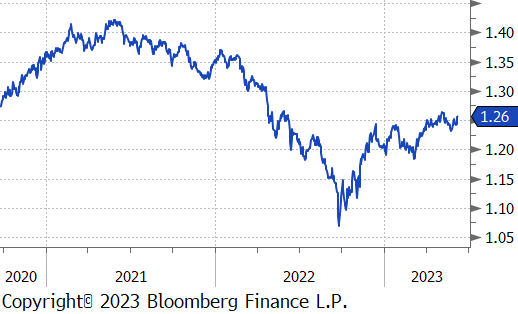
This week, the U.S. dollar lost $0.49 or 0.5%, down to 103.55. Taking a brief look back to the first quarter of 2023, the Eurozone economy unexpectedly contracted by 0.1% quarter-on-quarter, contradicting earlier expectations of a modest 0.1% growth. Despite this, the Euro maintained its strength against the US dollar, rebounding from its recent lows around 1.06. The EURUSD exchange rate finished the week just below 1.08. The British pound was another big winner against dollar weakness this week, ending the week 1% higher. Investors anticipate further interest rate hikes from the European Central Bank (ECB) and Bank of England (BOE) due to persistent concerns about sticky inflation.
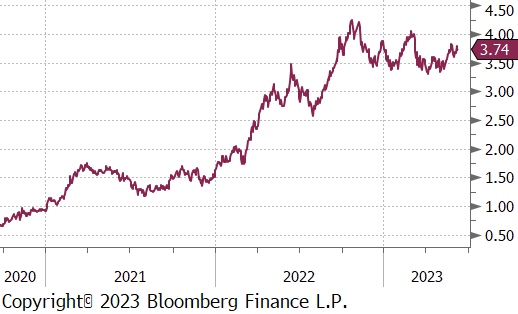
Meanwhile, US rates experienced a slight increase, with the 10-year Treasury yield remaining around 3.74%. Recent bond sell-offs have been driven by a lack of worry regarding the banking sector and stronger-than-anticipated economic data.