Flack Capital Markets | Ferrous Financial Insider
June 7, 2024 – Issue #435
June 7, 2024 – Issue #435
Overview:
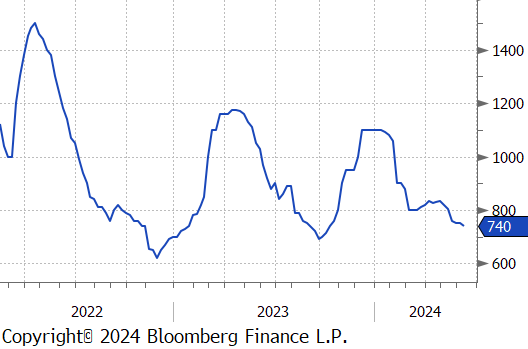
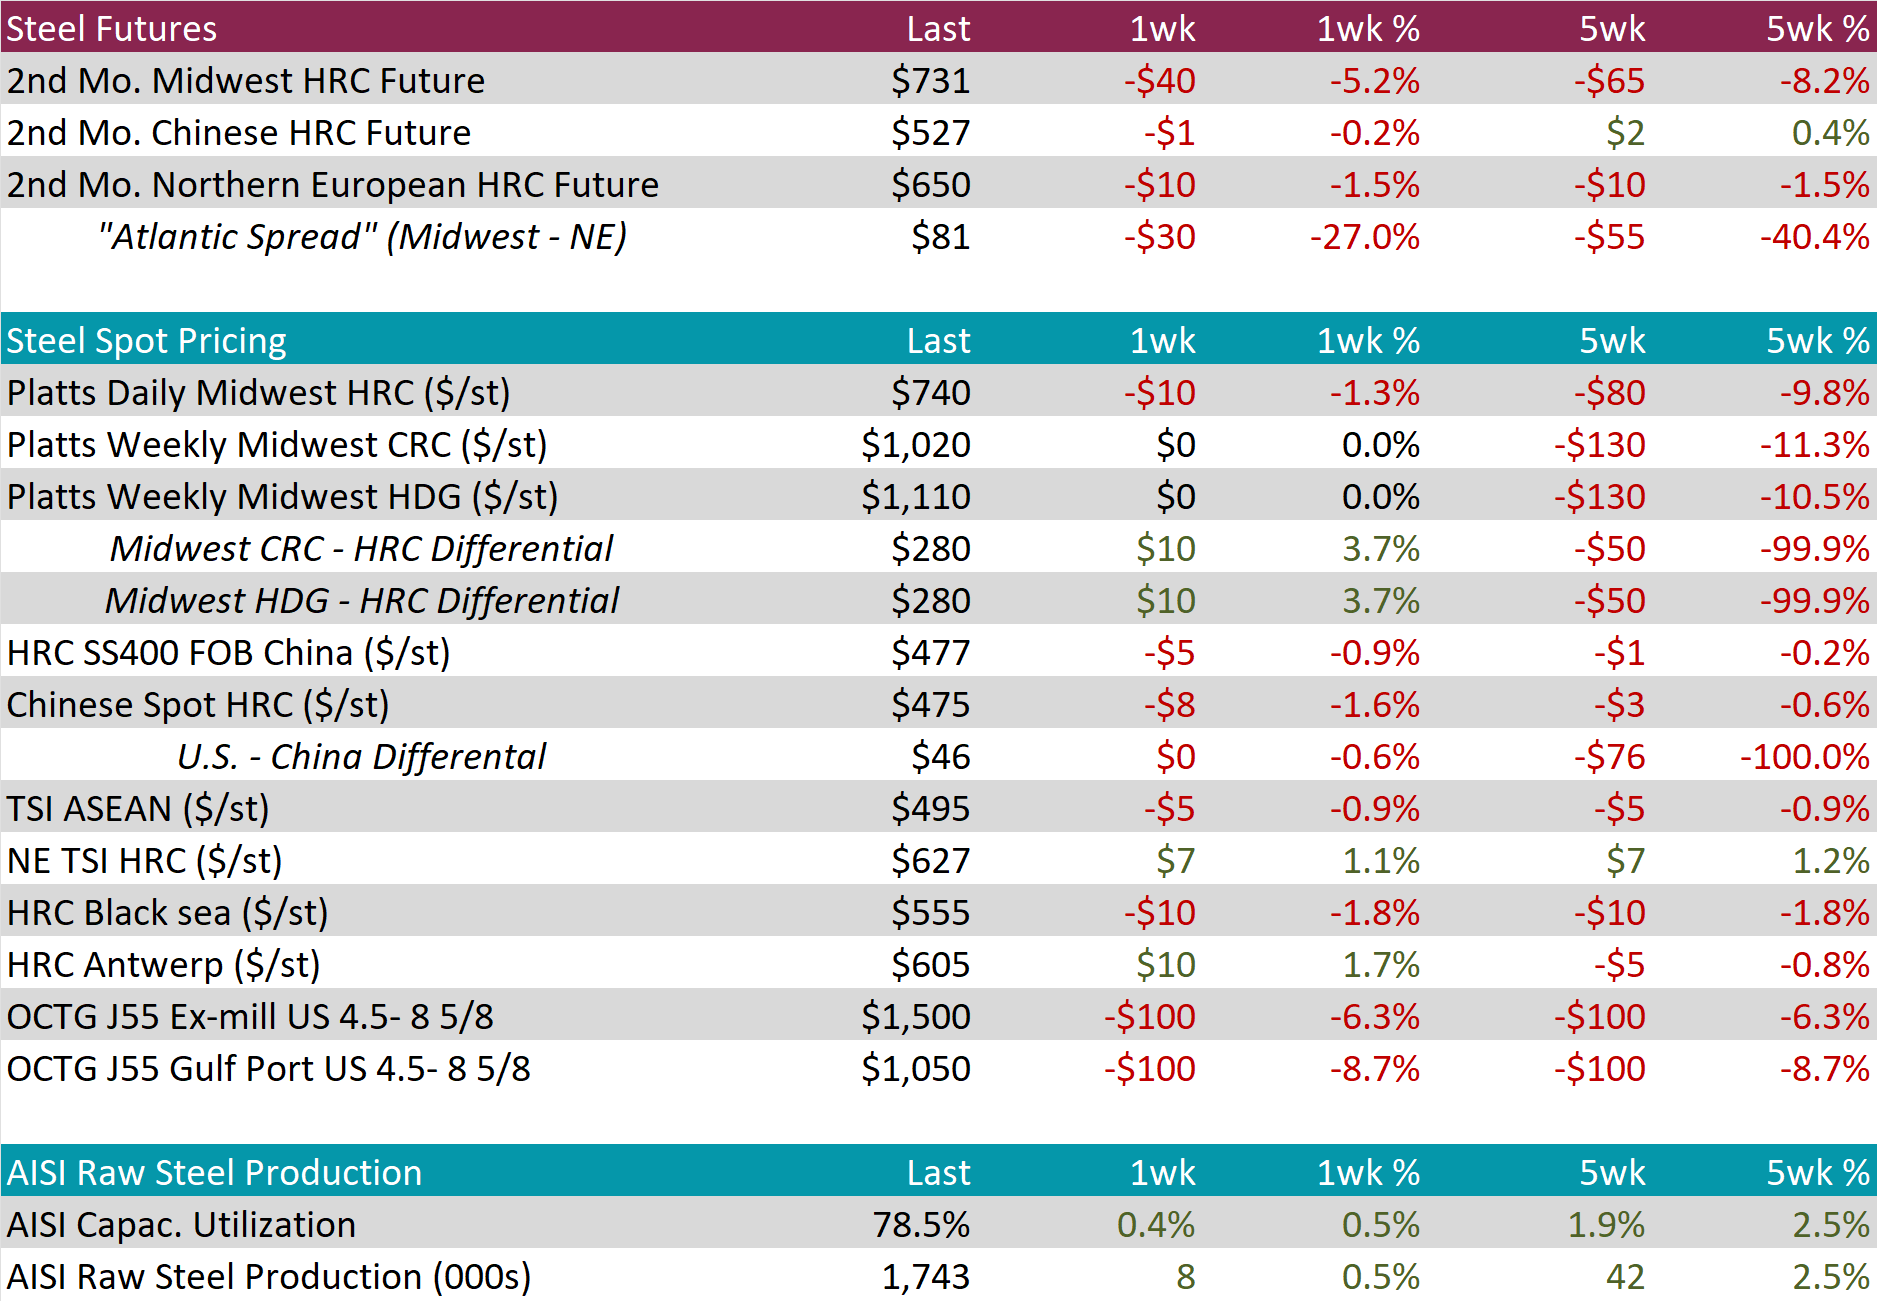
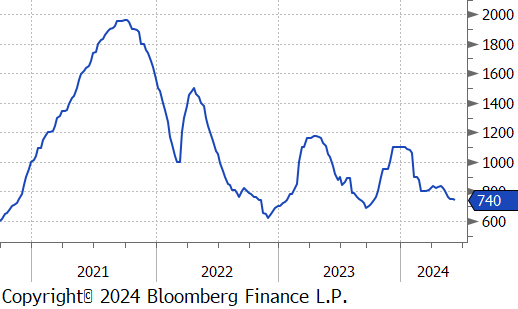
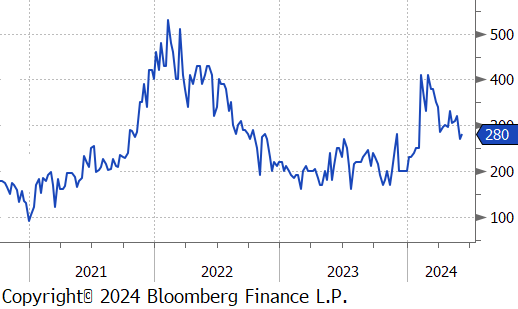
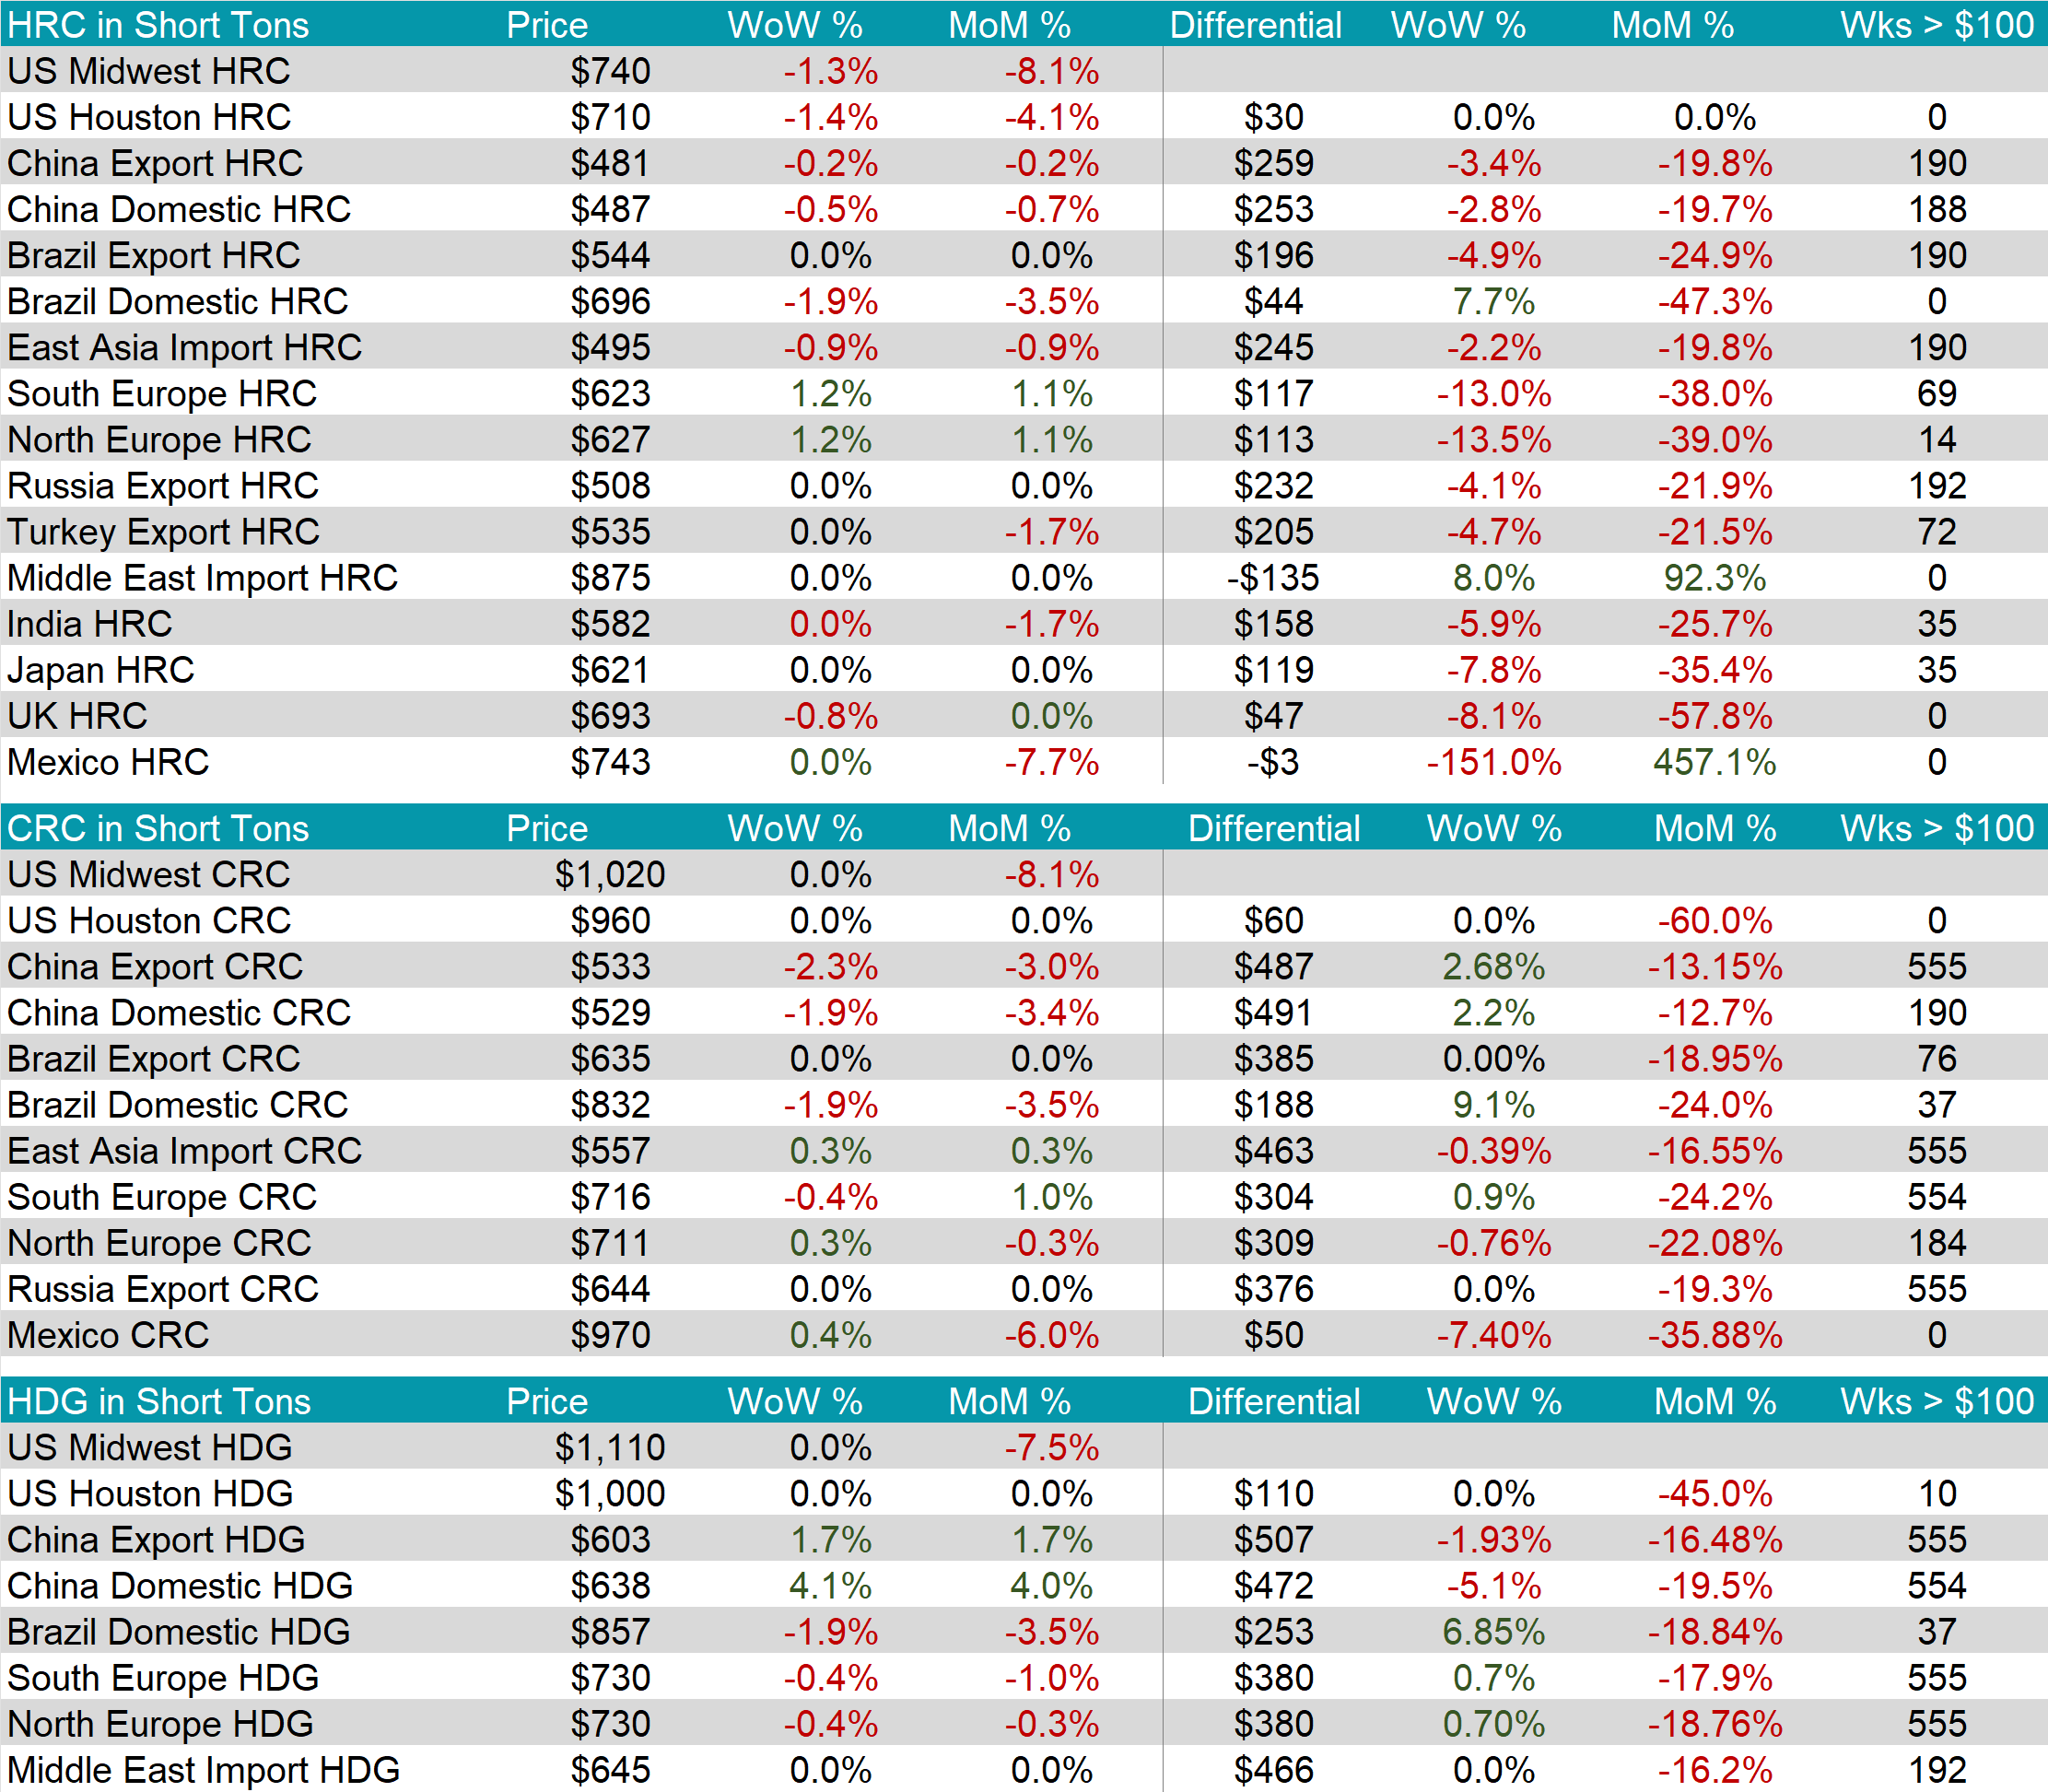
The HRC spot price declined further, falling by $10 or -1.3% to $740, hitting its lowest level since October 2023. At the same time, the HRC 2nd month future dropped by $40 or -5.2% to $731, reaching its lowest point since September 2023.
Tandem products both held steady, resulting in the HDG – HRC differential to rise by $10 or 3.7% to $280.
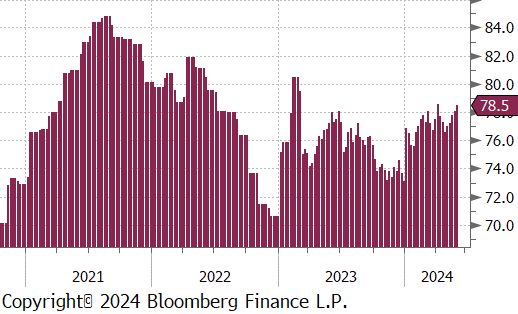
Mill production continued to scale up, with capacity utilization ticking up by 0.4% to 78.5%, bringing raw steel production up to 1.743m net tons. This marks the fifth consecutive week of increases.
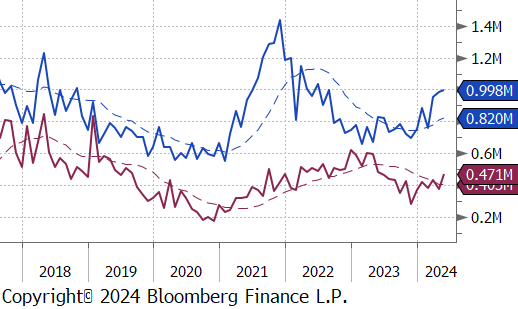
May Projection – Sheet 998k (up 11k MoM); Tube 471k (up 95k MoM)
April Projection – Sheet 987k (up 31k MoM); Tube 376k (down 60k MoM)
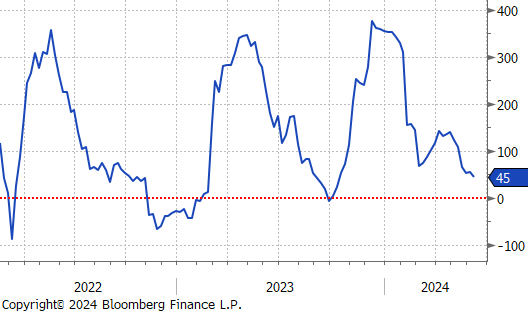
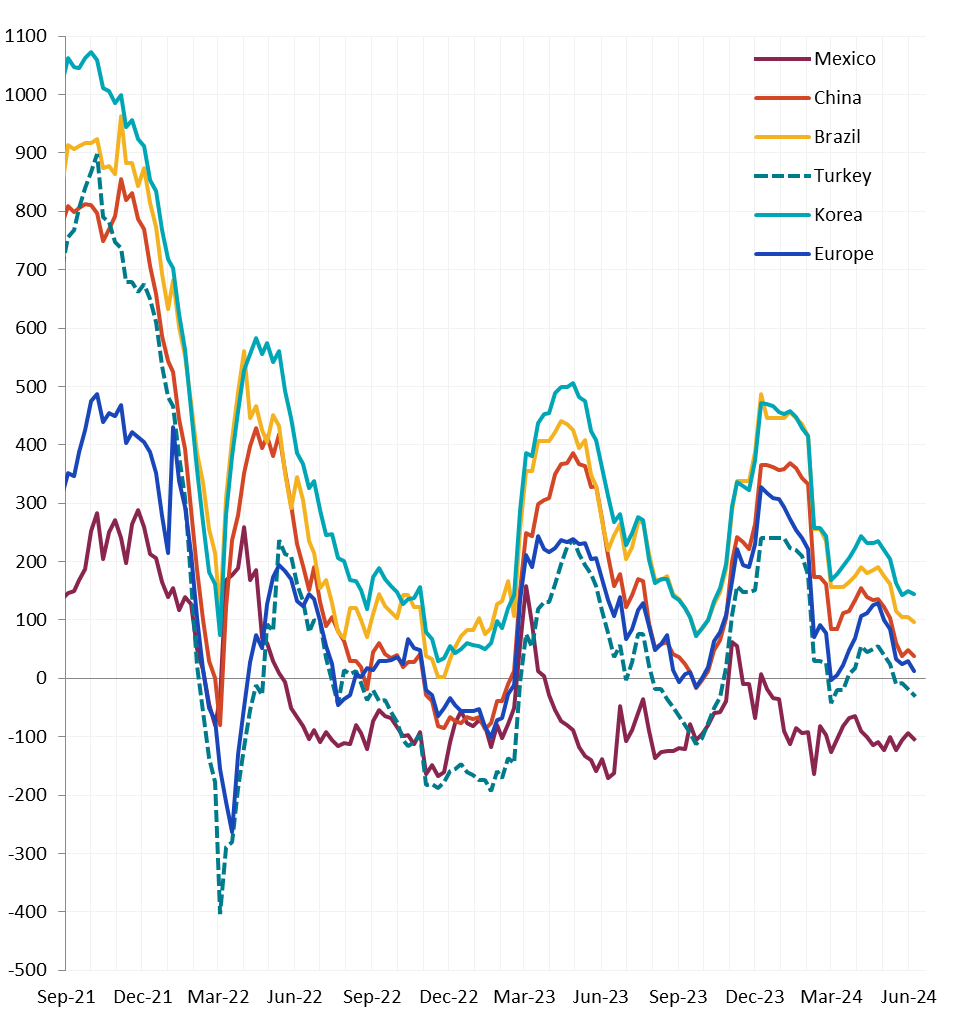
All watched global differentials contracted this week. Main price movements from these were from the N. Europe HRC increasing by 1.2% and from Brazil Domestic HRC falling by -1.9%, while its Export HRC was unchanged.
Scrap
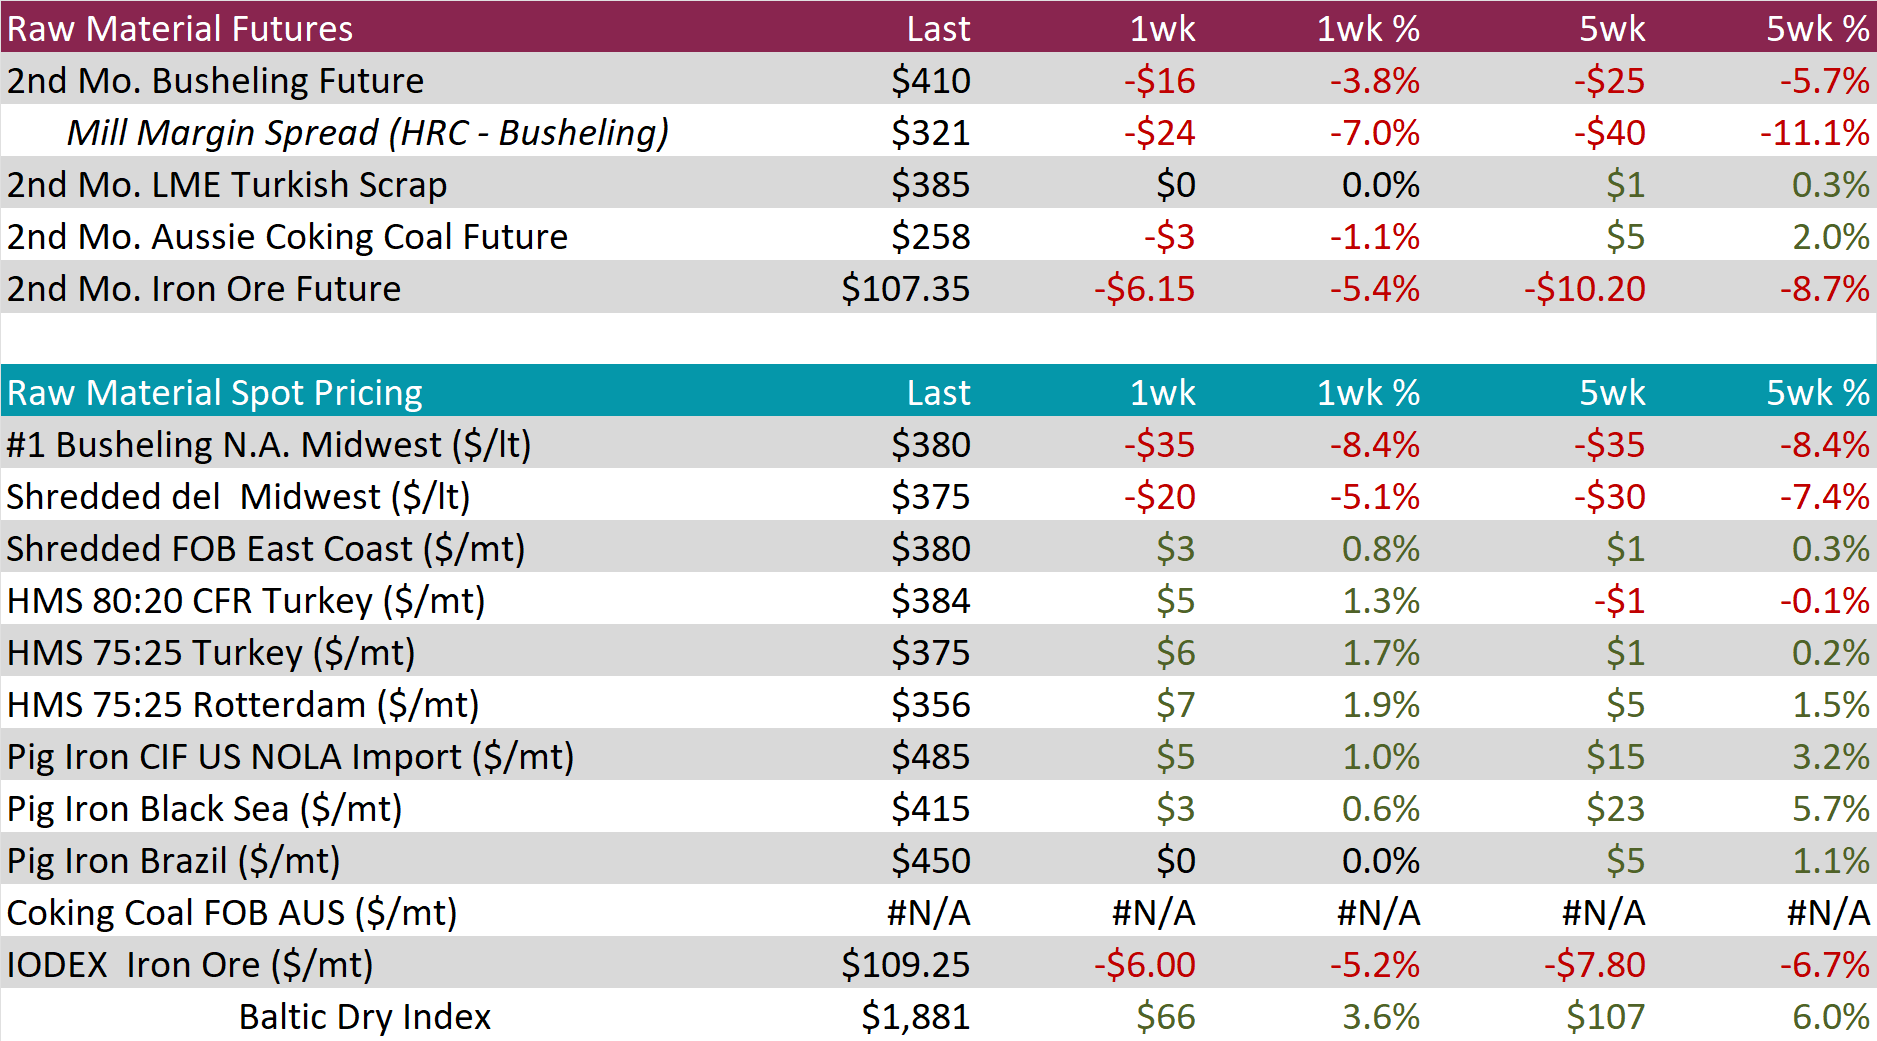
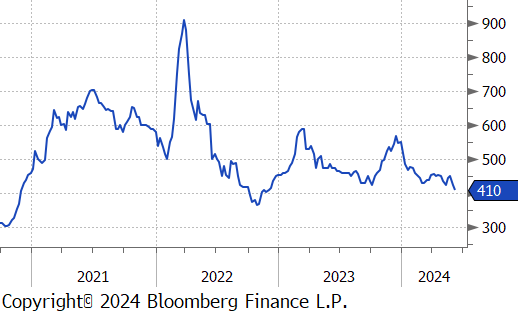
The busheling 2nd month future dropped by $16 or -3.8% to $410, hitting its lowest price since December 2022. Meanwhile, the busheling spot price fell by $35 or -8.4% to $380, also hitting its lowest level since December 2022.
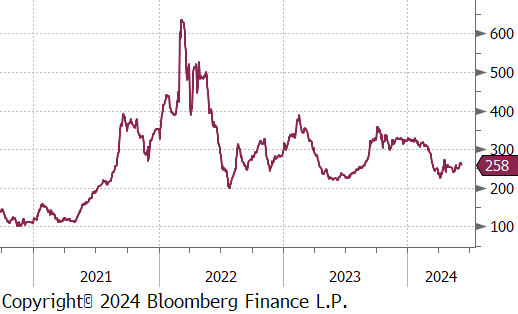
The Aussie coking coal 2nd month future edged down by $3 or -1.1% to $258, resulting in its five-week price change to be up by $5 or 2.0% as it continues to fluctuate in this price range.
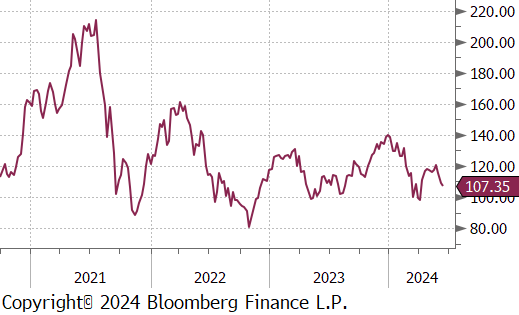
The 2nd month iron ore future declined by $6.15 or -5.4% to $107.35, marking its second consecutive week of a downturn and reaching its lowest point since early April.
Dry Bulk / Freight
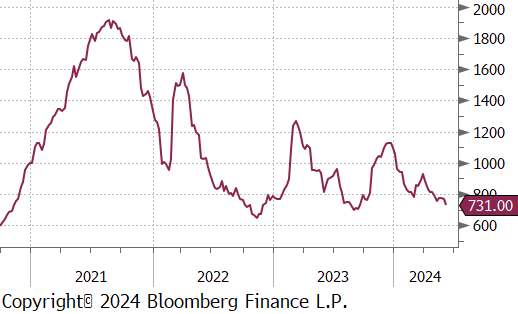
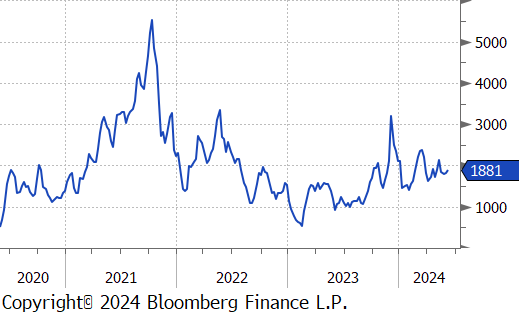
The Baltic Dry Index inched up again this week, climbing by $66 or 3.6% to $1,881, nearing the $1,900 price level.
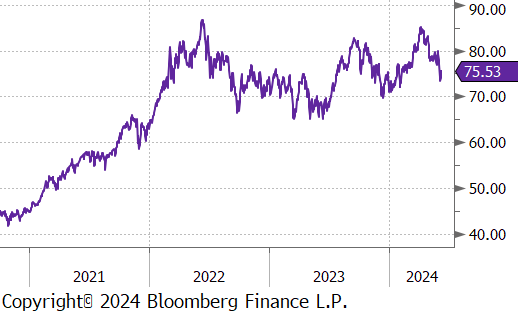
WTI crude oil future lost $1.46 or -1.9% to $75.53/bbl.
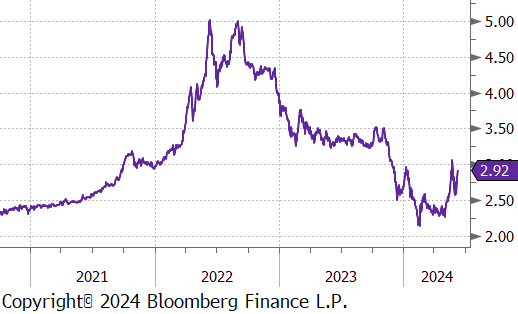
WTI natural gas future gained $0.33 or 12.8% to $2.92/bbl.
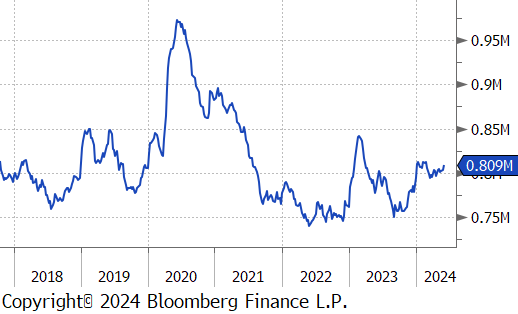
The aggregate inventory level experienced a slight increase of 0.8%.
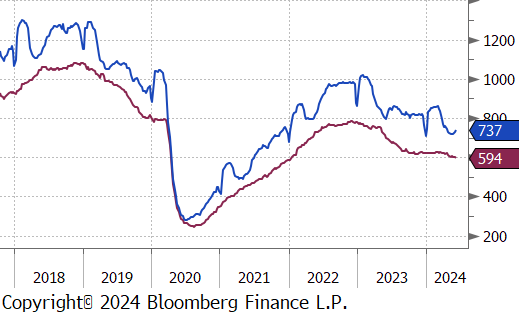
The Baker Hughes North American rig count added 9 rigs, bringing the total count to 737 rigs. At the same time, the US rig count reduced by 6 rigs, bringing the total count to 594, breaking below the 600-rig level for the first time since January 2022.
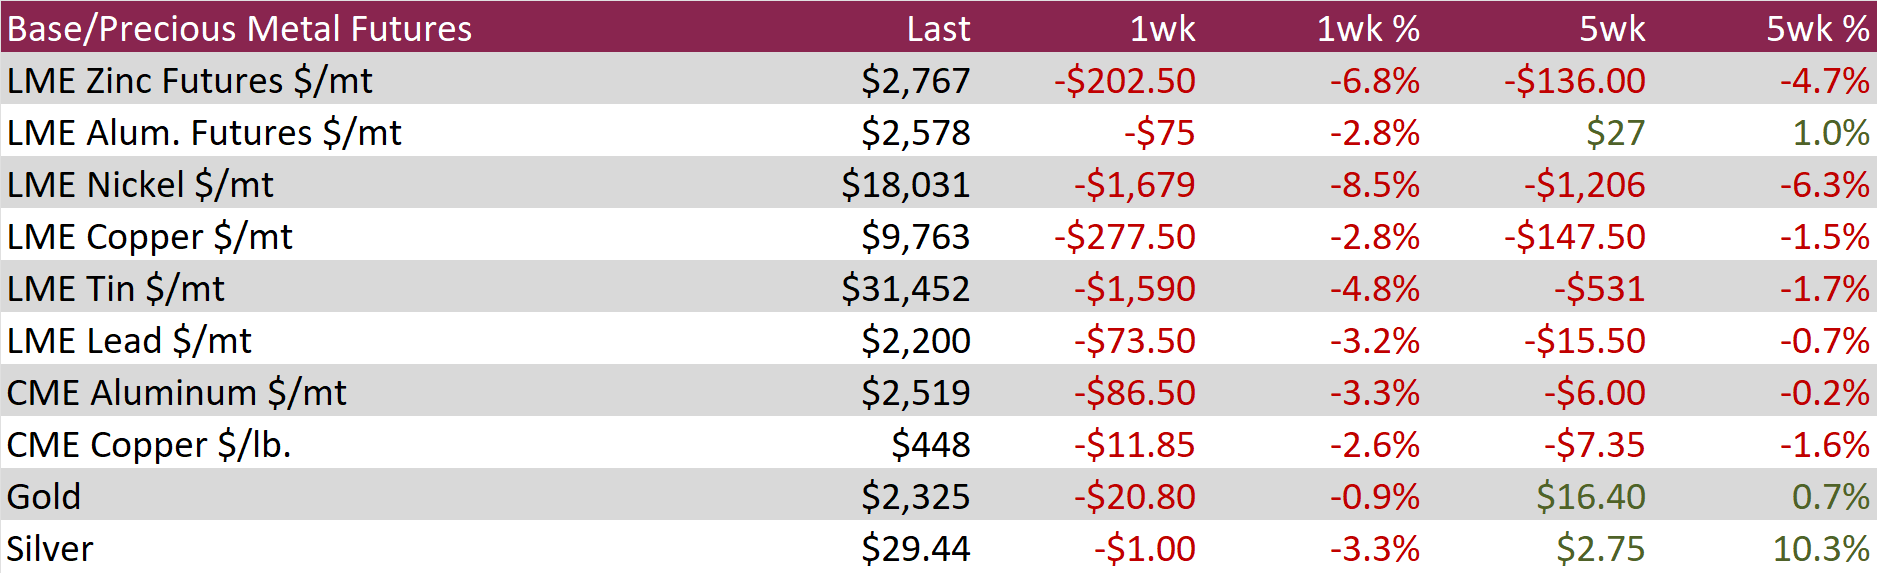
Aluminum futures fell by $75 or -2.8% to $2,578, retreating from recent high amid a broader downturn in base metals driven by concerns over demand from major consumers. Recent official PMI data revealed an unexpected contraction in China’s manufacturing activity for May, and skepticism regarding the effectiveness of governmental support for the property sector tempered expectations for an economic rebound. Despite these demand concerns, supply risks have maintained prices 14% above the levels at the beginning of the second quarter. Contributing to these supply concerns, Rio Tinto declared force majeure on alumina shipments from its Australian refineries due to gas shortages. Additionally, unpredictable weather conditions in Yunnan, a critical aluminum-producing region in China, have jeopardized hydroelectric power availability, further straining production capabilities.
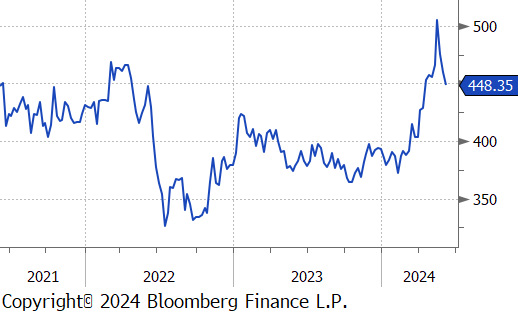
Copper futures declined by $11.85 or -2.6% to $448, reaching a one-month low and negating May’s rally that saw prices hit a record high, due to signs of weakening demand. Following an unexpected contraction in China’s manufacturing sector, trade data revealed a 7.1% decline in copper ore imports despite rising prices, with refiners increasingly turning to scrap metal to sustain production. This shift contributed to a rise in Chinese copper inventories to their highest levels since 2020, counteracting typical seasonal drawdowns. As a result, prices for deliveries from Shanghai bonded warehouses continued to be lower than those on the LME for the second consecutive week. Despite the recent downturn, copper prices are still up 15% year-to-date, buoyed by speculative investments anticipating potential shortages.
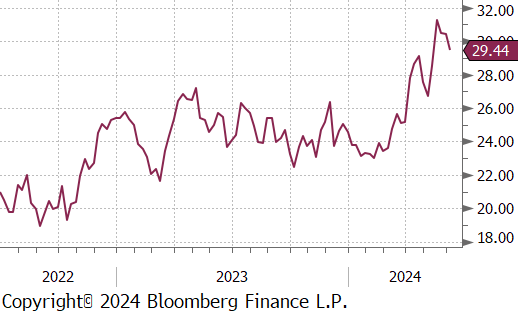
Silver fell below $30 to $29.44, a sharp decline from the 11-year high, amid a broad downturn in bullion influenced by strong US economic data that supported a hawkish Fed outlook. A significant increase in May’s nonfarm payrolls, underscored the strength of the US labor market and exerted upward pressure on US Treasuries, which in turn reduced the appeal of non-yielding bullion assets. The decline in precious metals was further exacerbated by the PBoC pausing its gold purchases, which had been a major factor in the asset class’s strong performance earlier this year. Additionally, the US implemented 50% tariffs on Chinese imports of solar cells, a key industrial use for silver, aiming to curb production in major Asian panel factories with corporate bases in China. Despite these pressures, robust demand within China’s domestic market helped prevent an even steeper drop in silver prices, highlighted by the recent activation of the world’s largest solar farm in northwestern Xinjiang.

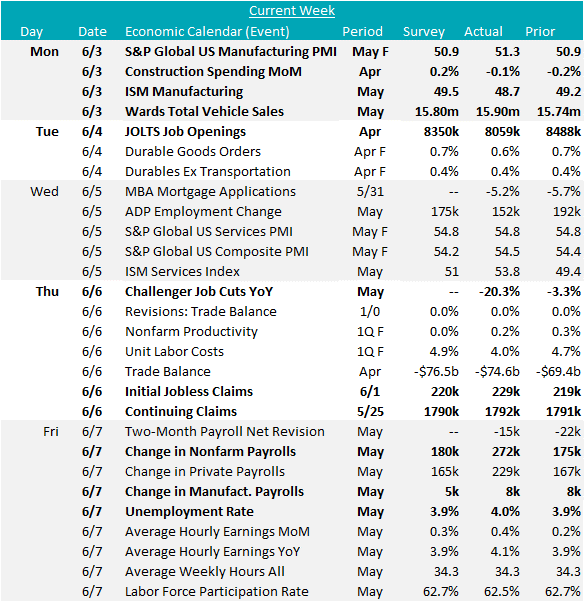
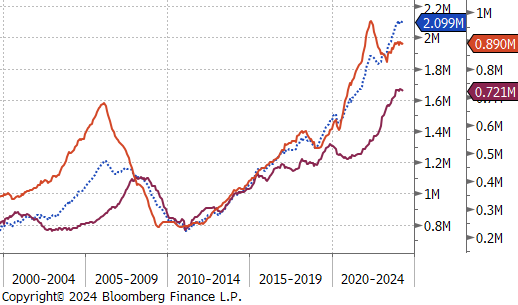
In the recent manufacturing data, the S&P Global US Manufacturing PMI exceeded expectations, rising to 51.3 versus the expected 50.9. Conversely, the ISM Manufacturing PMI dropped to 48.7, surprising to the downside as was anticipated for a slight increase to 49.5. Furthermore, Construction Spending MoM disappointed for the fourth consecutive month, slipping by -0.1% instead of the forecasted 0.2% increase. This decline was mainly due to a -0.2% decrease in public spending and a -0.1% fall in private spending. However, residential spending edged up by 0.1%. Additionally, Wards Total Vehicle Sales surpassed expectations of 15.80m and jumped to 15.90m from April’s 15.74m. This marks the third straight month of sales growth. However, sales have still yet to consistently reach the pre-pandemic levels of 16-17m.
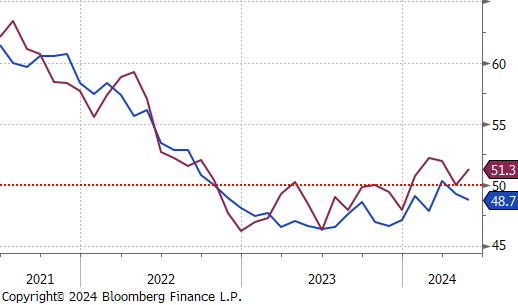
The latest labor market data presents a complex picture. Nonfarm Payrolls surged by 272k in May, the highest in five months and well above the forecasted 185k, reflecting robust hiring. Manufacturing Payrolls also beat expectations, holding steady at 8k instead of the predicted decline to 5k. Meanwhile, Challenger Job Cuts for May decreased significantly by -20.3% year-over-year, the lowest since February 2021. Despite these positive indicators, the Unemployment Rate rose to 4.0%, up from the forecast to stay at 3.9% and reaching the highest level since January 2022. This increase, alongside the sharp drop in JOLTS Job Openings to 8059k, well below the anticipated 8350k, signals potential challenges in labor demand. The divergence between rising payrolls and unemployment suggest that the true state of the labor market likely lies between these mixed readings, indicating a resilience but also cooling underlying structural changes.