Flack Capital Markets | Ferrous Financial Insider
June 14, 2024 – Issue #436
June 14, 2024 – Issue #436
Overview:
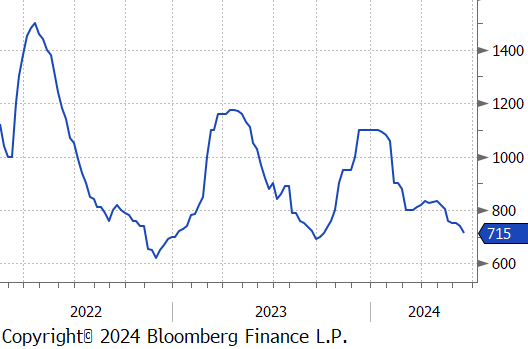
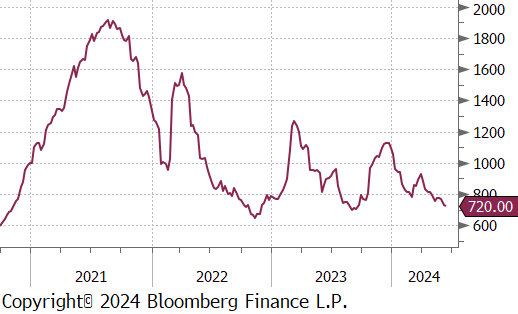
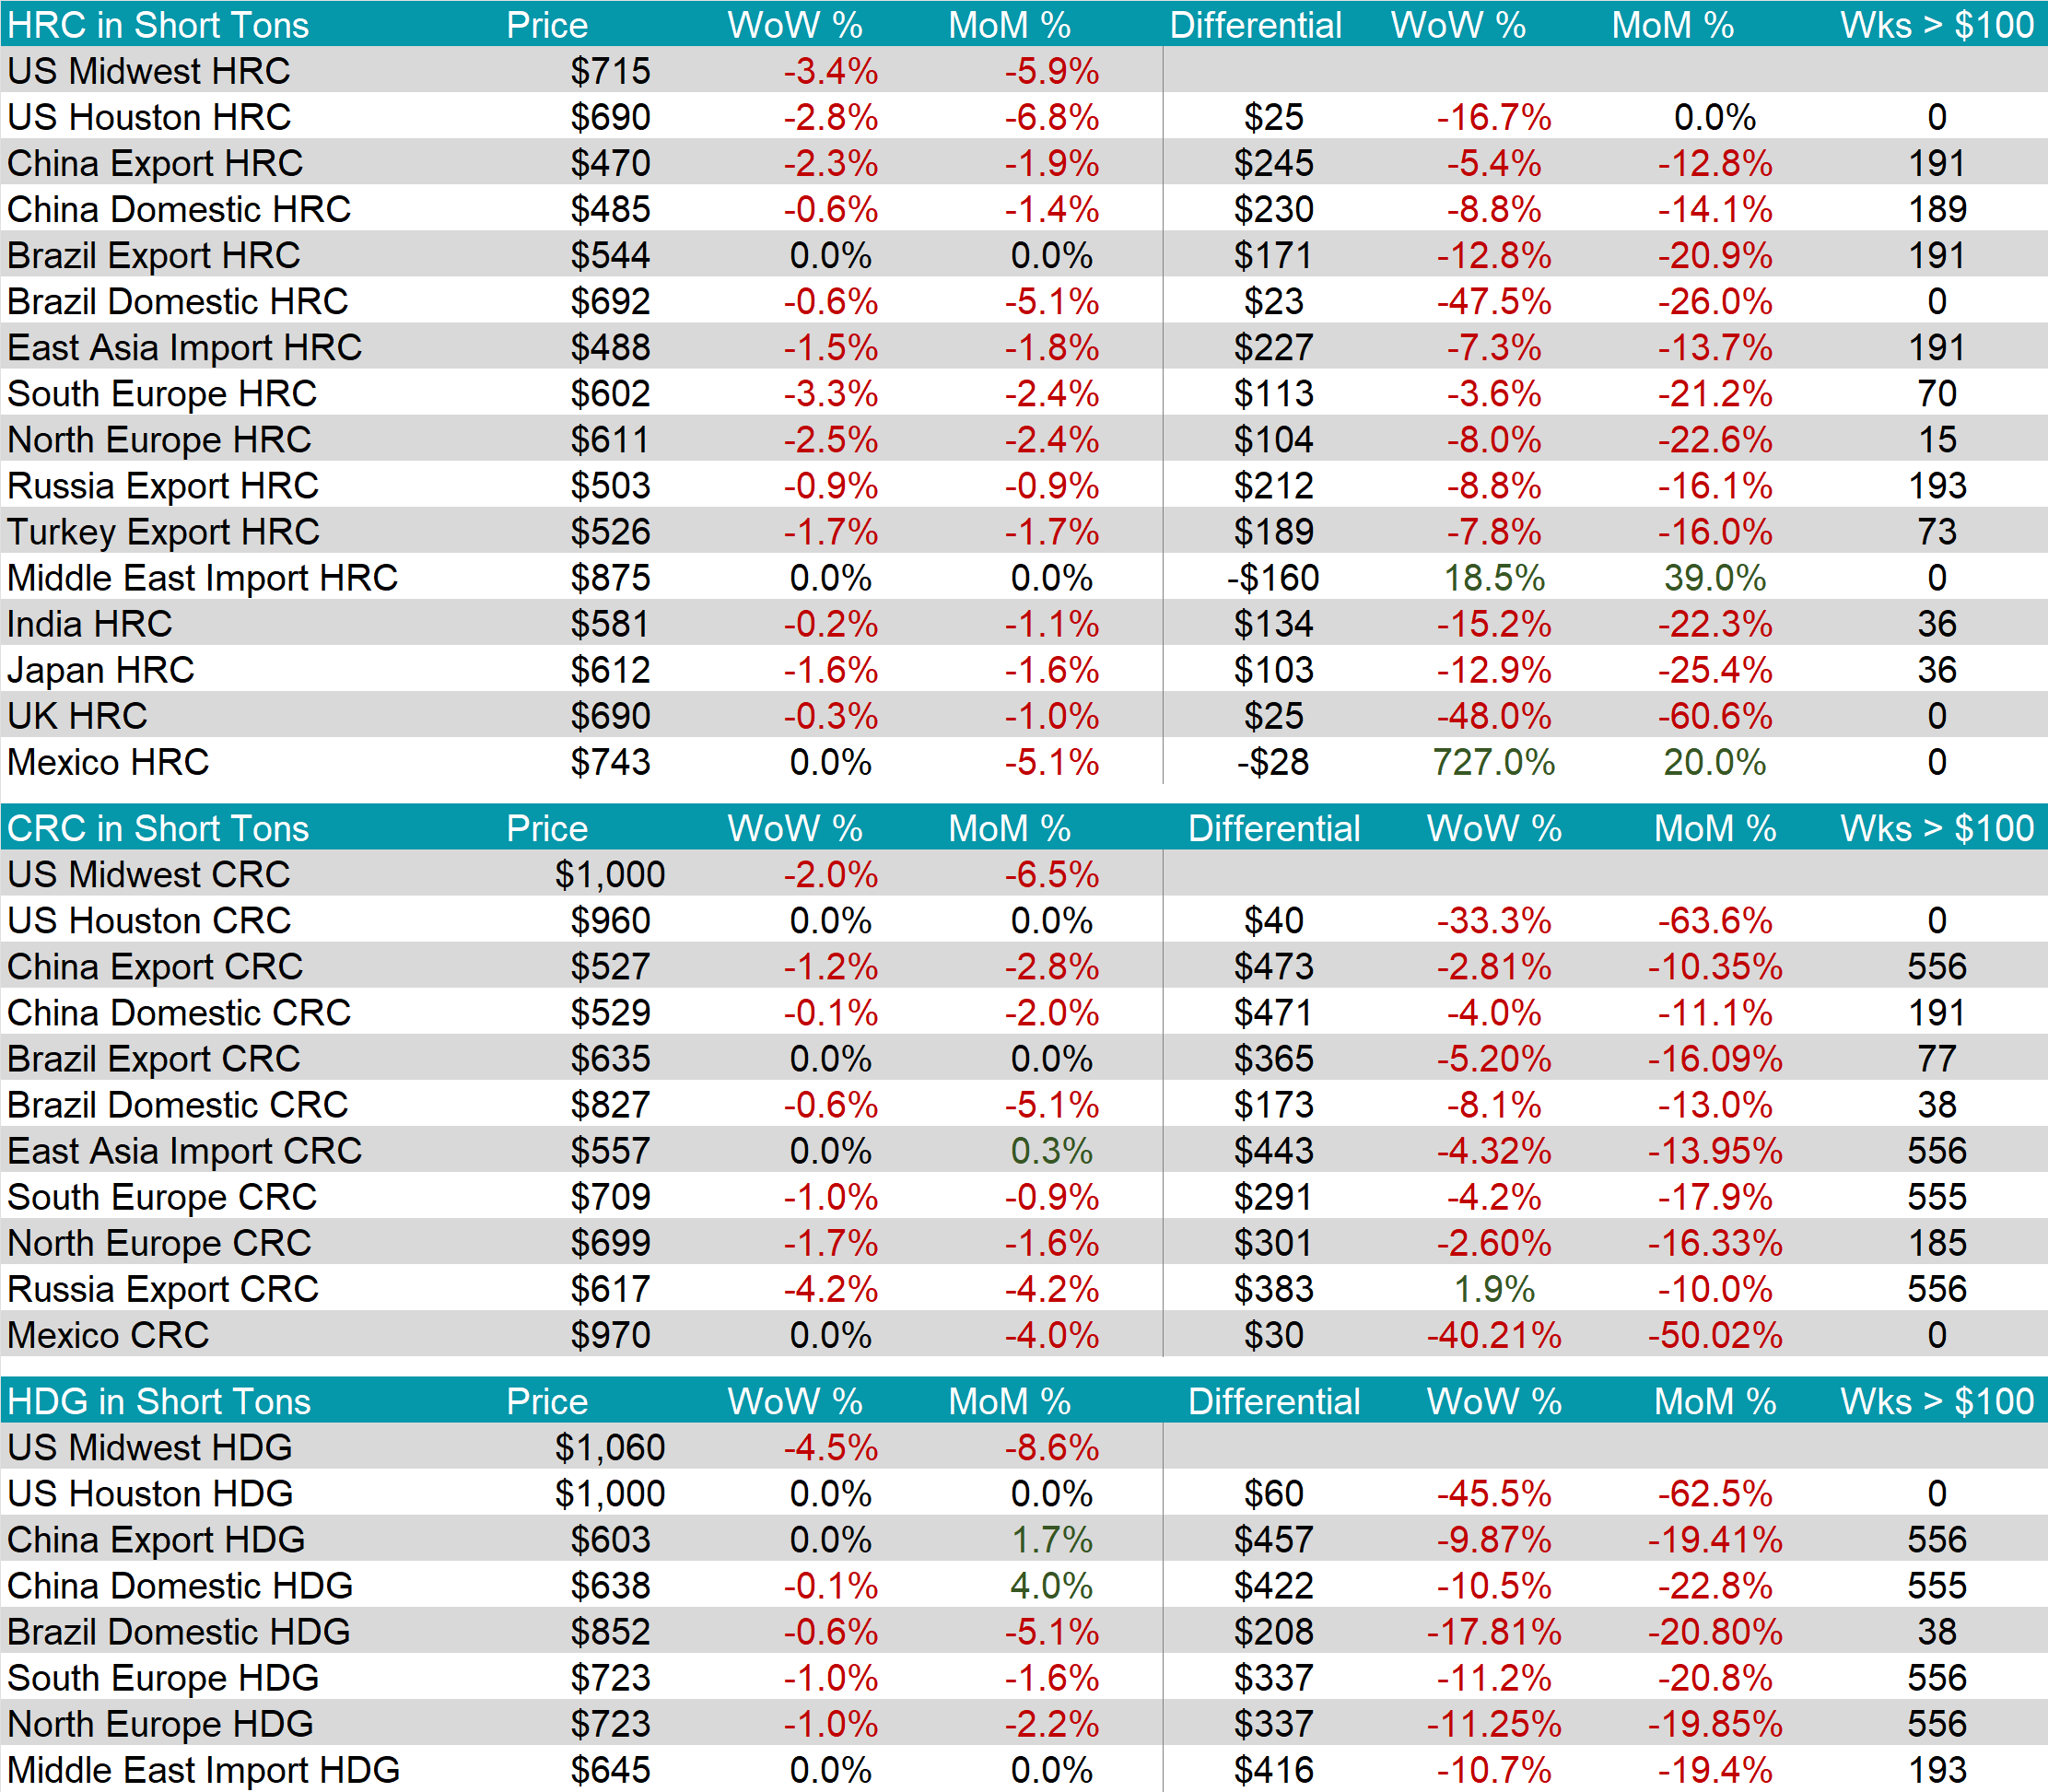
The HRC spot price dropped by $25 or -3.4% to $715, hitting its lowest price since early-October 2023. At the same time, the HRC 2nd month future fell by $11 or -1.5% to $720, reaching the lowest since September 2023.
Tandem products both declined, however HDG more so than CRC, resulting in the HDG- HRC differential to fall by $25 or -8.9% to $255, while the CRC – HRC differential only fell by $5.
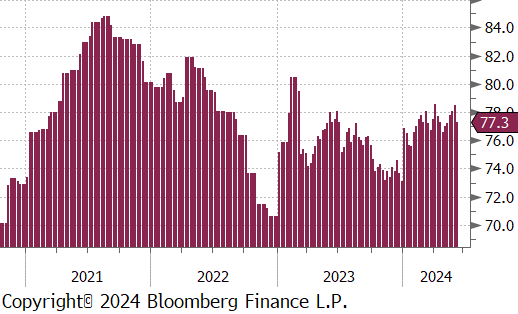
Mill production sharply retreated after five consecutive weeks on increases, with capacity utilization ticking down by -1.2%, bringing raw steel production down to 1.716m net tons.


June Projection – Sheet 973k (down 66k MoM); Tube 474k (down 8k MoM)
May Projection – Sheet 1038k (up 51k MoM); Tube 483k (up 107k MoM)
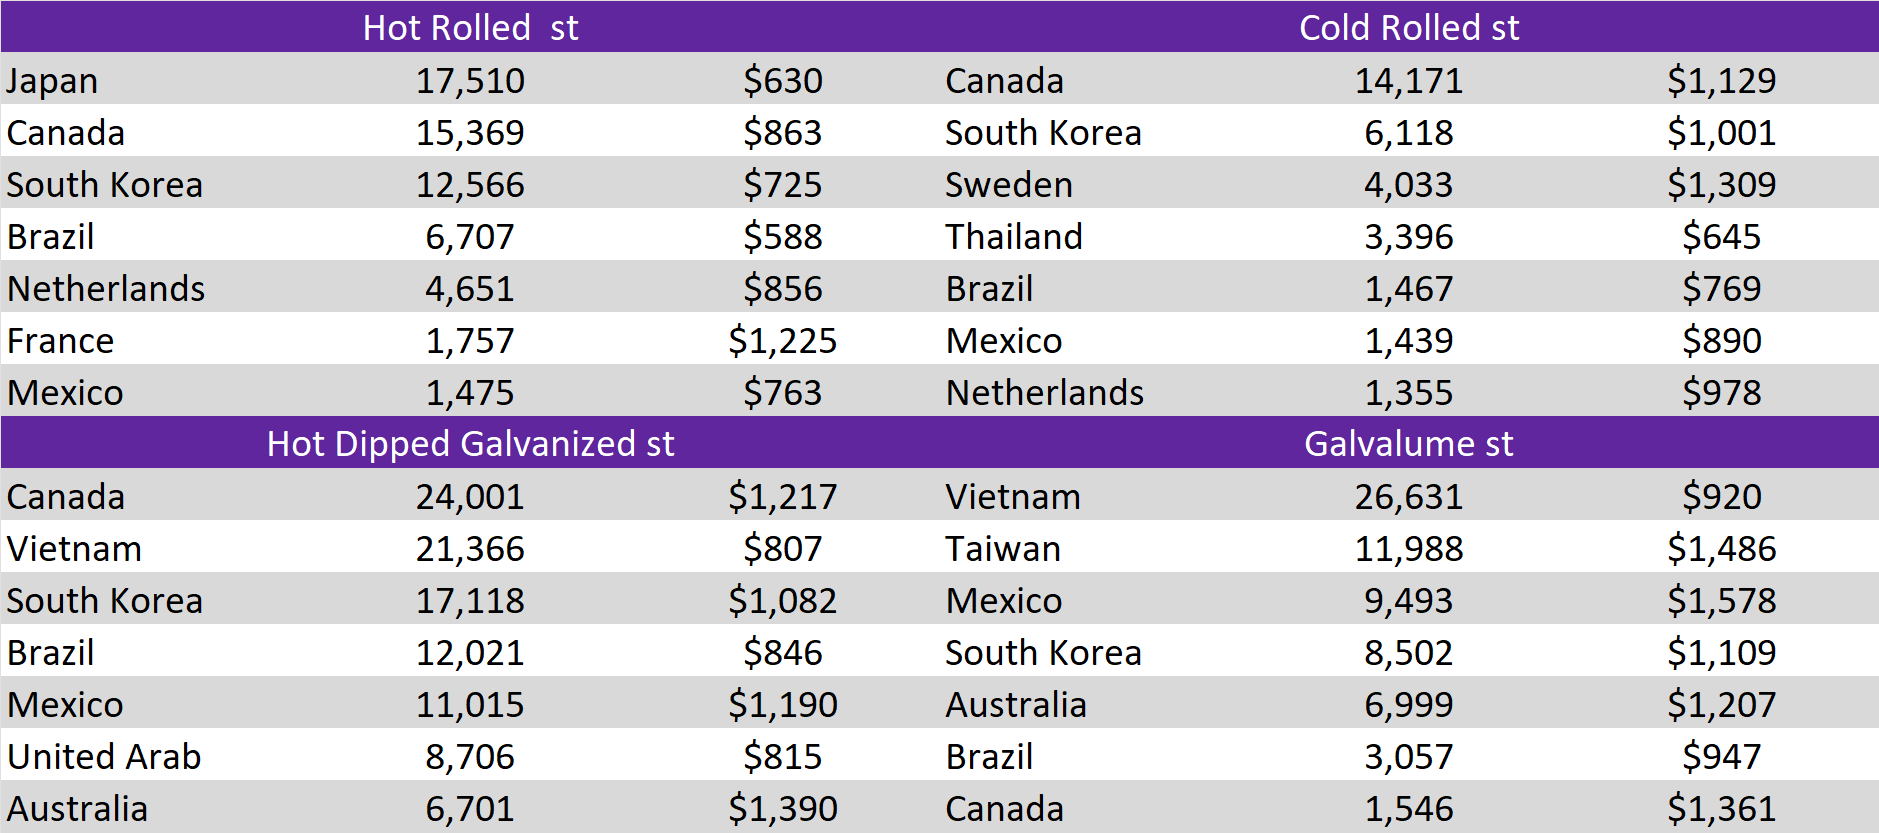
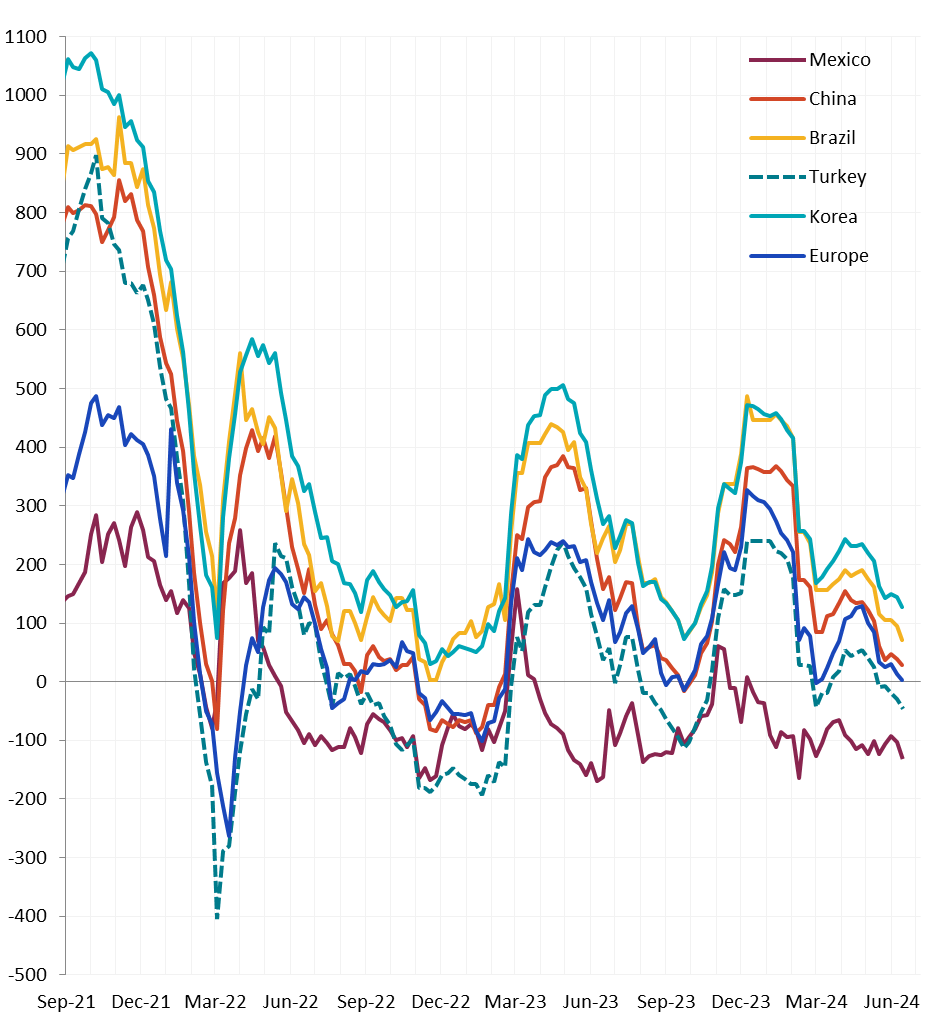
All watched global differentials all contracted. Biggest price movers this week were from South and North Europe HRC, declining by -3.3% and -2.5%, respectively. Also, the China Export HRC dropped by -2.3%.

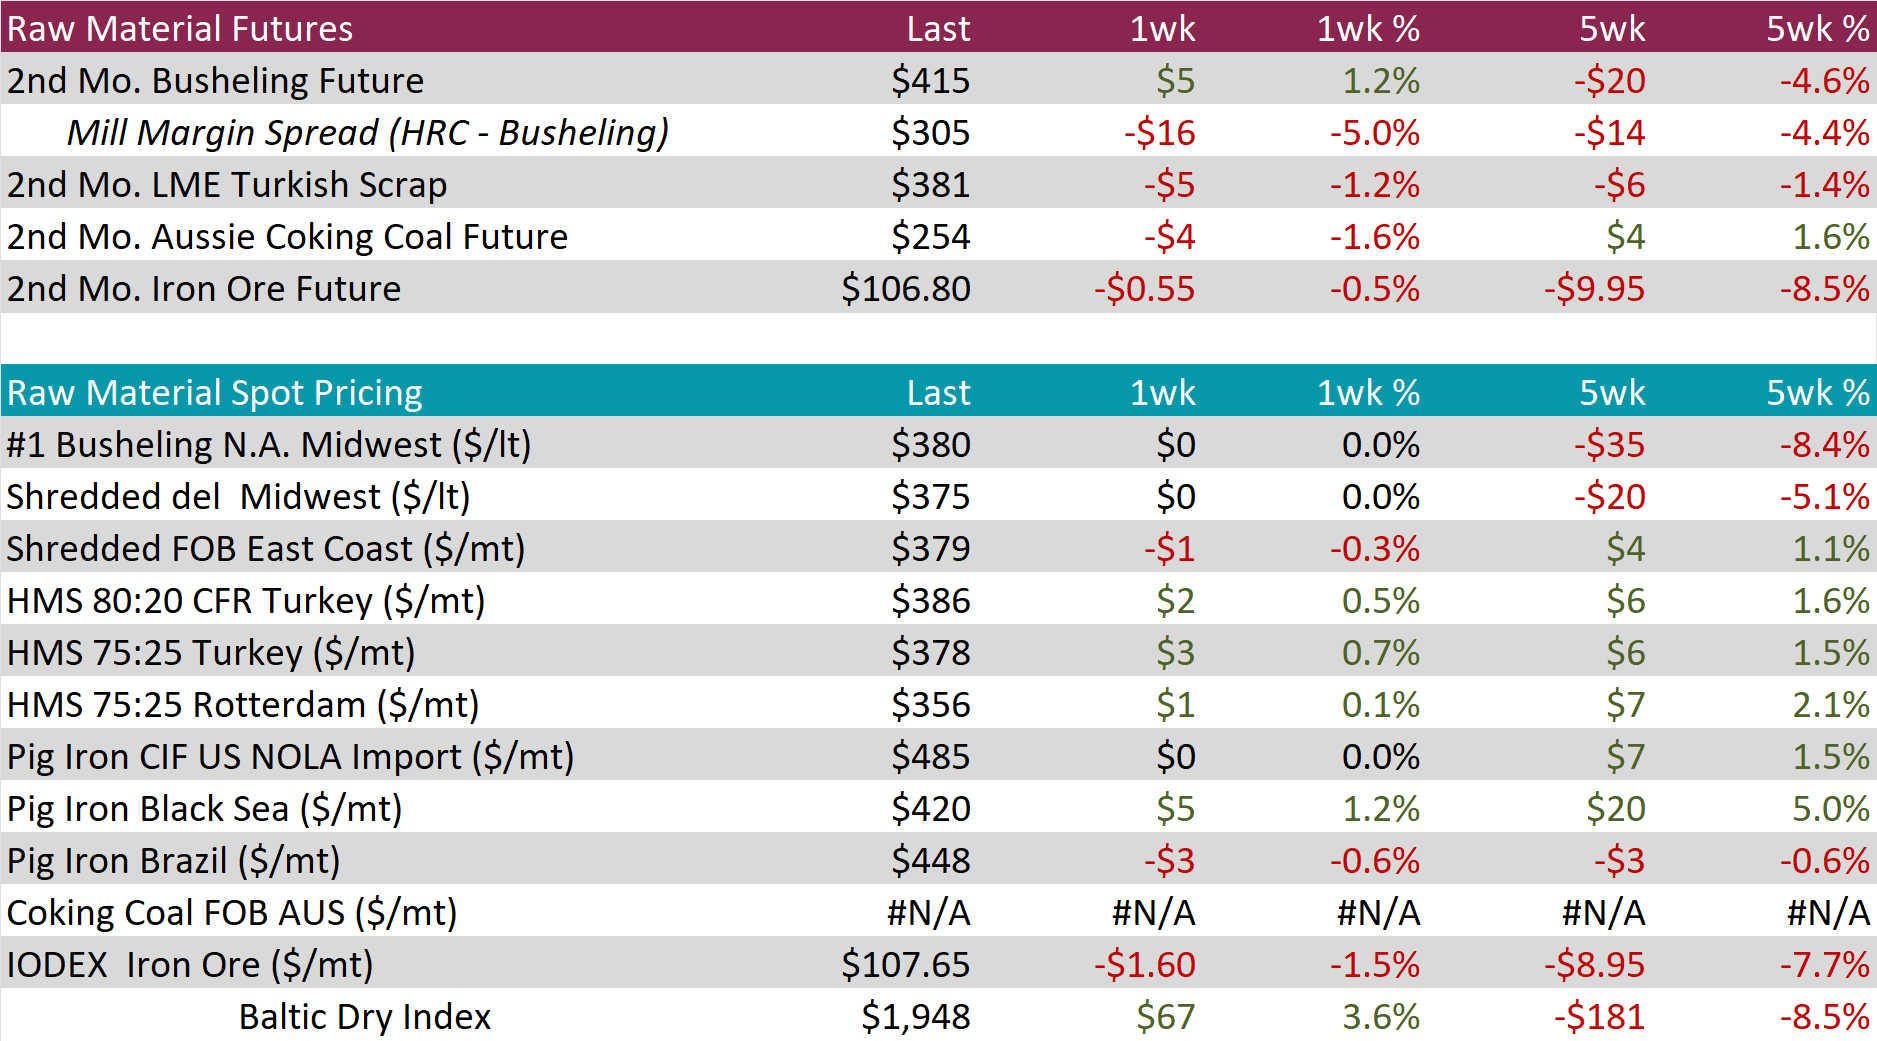
Scrap
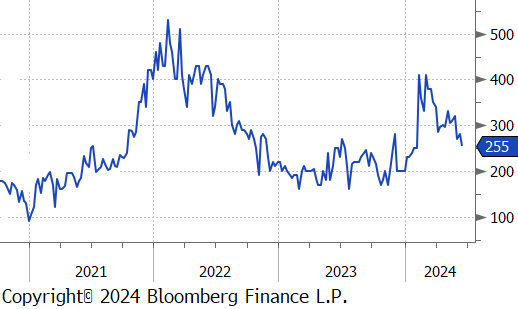
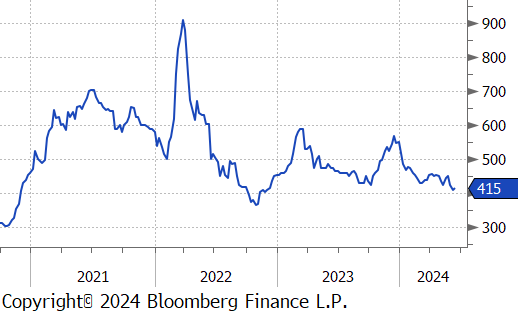
The 2nd month busheling future inched up by $5 or 1.2% to $415, while the busheling spot price sits at $380 – which is its lowest price since December 2022.
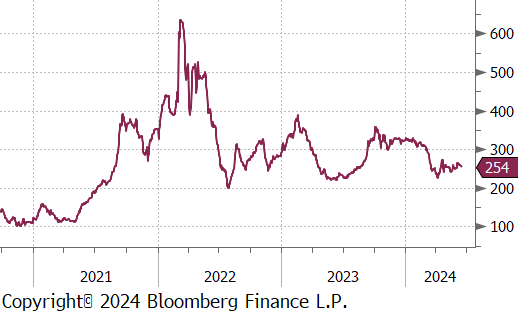
The Aussie coking coal 2nd month future fell by $4 or -1.6% to $254, marking the second consecutive week of price declines.
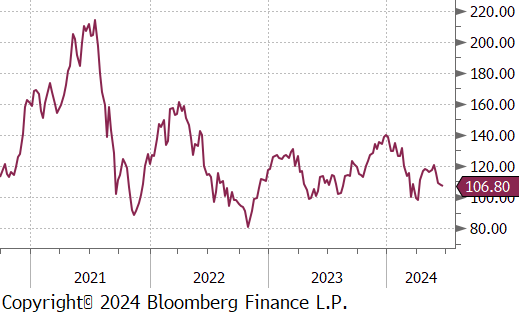
The 2nd month iron ore future declined for its third straight week, edging down by $0.55 or -0.5% to $106.80.
Dry Bulk / Freight
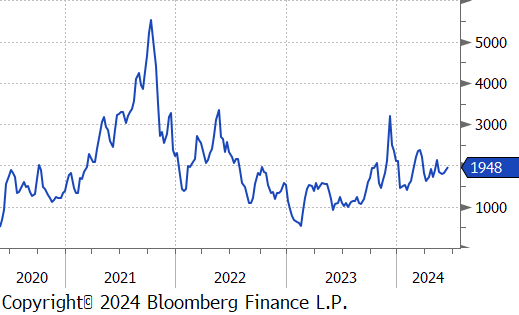
The Baltic Dry Index continued to increase for the third consecutive week, rising by $67 or 3.6% to $1,948.
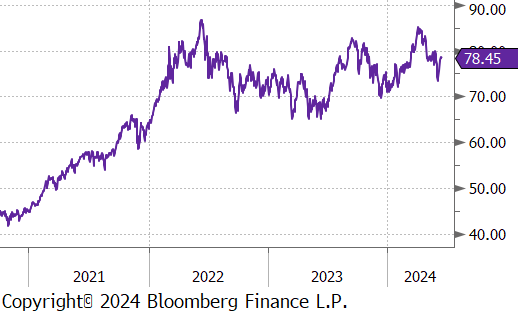
WTI crude oil future gained $2.92 or 3.9% to $78.45/bbl.
WTI natural gas future lost $0.04 or -1.3% to $2.88/bbl.
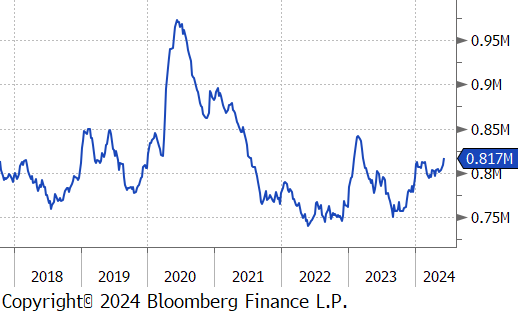
The aggregate inventory level experience a slight increase of 0.9%, climbing to its highest level since March 2023.
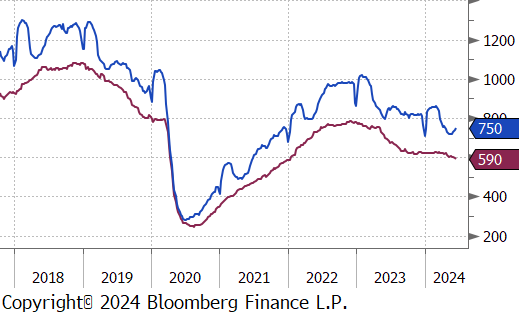
The Baker Hughes North American rig count increased by 13 rigs, bringing the total count to 750 rigs. At the same time, the US rig count reduced by 4 rigs, bringing the total count to 590 rigs, furthering its decline.

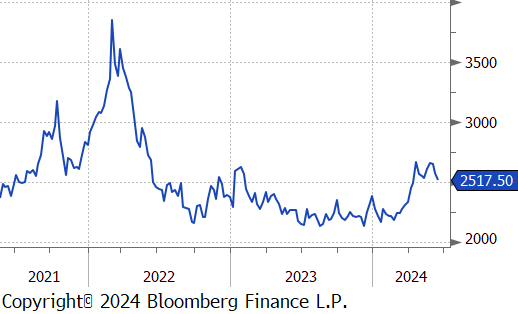
Aluminum futures fell by $61 or -2.3% to $2,518, as soft demand and signs of robust supply, contributed to a broader downturn in base metals. In Yunnan, a key Chinese production region, heavy rainfall boosted hydropower availability, enabling smelters to reactivate previously idled capacity. This development alleviated earlier concerns that dry weather might hinder production, resulting in a 7.2% increase in China’s aluminum output to a record 3.65 million tons in May. This surge occurred despite Rio Tinto declaring force majeure on alumina shipments from its Australian refineries due to gas shortages. Additionally, softening demand in China exacerbated the downward pressure on prices. Industrial output slowed more than anticipated in May, and a significant drop in housing prices darkened the outlook for aluminum-intensive construction sectors.
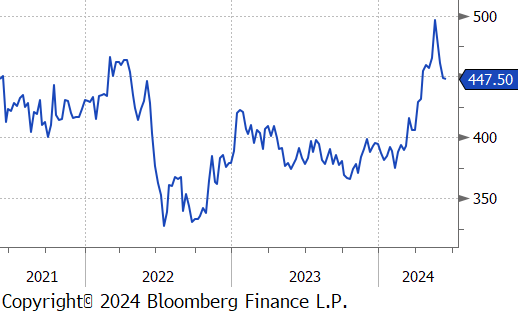
Copper futures edged down by $0.85 or -0.2% to $448, hitting a two-month low, driven by signs of weakening near-term demand. In China, the leading consumer of copper, industrial output decelerated more than expected in May. Additional economic indicators in the country such as a rapid decline in housing prices, slowing fixed-asset investment, and a contractionary official manufacturing PMI further underscored concerns that demand is unlikely to rebound in the near-term. As a result, copper inventories in China remained near their highest levels since 2020, defying typical seasonal trends that usually lead to inventory drawdowns. Consequently, the price for copper deliveries from Shanghai bonded warehouses continued to trade at a discount to LME prices for an entire month. Despite the recent downturn, copper prices are still up 10% year-to-date, buoyed by speculative investments based on anticipated shortages. Copper’s critical role in electrification, including applications in grid-scale energy storage and data-center infrastructure, continues to fuel these speculations, compounded by challenges associated with launching new mining projects for fresh ore supply.
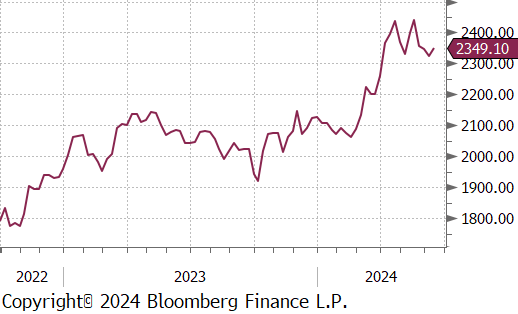
Gold climbed by $24.10 or 1.0% to $2,349, amid pressure from rising US Treasury yields. Investors are now awaiting further indicators to better understand the Fed’s monetary policy direction. This week, traders will be keenly watching statements from Fed officials and key economic reports including retail sales, industrial production, and S&P Global PMIs, to evaluate the likelihood of multiple rate cuts this year. This scrutiny follows recent US inflation data suggesting a cooling trend, even though the Fed’s latest projections indicate only one rate cut. Internationally, gold demand remained subdued in India last week, and in China—gold’s largest market—premiums fell due to dampened sentiment and elevated spot prices.
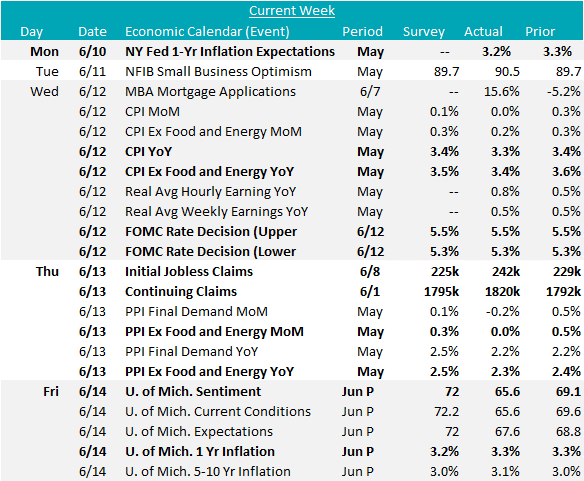
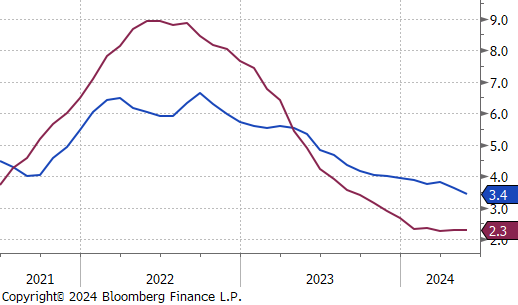
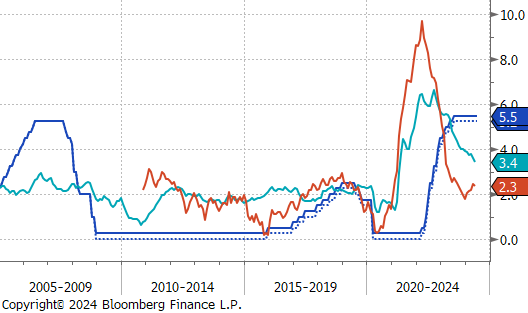
Both CPI (Consumers) & PPI (Producers) inflation data were released this week and provided encouraging signals after MoM readings remained stubbornly higher to start the year. May Topline CPI YoY came in at 3.3%, down from last months 3.4% and below an expected flat print. The disinflationary move was even more pronounced for Core CPI YoY, printing down to 3.4%, below the expected 3.5% and well under the 3.6% from April. May’s Core PPI YoY was also encouraging, printing down to 2.3%, down from last month’s 2.4% reading and in stark contrast to the median forecaster expectation of a resurgence to 2.5%.
There are two additional pieces of context needed with this months better than expected prints. First, forward looking consumer expectations continue to run hot – University of Michigan 1yr inflation came in above expectations, printing flat at 3.3%, while the NY FED 1yr inflation expectation printed at 3.2%, down from last months 3.3%. Both are only slightly below the current CPI, suggesting that consumers are expecting sticky price pressure. Second, FED officials continue to suggest that the current disinflationary trend is not enough, and they will need to see more before they are confident, that inflation is headed back to their target of 2%.
On that note, the FOMC Rate Decision also came out this week. As expected, they held rates steady at 5.25-5.5%, but what was slightly surprising was the hawkish push in the dots (their projection for where rates will go). Here the median forecast went from 3 to 1 cuts in 2024, and from 3 to 4 cuts in 2025. Essentially pushing back, the timeframe and removing 1 cut altogether over the next 18 months. Also of note, the long-term expected rate was inched higher from 2.6% to 2.75%.
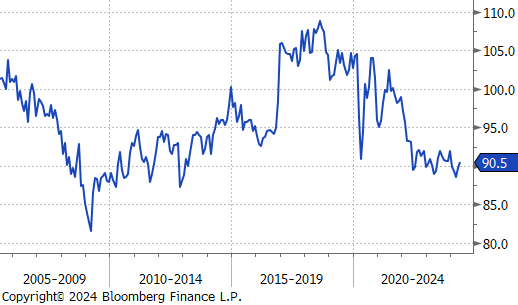
Finally, the NFIB Small Business Optimism rose above expectations of a flat print at 89.7, up to 90.5, and at the highest level of the year. The report clearly highlights some of the headwinds that we have referenced in the industrial sector because of sustained level of restrictive interest rates, however, the trend is an encouraging sign.