Flack Capital Markets | Ferrous Financial Insider
June 21, 2024 – Issue #437
June 21, 2024 – Issue #437
Overview:
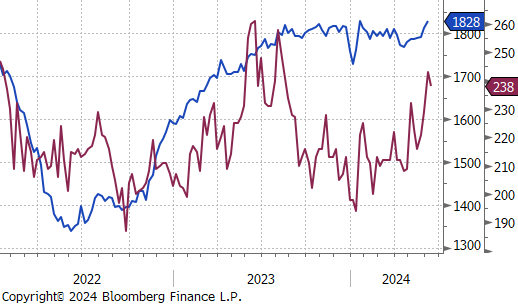
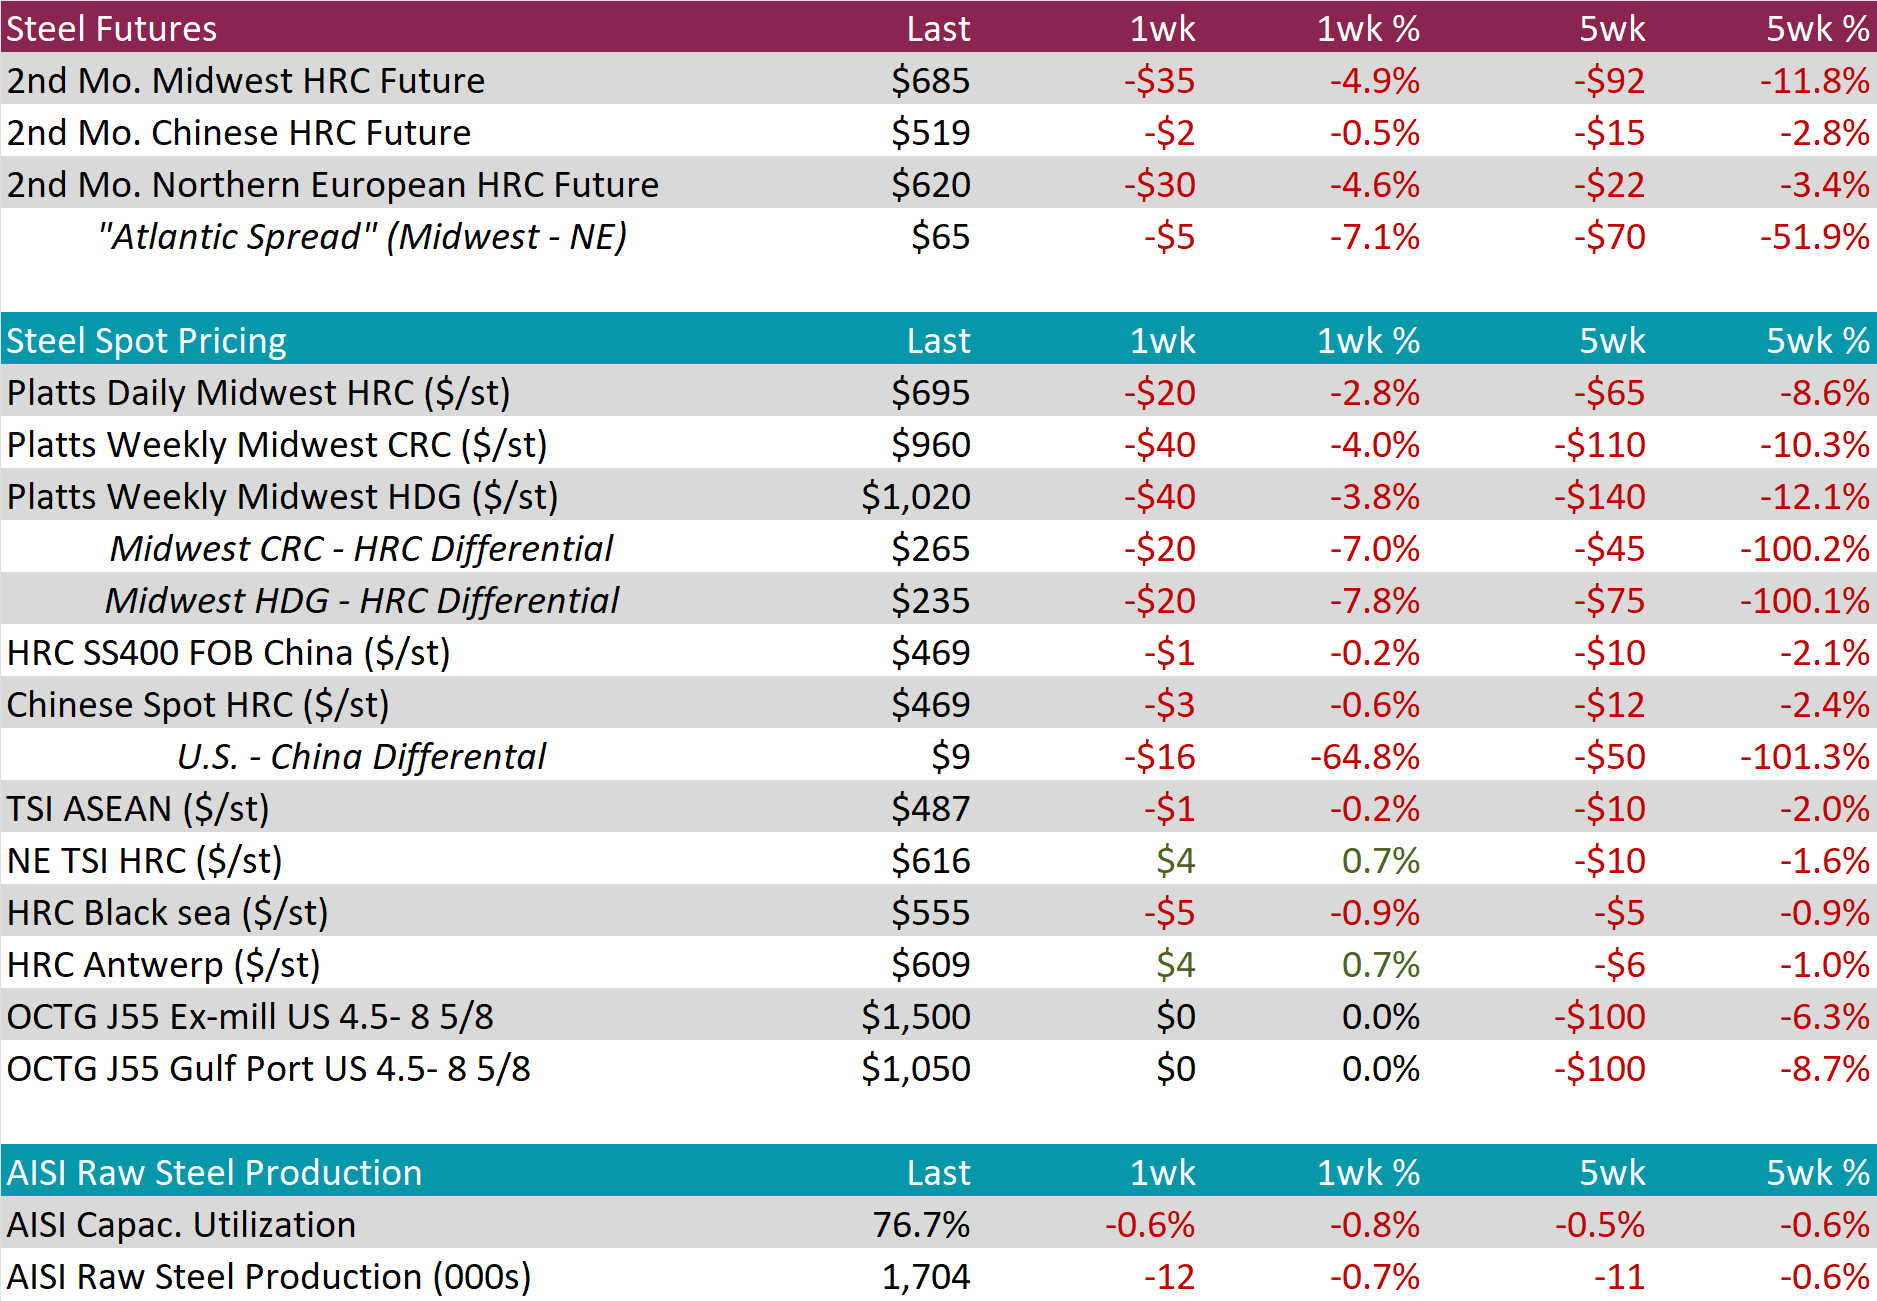
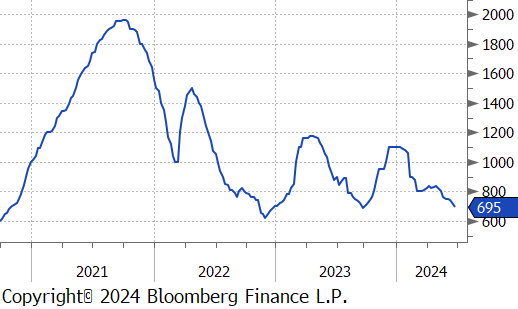
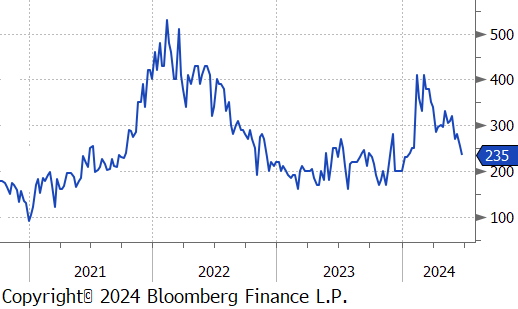
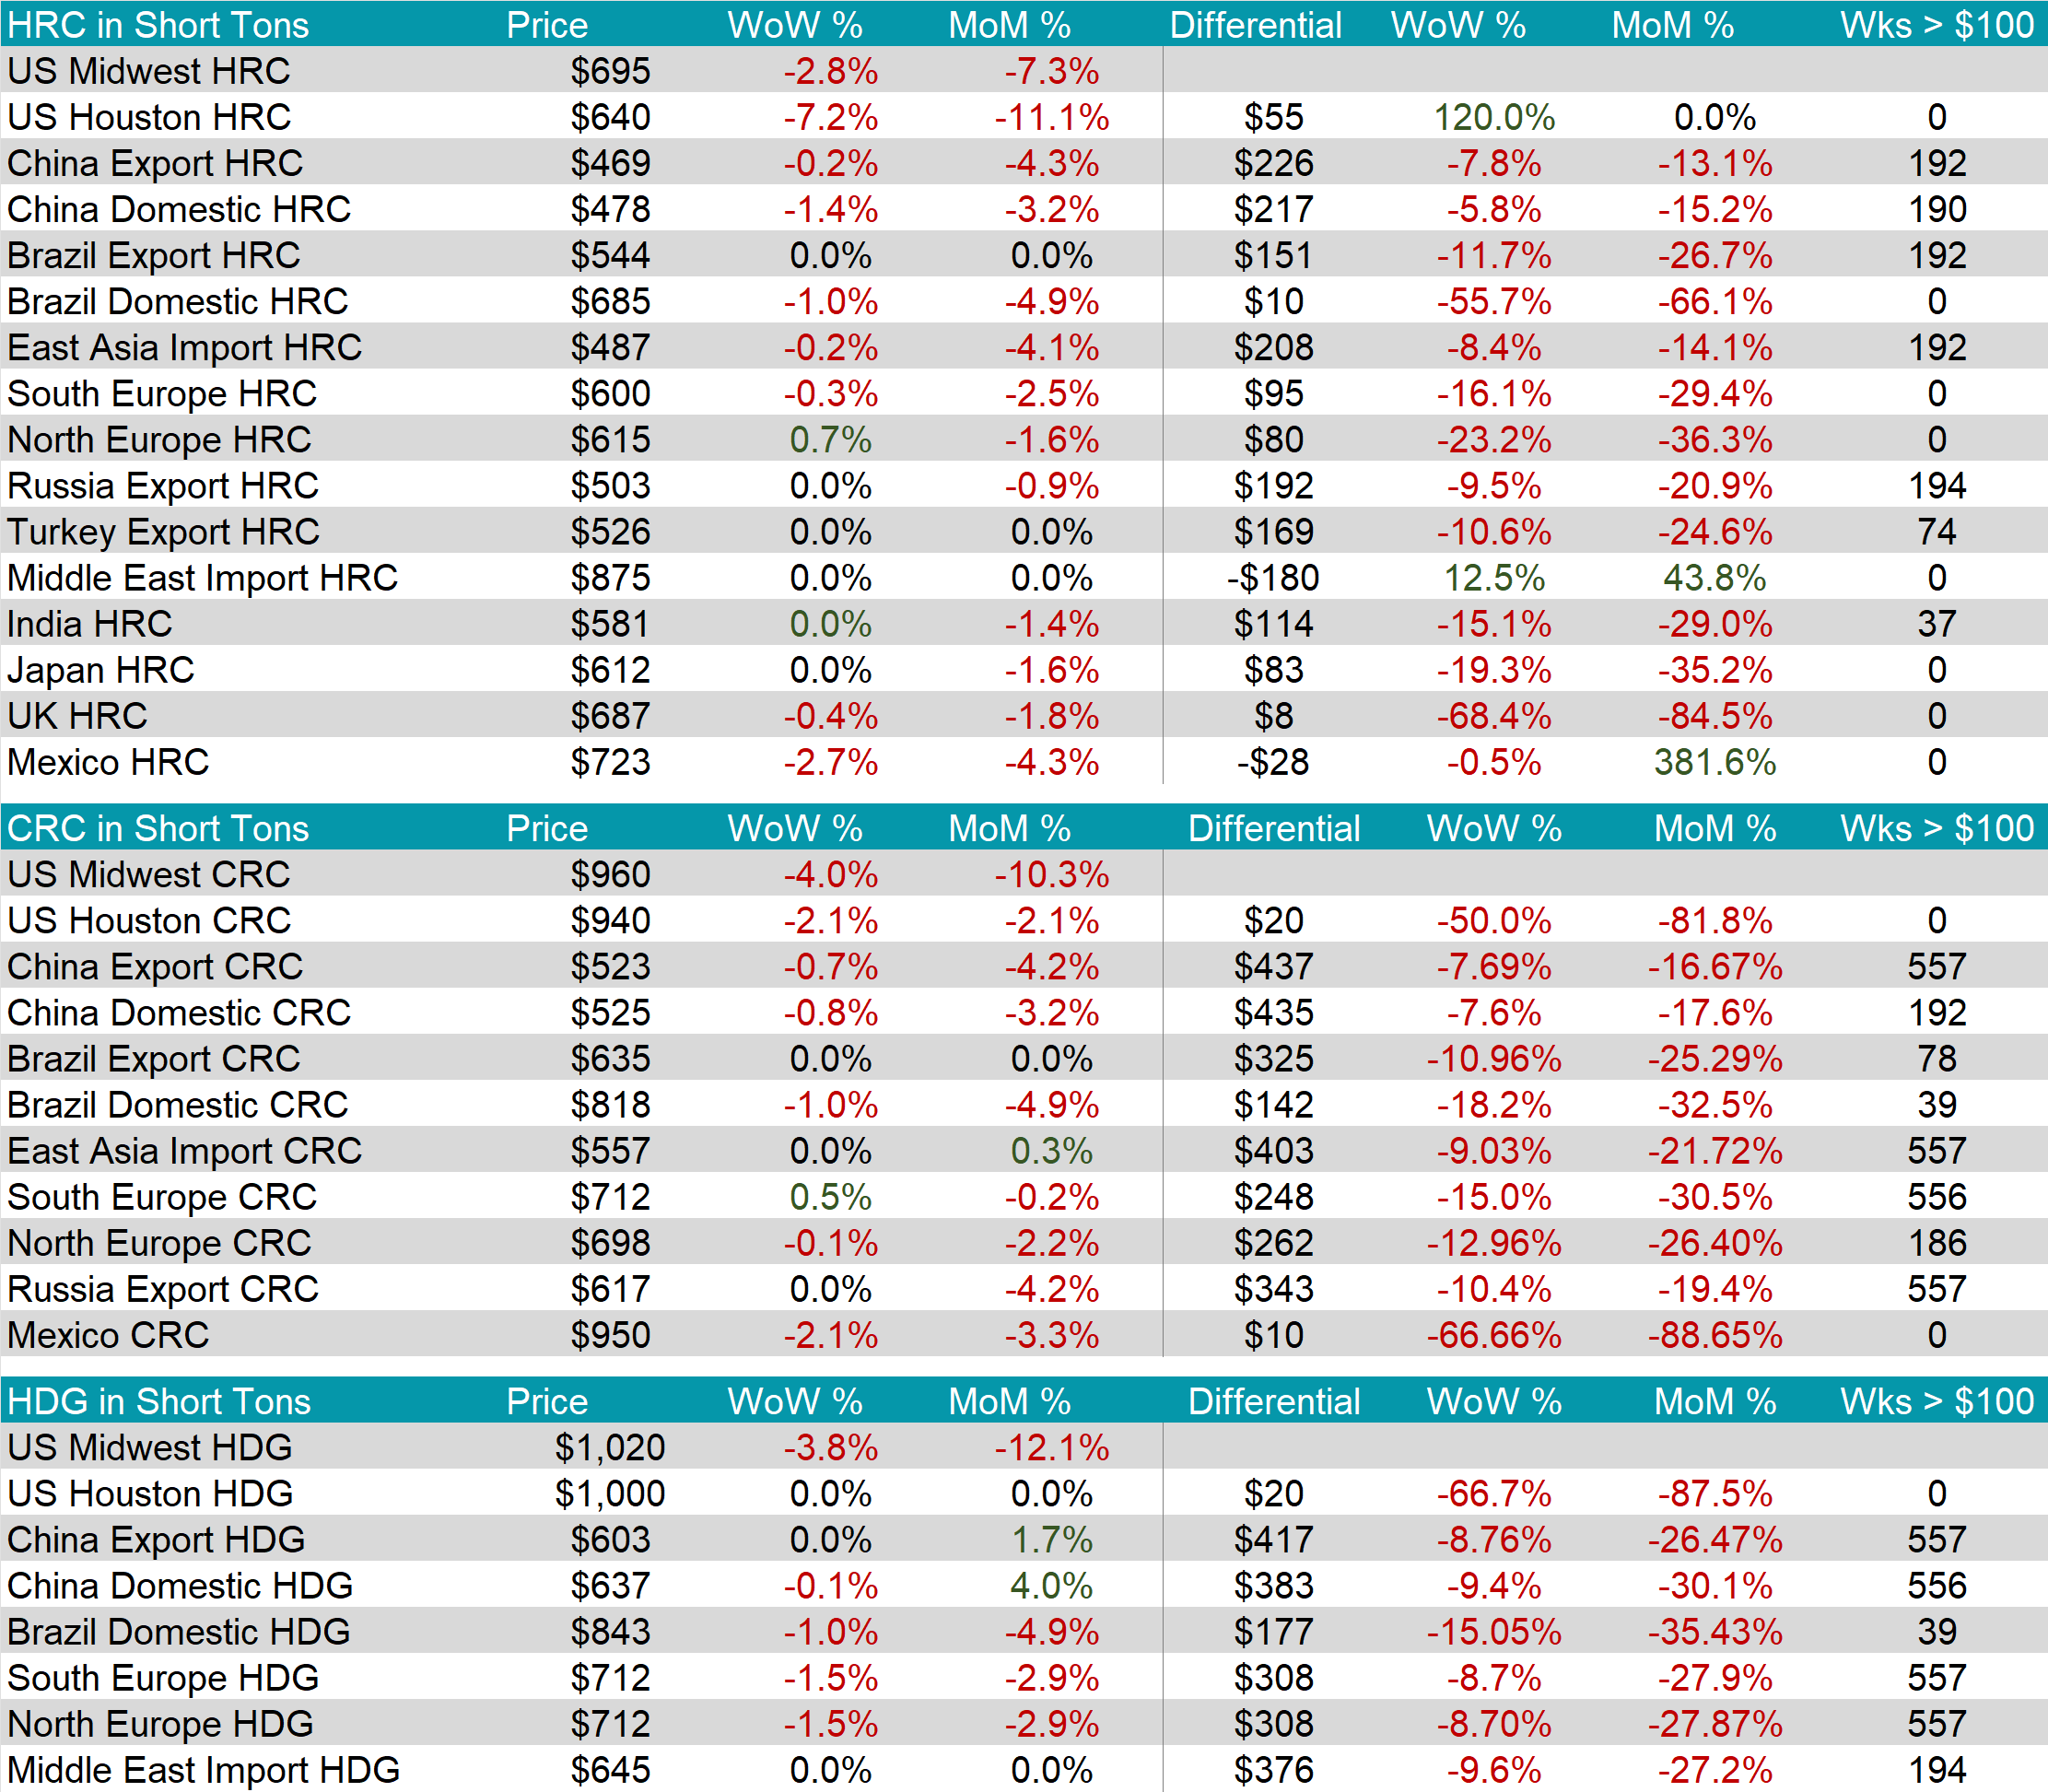
The HRC spot price dropped by $20 or -2.8% to $695, falling below $700 for the first time since September 2023. At the same time, the HRC 2nd month future declined by $35 or -4.9% to $685, similarly dipping below $700 for the first time since September 2023.
Tandem products both fell by $40, resulting in the HDG – HRC differential to decrease by $20 or -7.8% to $235.
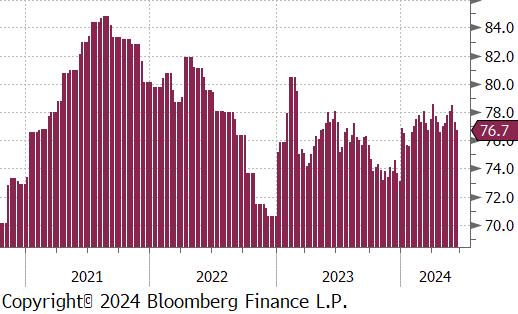
Mill production retreated further, with capacity utilization ticking down by -0.6% to 76.7%, bringing raw steel production down to 1.704m net tons, reaching its lowest level since April.
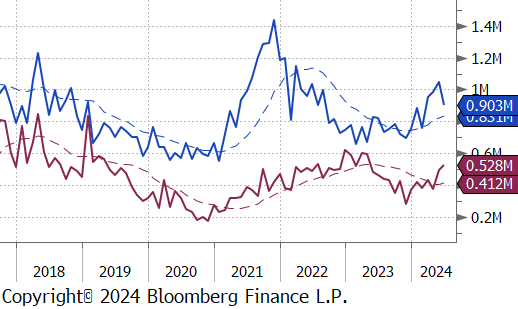
June Projection – Sheet 903k (down 142k MoM); Tube 528k (up 34k MoM)
May Projection – Sheet 1046k (up 59k MoM); Tube 494k (up 118k MoM)
All watched global differentials contracted, with N Europe HRC experiencing the only price increase this week, which was 0.7%, while China HRC (-1.4%) and Mexico HRC (-2.7%) had the biggest price declines. Another notable price move was US Houston HRC dropping by -7.2%.
Scrap
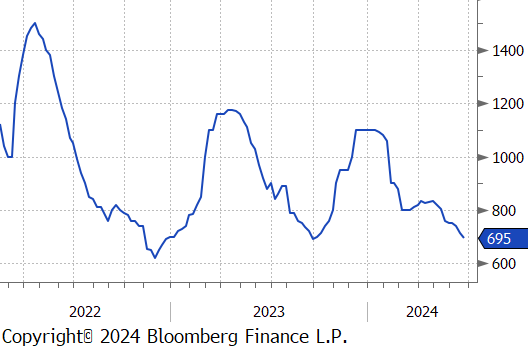
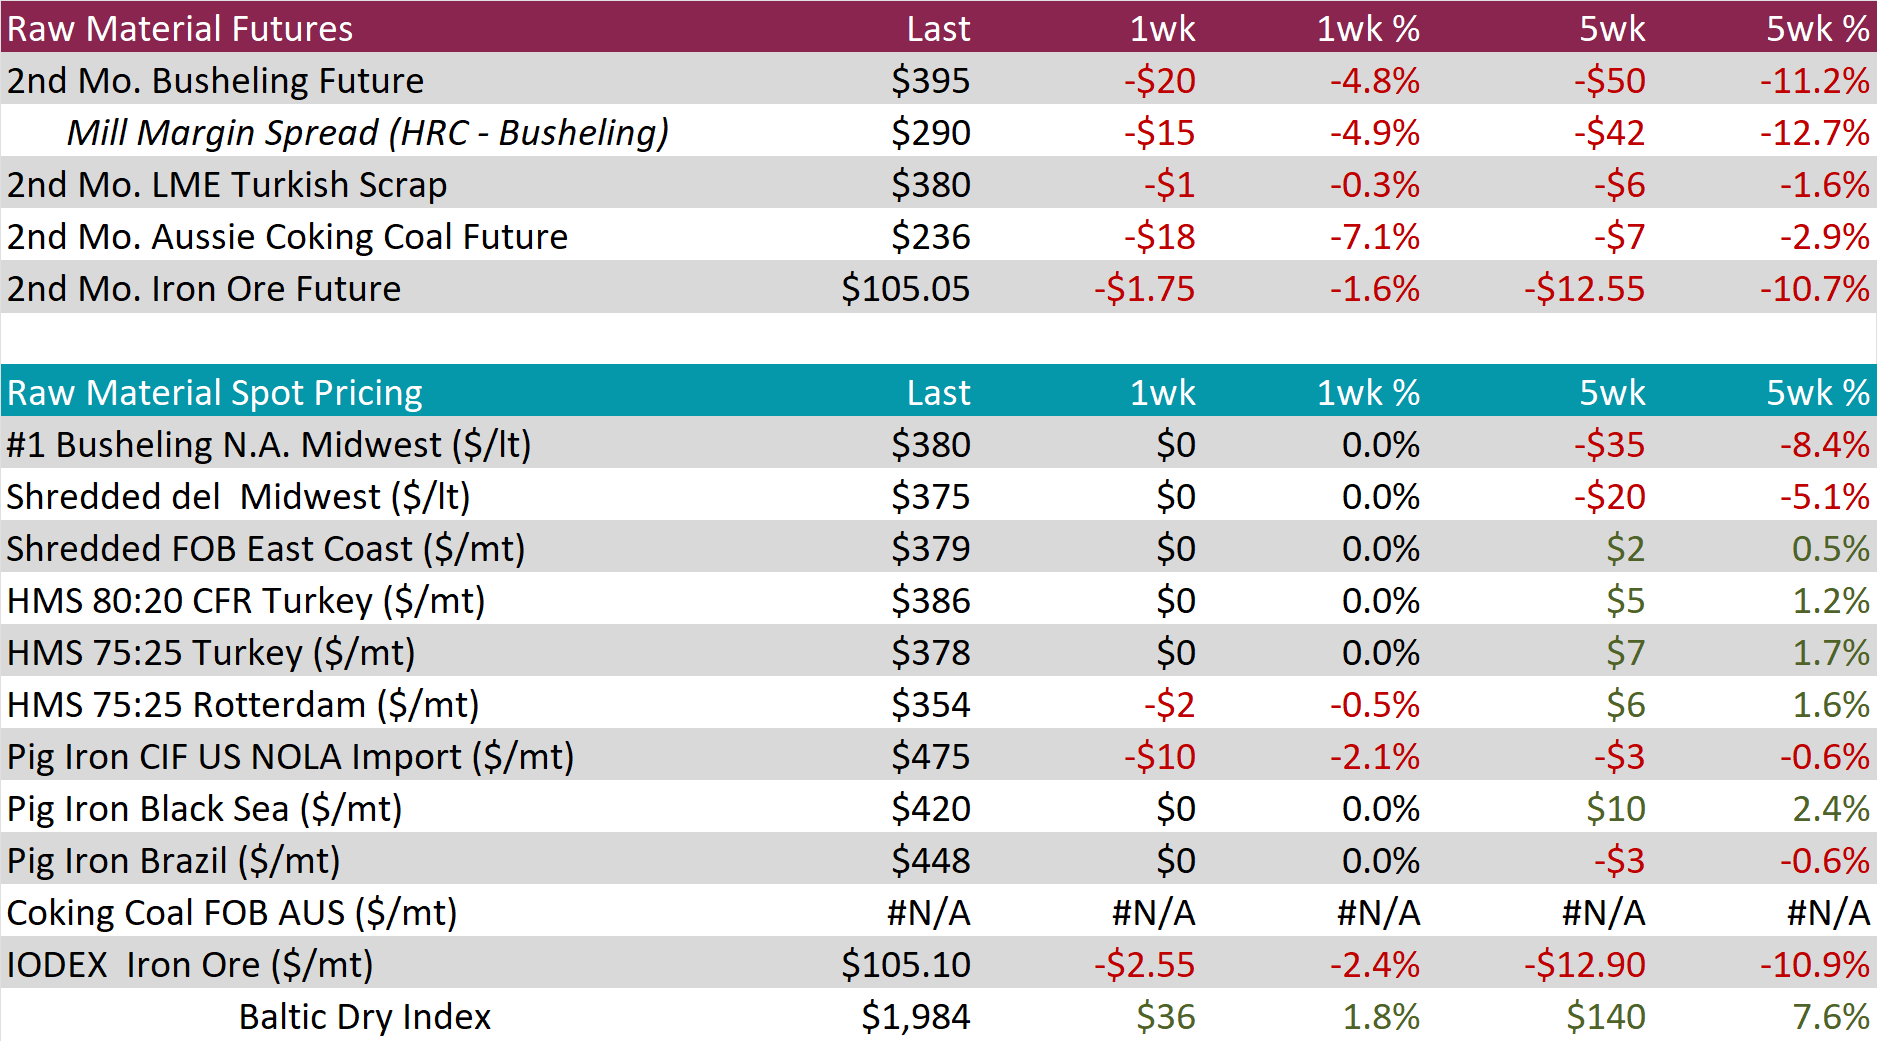
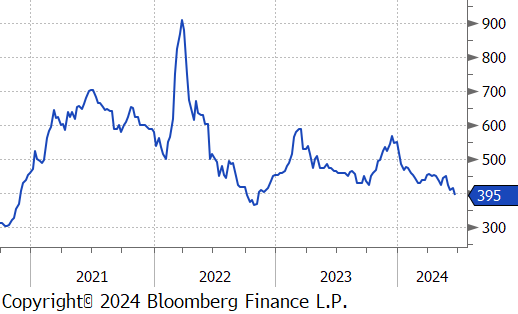
The 2nd month busheling future dropped by $20 or -4.8% to $395, breaking below $400 and hitting its lowest price since November 2022.
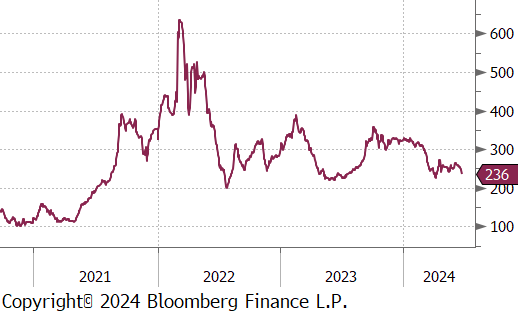
The Aussie coking coal 2nd month future fell by $18 or -7.1% to $236, reaching its lowest price since April and causing the 5-week price change to be down by $7 or -2.9% as it continues to bounce around in this price range.
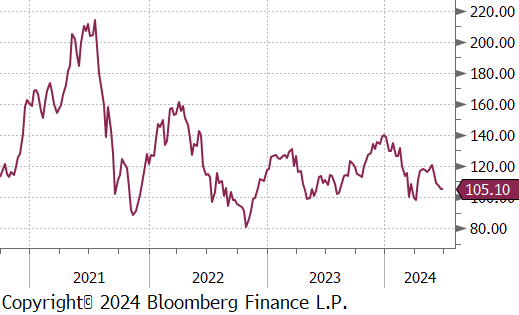
The 2nd month iron ore future dipped by $1.75 or -1.6% to $105.05, marking its fourth week of consecutive price declines.
Dry Bulk / Freight
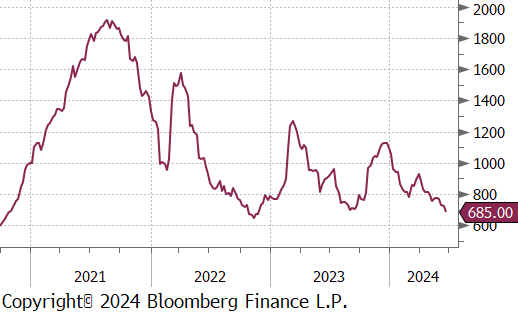
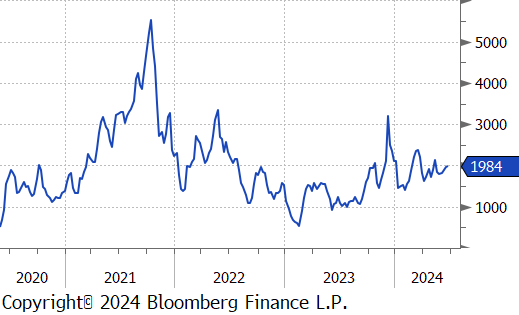
The Baltic Dry Index rose by $36 or 1.8% to $1,984, marking its fourth straight week of price increases, nearing its recent price high of $2,129 touched six-weeks ago.
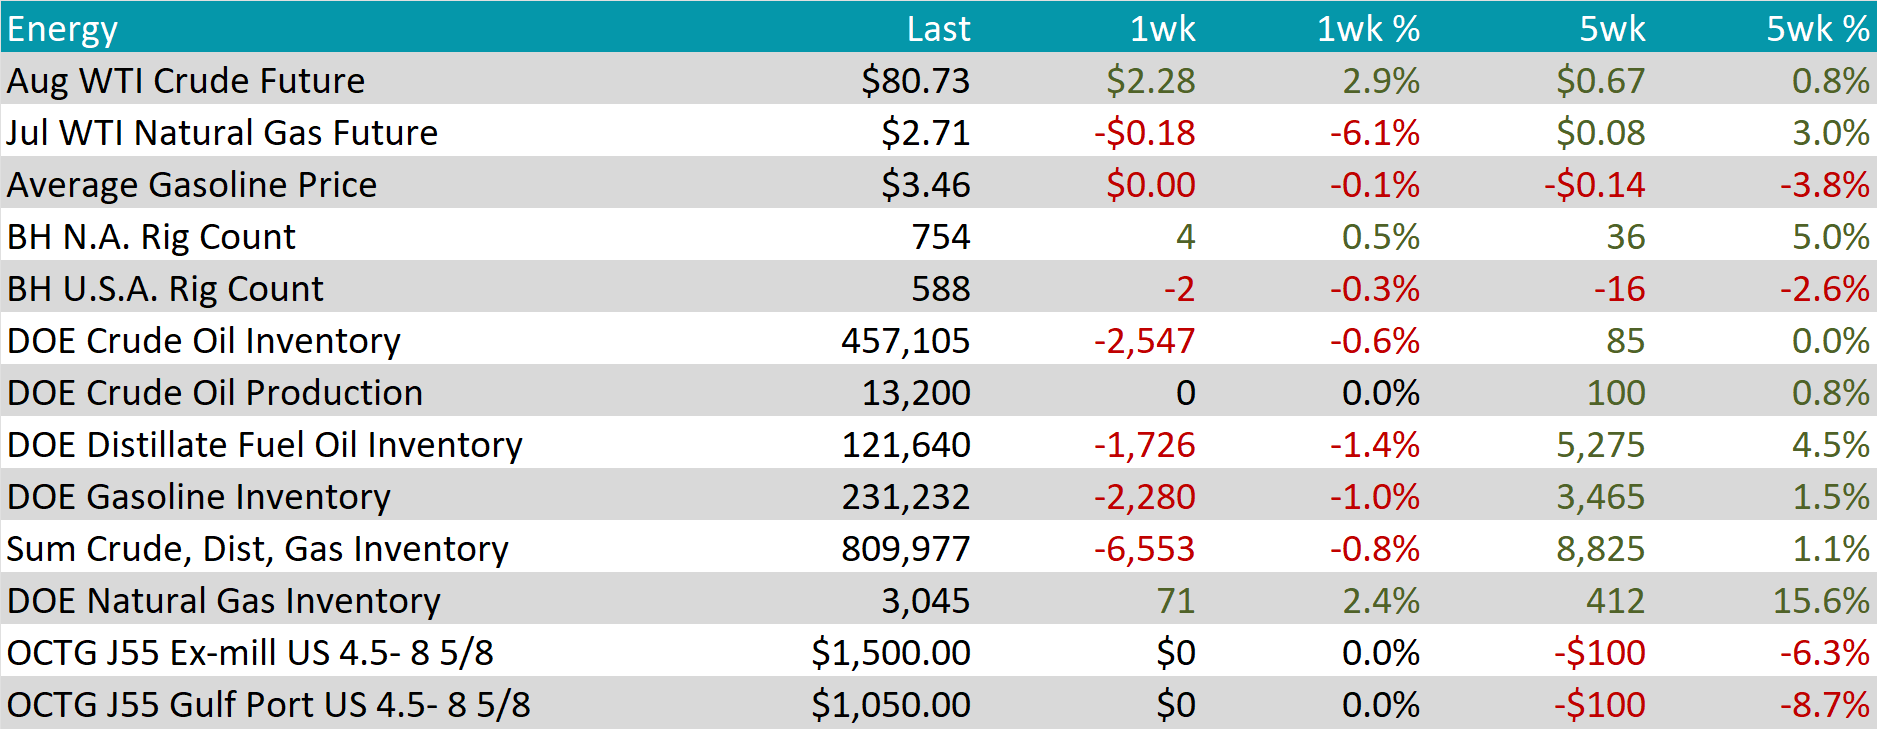
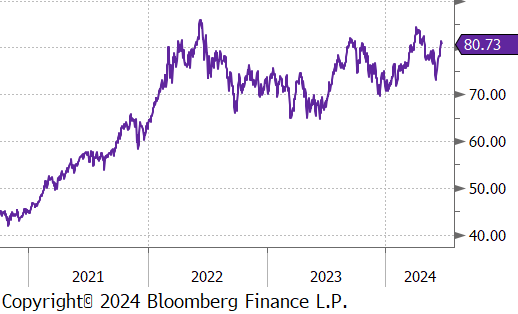
WTI crude oil future gained $2.28 or 2.9% to $80.73/bbl, breaking back through to the $80 price level.
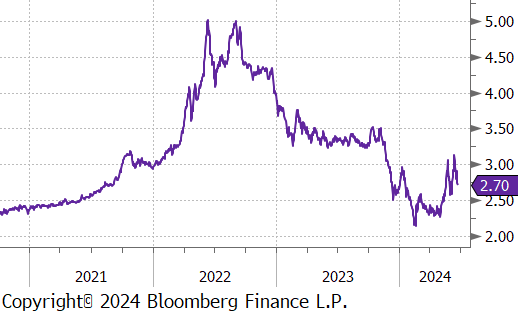
WTI natural gas future lost $0.18 or -6.1% to $2.71/bbl.
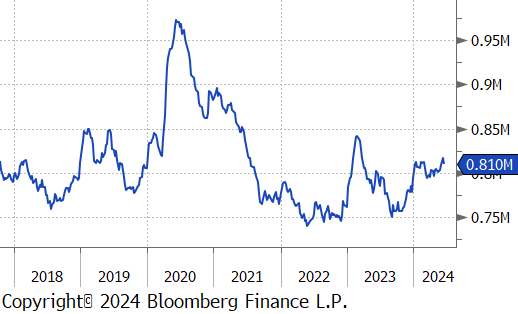
The aggregate inventory level experienced a slight decrease of -0.8%.
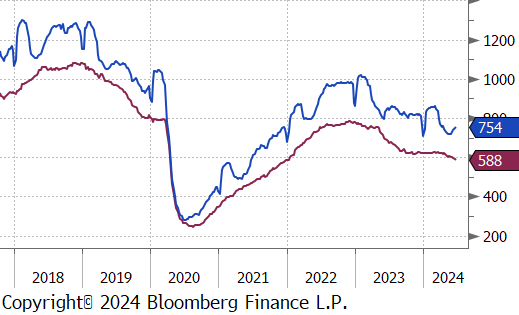
The Baker Hughes North American rig count continued to increase, adding 4 rigs this week, bringing the total count to 754 rigs. Meanwhile, the US rig count slipped further, reducing by 2 rigs, bringing the total count to 588 rigs.
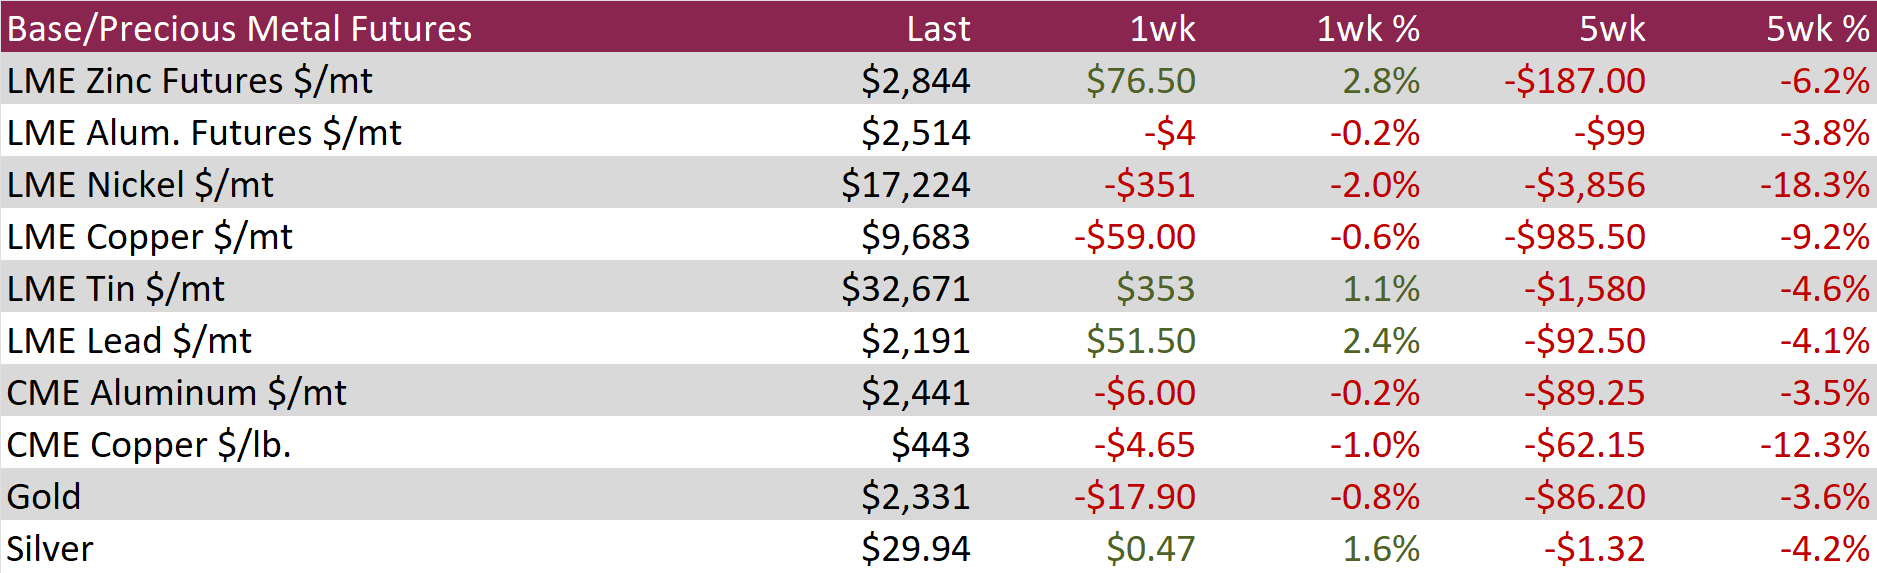
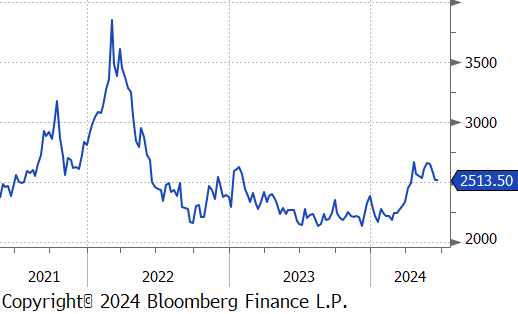
Aluminum futures edged lower by $4 or -0.2% to $2,514. This decline mirrors trends in other base metals, driven by weak demand and a notable increase in supply. In China’s Yunnan province, heavy rains improved hydropower availability, enabling smelters to reactivate idled capacity. Consequently, China’s aluminum output surged by 7.2% year-on-year to a record 3.65 million tons in May, despite Rio Tinto’s force majeure on alumina shipments from its Australian refineries due to gas shortages. Additionally, weak demand in China exacerbated the bearish trend. Industrial production slowed more than anticipated in May, and falling housing prices further clouded the outlook for aluminum demand in construction.
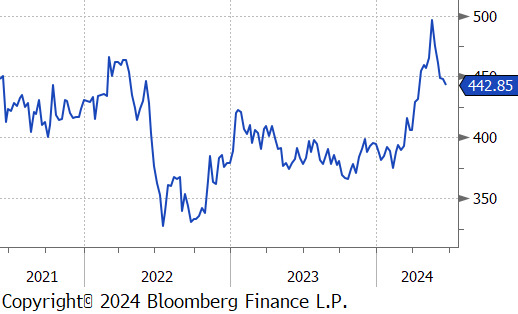
Copper futures dropped below $445, falling by $4.65 or -1.0% to $443, similarly driven by weakening demand signals. China’s industrial output in May slowed more than expected, highlighting poor industrial demand in the top copper-consuming nation. This weak demand coincided with high supply from increased smelted output from scrap, pushing Chinese copper inventories to their highest levels since 2020. Despite seasonal trends favoring a drawdown, these inventories kept Shanghai bonded warehouse delivery prices at a discount to the LME for over a month. Additionally, a dim outlook on Chinese copper demand persisted. Fiscal revenues in Beijing fell at their fastest pace in over a year in May, fueling investor concerns that the government might lack the funds to implement the promised support measures.
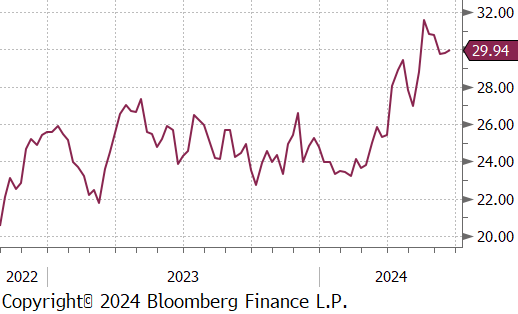
Silver inched up by $0.47 or 1.6% to $29.44. Overcapacity from extensive Chinese government support for solar panels prompted industry groups to call for reduced investment to avoid a sharper price downturn. This push to curb solar panel supply diminished manufacturers’ demand for silver inputs, countering the recent surge in silver’s industrial use that had previously boosted its performance over gold this year. Concurrently, stronger-than-expected S&P PMI results in the US bolstered expectations of hawkish Fed policies, adding pressure on bullion prices. However, dovish moves by other central banks softened the decline. The ECB and BoC began cutting rates, and the SNB enacted two rate cuts. Additionally, the BoE and PBoC are anticipated to reduce borrowing costs in the coming months.
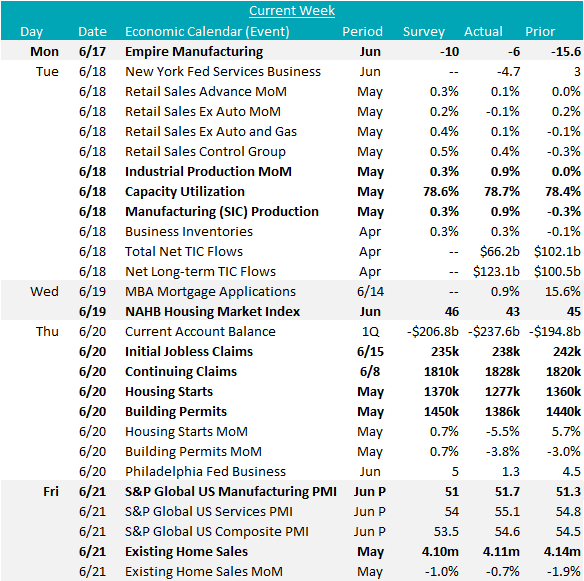
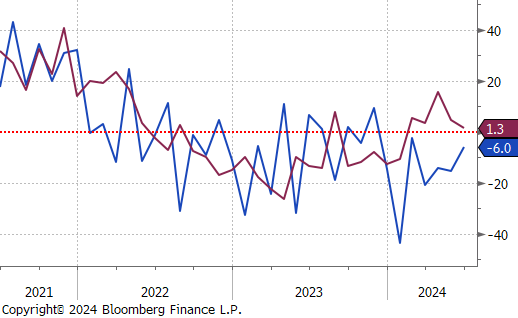
The first of the June FED Manufacturing Surveys were released with mixed results. Empire (NY) came in at -6, above expectations of -10 as well as last month’s -15.6. Philly printed at 1.3, below the expected 5, and under last month’s 4.5. Big picture, the combination of the two are slightly positive, with the upside beat in NY more significant that the downside miss for Philly, which remains slightly in expansion territory. Furthermore, the Industrial Production index came in up 0.9% MoM significantly above the expected 0.3% – driven by Manufacturing Production which mirrored the topline index. Finally, the preliminary S&P Manufacturing PMI printed at 51.7, above expectations of 51. This marks the 6th straight print in expansion territory for the index.
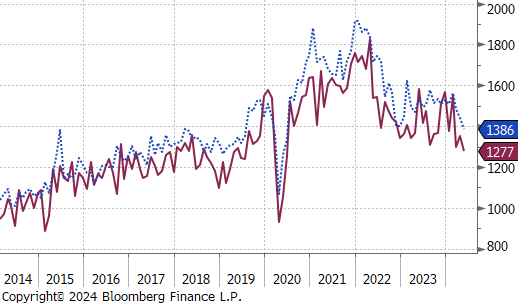
The first round of housing data for May disappointed this week. Housing starts and building permits came in down -5.5% vs expected 0.7%, and -3.8% vs. expected 0.7%, respectively. The readings for both are at their lowest levels in nearly 4 years. Existing home sales came in better than expectations but still showed a MoM decline, down 0.7% versus the expected -1%. 30yr mortgage rates above 7% continue to hamper the housing sector.
Turning to the higher frequency labor market data, we have recently seen jobless claims start to pick up. Continuing claims have now reached a “cycle peak” (although they remain historically subdued) at 1.83M, while the 5-week moving average of initial claims is at its highest level in 40 weeks. Taking a step back, neither of these readings are at levels which would be serious cause for concern, but they are telling us that the labor market might be cooling at a faster pace than before. The FED has referenced that a weak labor market would be a reason for them to start cutting rates earlier than the dots and commentary currently suggest.