Flack Capital Markets | Ferrous Financial Insider
June 28, 2024 – Issue #438
June 28, 2024 – Issue #438
Overview:
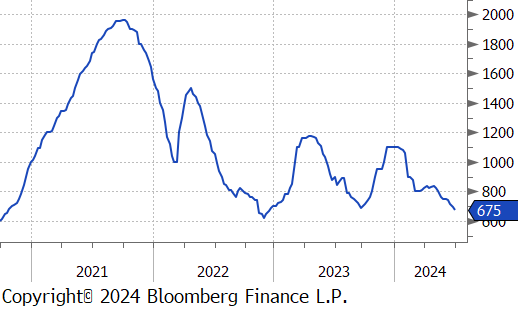
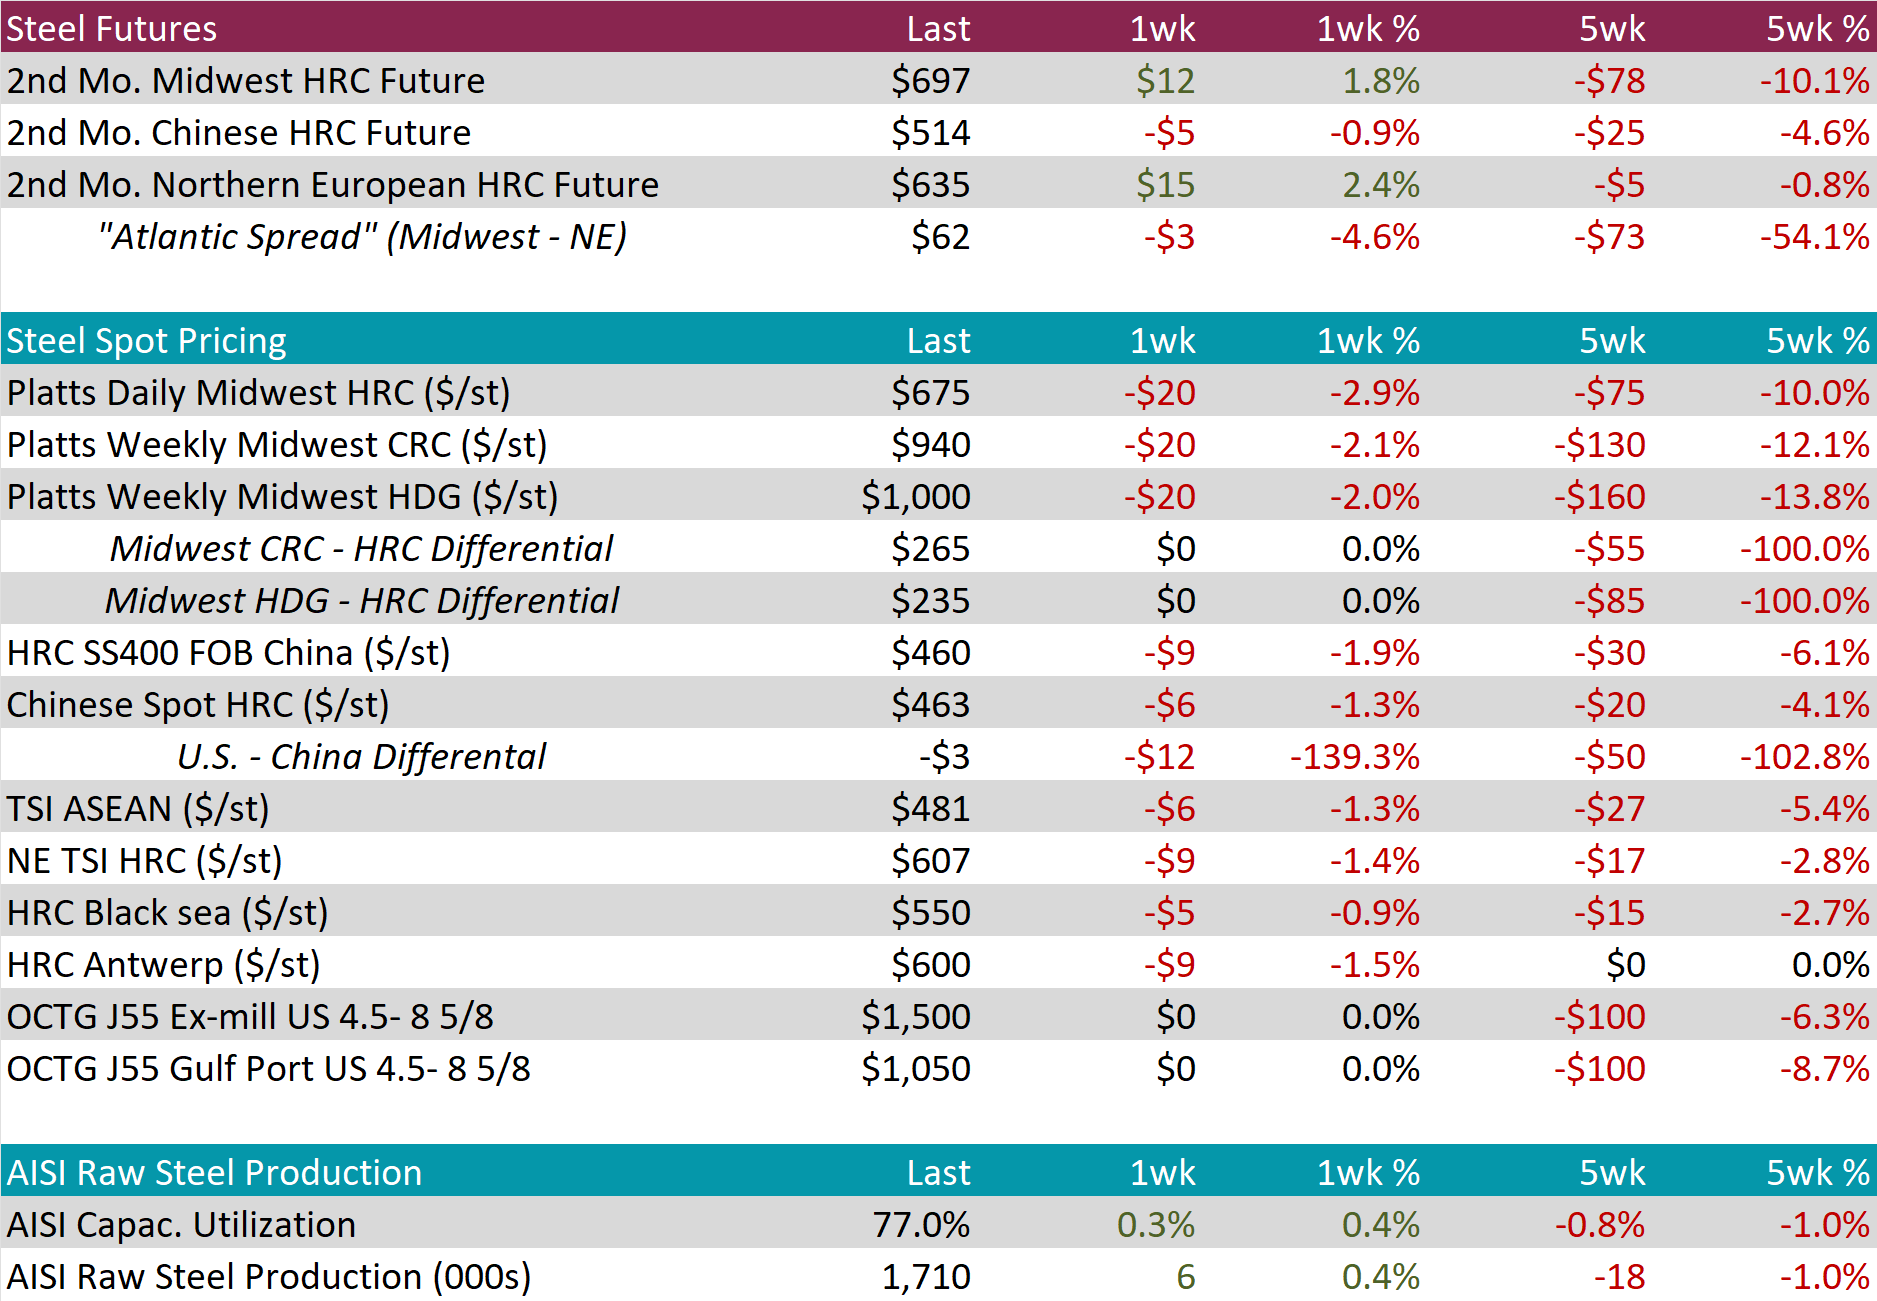
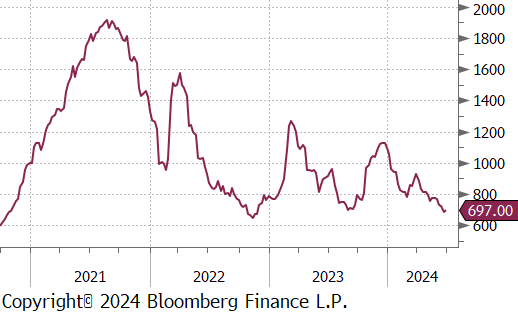
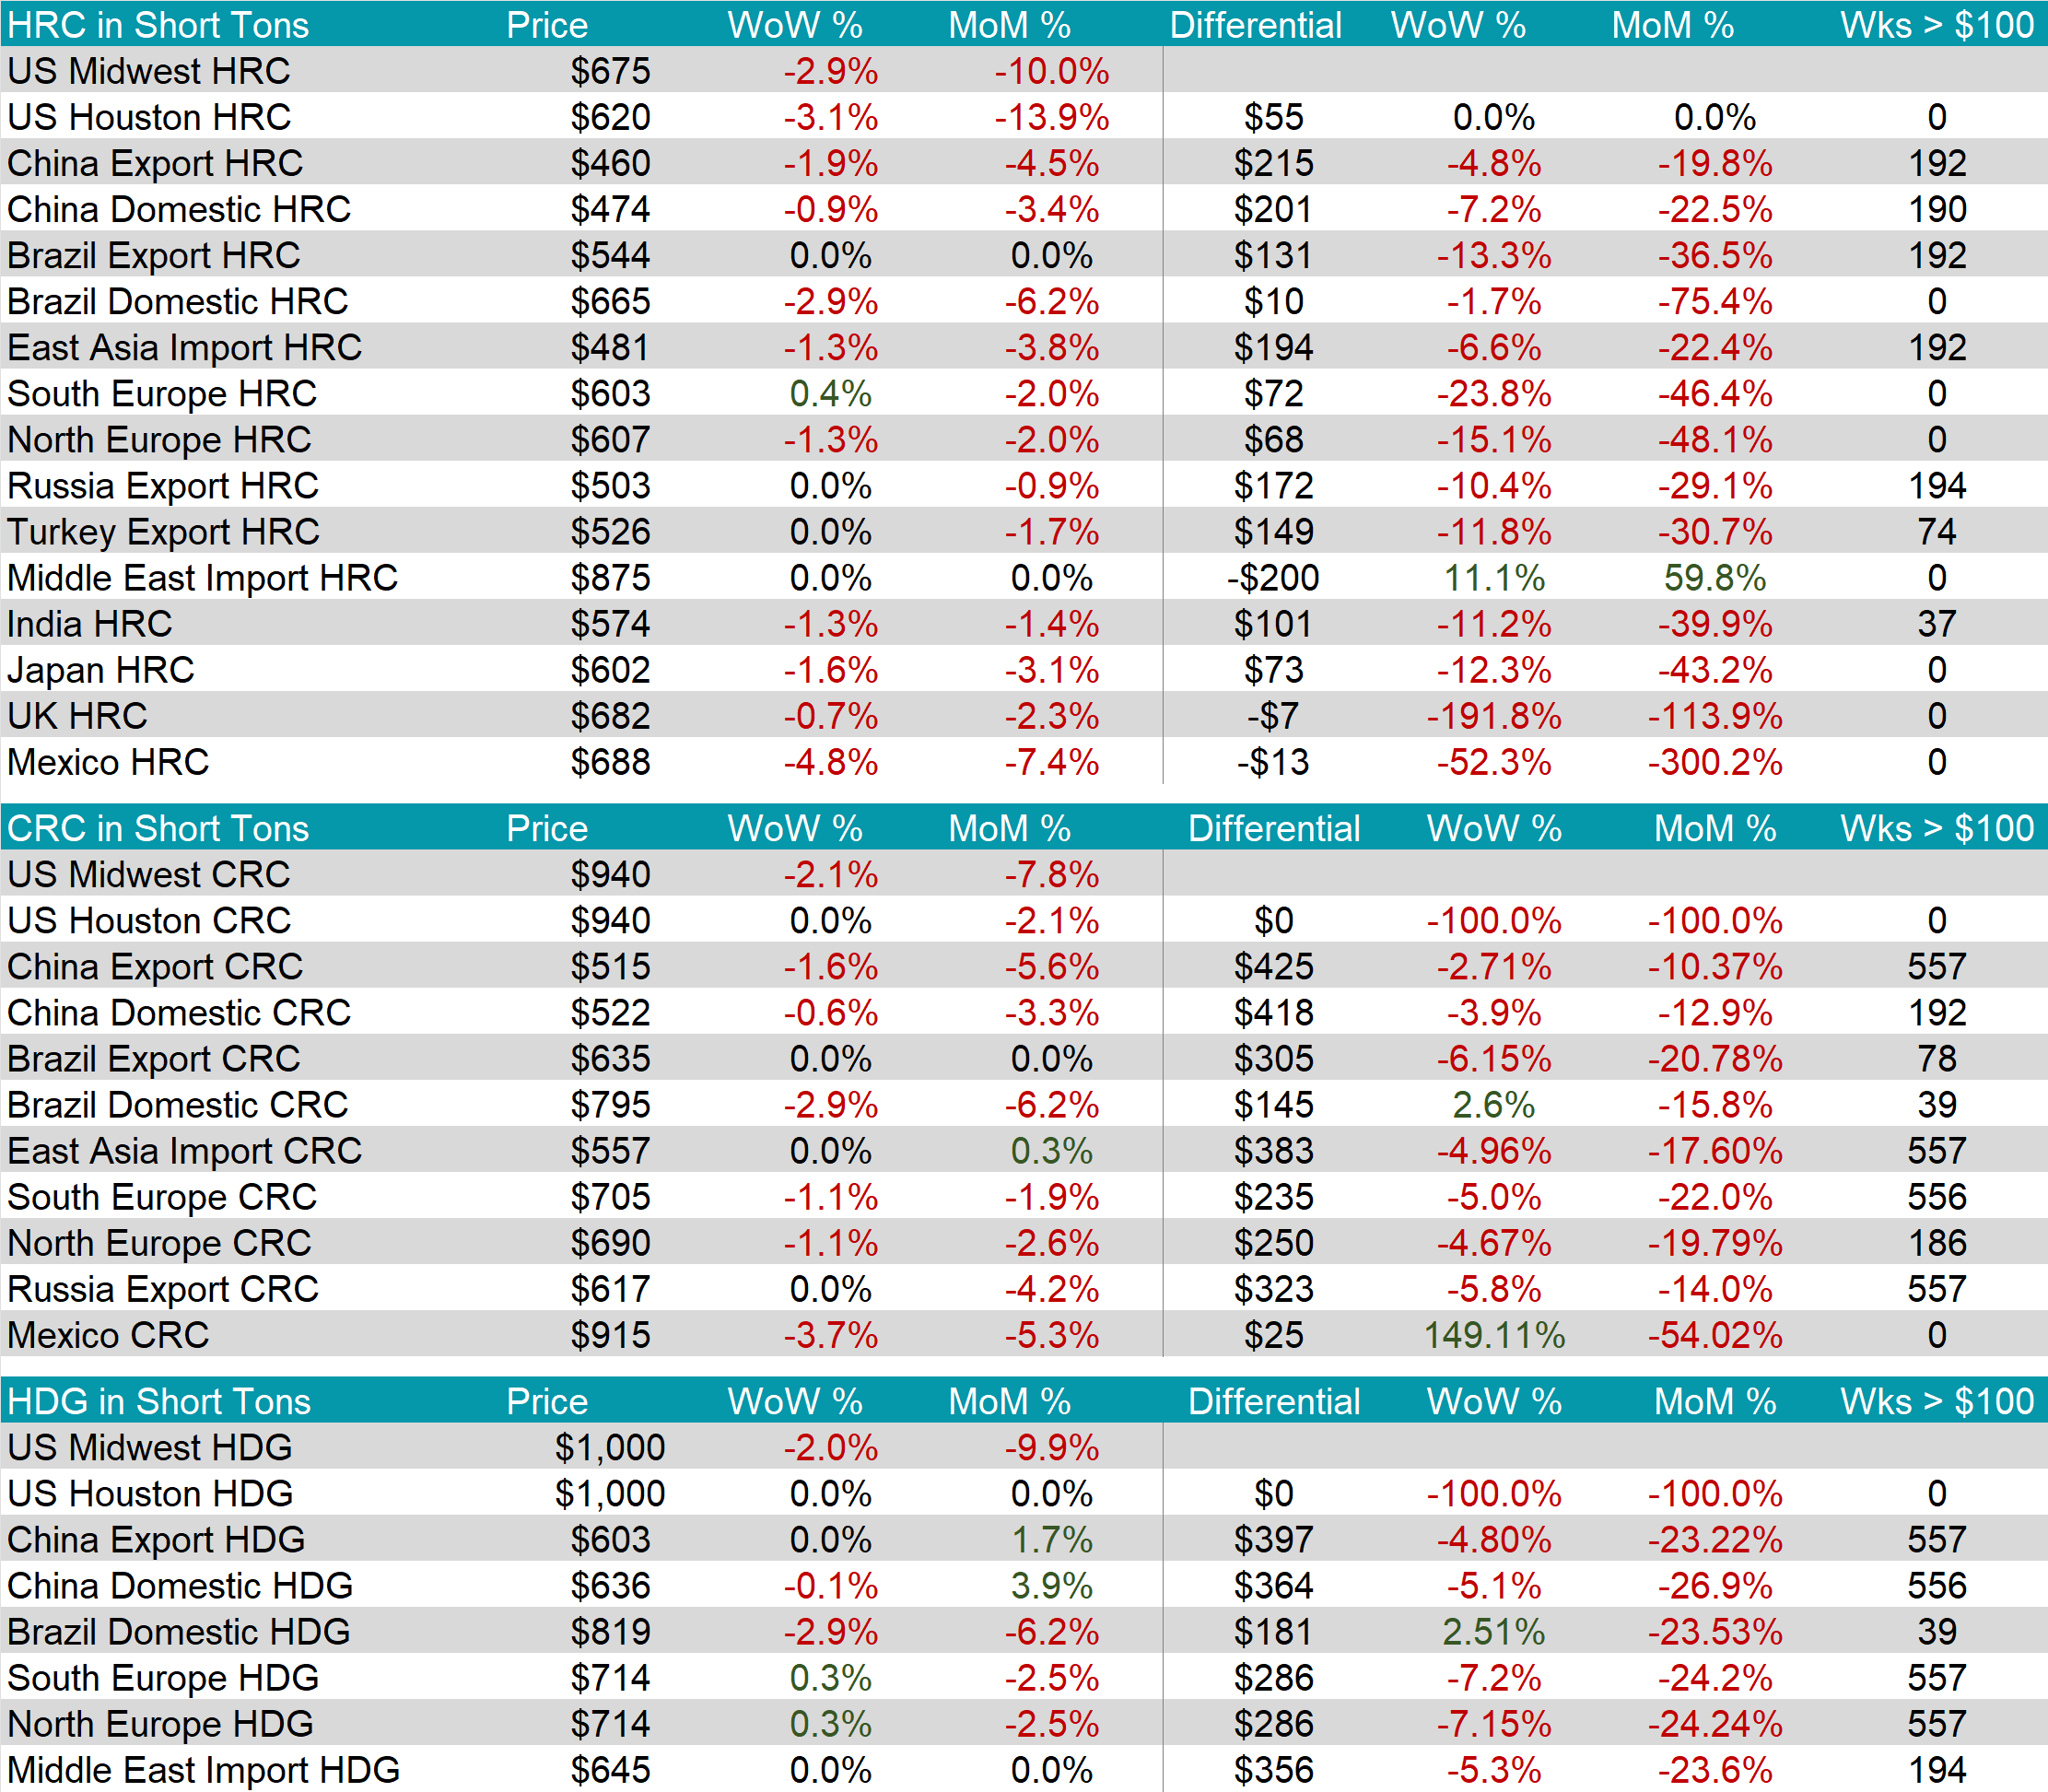
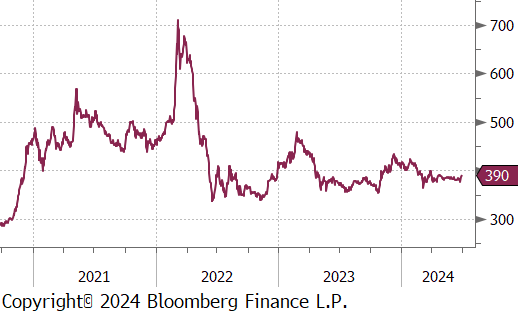
The HRC spot price fell $20 or -2.9% to $675, marking the ninth consecutive week of price declines. At the same time, the HRC 2nd month future rose by $12 or 1.8% to $697.
Furthermore, of note, the US – China differential went negative, dropping by $12 or -139.3% to -$3.
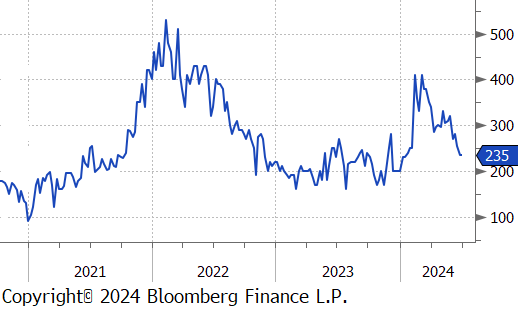
Tandem products both declined by $20, resulting in the HDG – HRC differential to stay at $235.
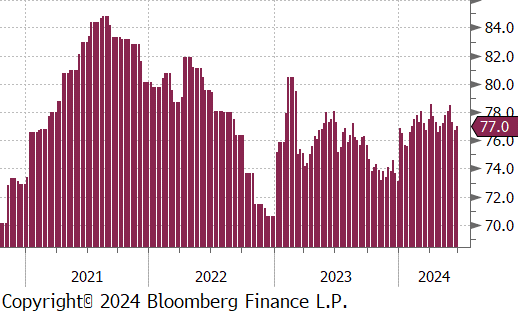
Mill production increased, with capacity utilization ticking up by 0.3% to 77.0%, bringing raw steel production up to 1.710m net tons.
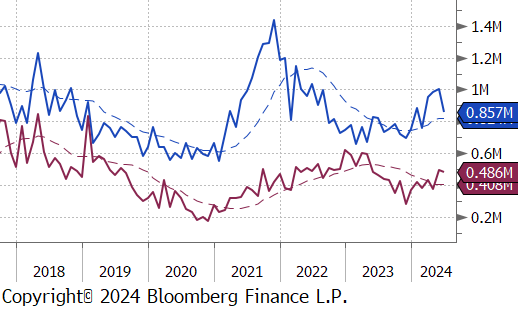
June Projection – Sheet 857k (down 147k MoM); Tube 486k (down 8k MoM)
May Projection – Sheet 1004k (up 17k MoM); Tube 494k (up 118k MoM)
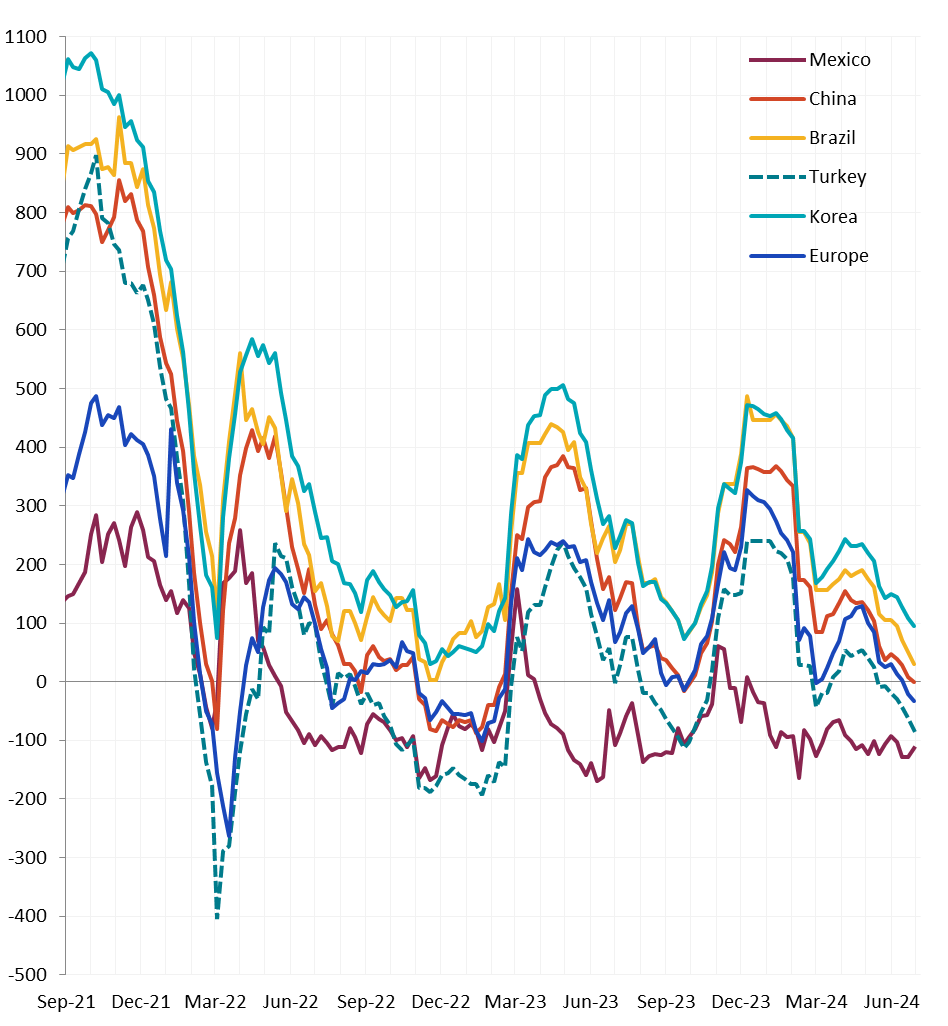
All watched global differentials all contracted this week, with Brazil Export HRC and Mexico HRC experiencing the biggest price declines, falling by -2.9% and -4.8%, respectively.
Scrap
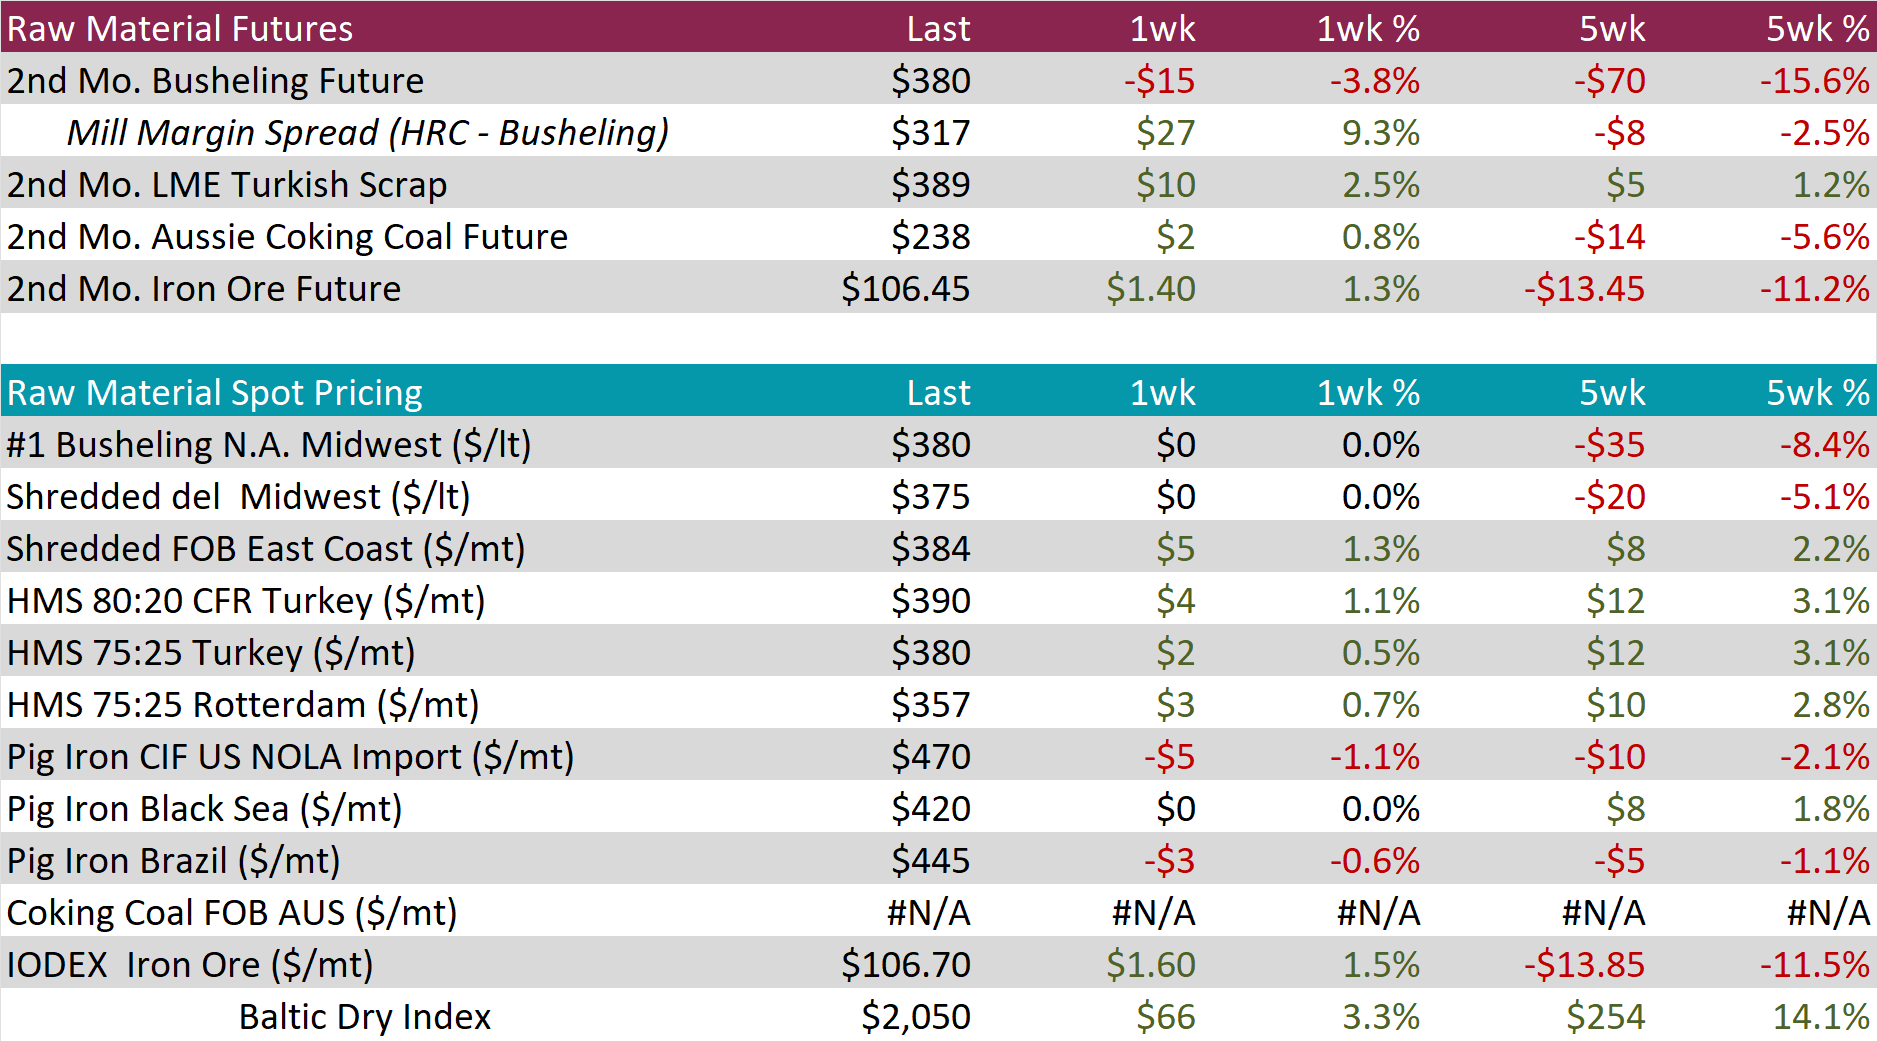
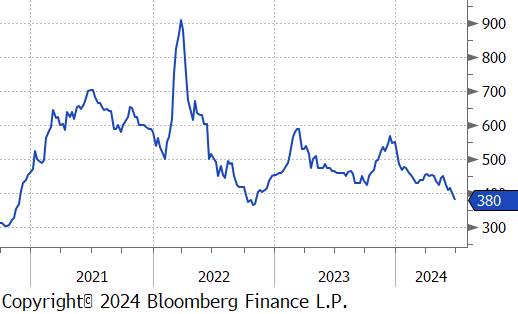
The 2nd month busheling future dropped by $15 or -3.8% to $380, falling to its lowest price since November 2022.
The LME Turkish scrap 2nd month future rose by $10 or 2.5% to $389, resulting in the 5-week price change to be up by $5 or 1.2%.
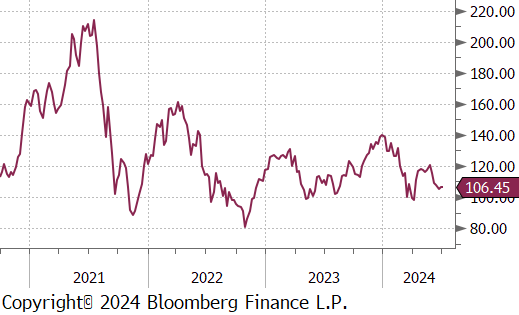
The iron ore 2nd month future increased by $1.40 or 1.3% to $106.45, marking a reversal from the previous four consecutive weeks of price declines.
Dry Bulk / Freight
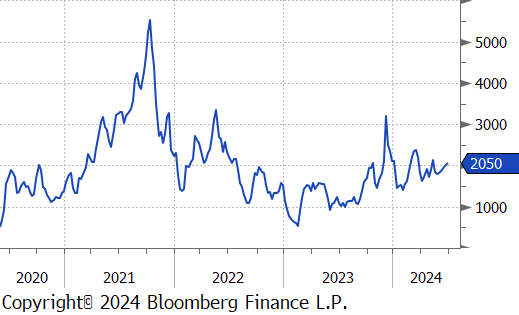
The Baltic Dry Index climbed by $66 or 3.3% to $2,050, breaking back through to the $2,000s level for the first time in seven weeks.
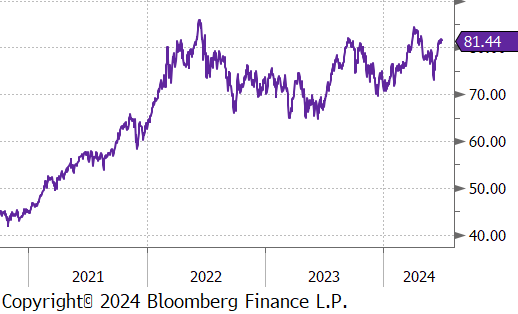
WTI crude oil future gained $0.81 or 1.0% to $81.54/bbl.
WTI natural gas future lost $0.10 or -3.8% to $2.60/bbl.
The aggregate inventory level experienced a slight increase of 0.7%.
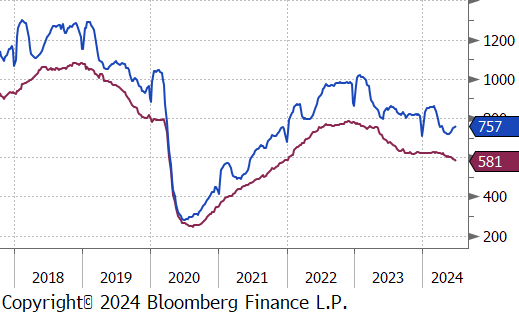
The Baker Hughes North American rig count added 3 rigs, bringing the total count to 757 rigs. Meanwhile the US rig count continued to slip, reducing by 7 rigs, bringing the total count to 581 rigs.

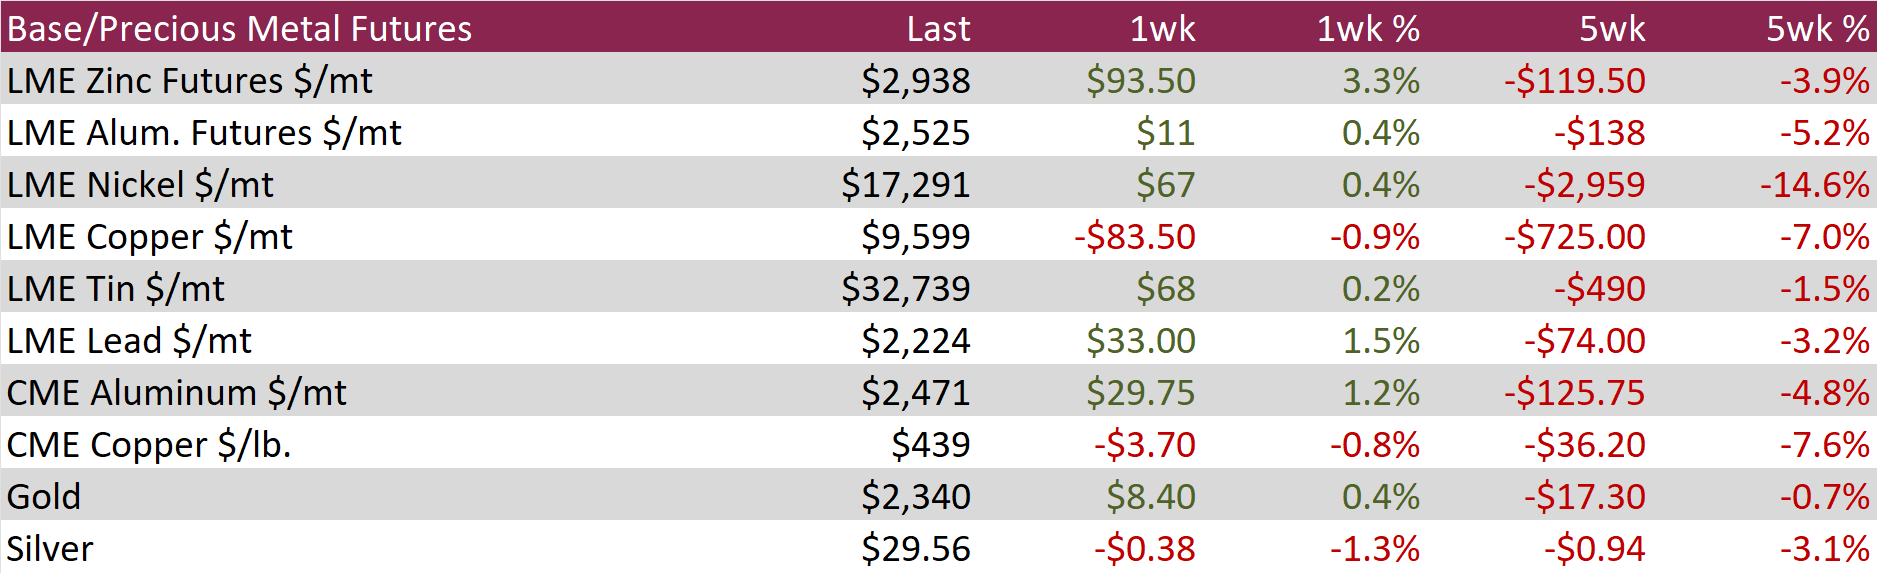
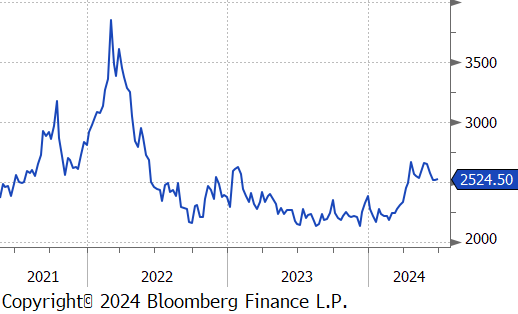
Aluminum futures rose by $11 or 0.4% to $2,525, stabilizing after hitting a two-month low last week. This trend mirrored the broader pullback in base metals, driven by signs of ample supply and weak demand. In China’s Yunnan province, increased rainfall improved hydropower availability, allowing smelters to restart idled capacity. This alleviated previous concerns about dry weather disrupting production, leading to a 7.2% annual increase in China’s aluminum output, reaching a record 3.65 million tons in May. Market perceptions of oversupply were further reinforced when Trafigura offloaded over 400,000 tonnes of aluminum, primarily of Indian origin, into LME warehouses. The volatility in LME aluminum warrants, largely due to traders exploiting rent-sharing deals after the UK’s sanction of Russian metal, revealed significant metal availability.
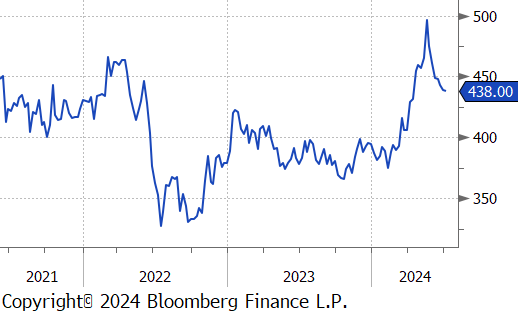
Copper futures fell by $3.70 or -0.8% to $439, as robust supply outweighed expectations of increased physical demand in China. Copper inventories in LME-approved warehouses rose from approximately 104,000 tons in May to 180,125 tons by June 27. Similarly, the Shanghai Futures Exchange reported a rise in copper inventories to 322,910 tons from around 30,000 tons in January. Additionally, Chile’s copper production grew by 8% year-on-year to 444,000 tons in May, driven by expansions at the Quedra Blanca and Escondida mines. Despite the supply surge, analysts suggested that falling prices might boost physical demand in China, the world’s largest copper consumer.
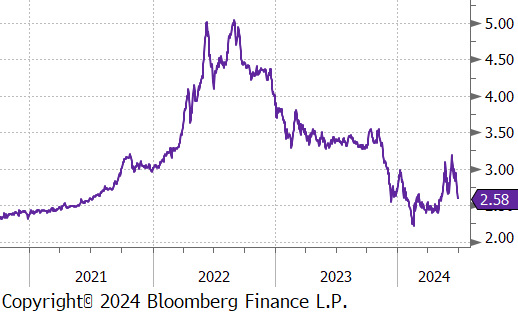
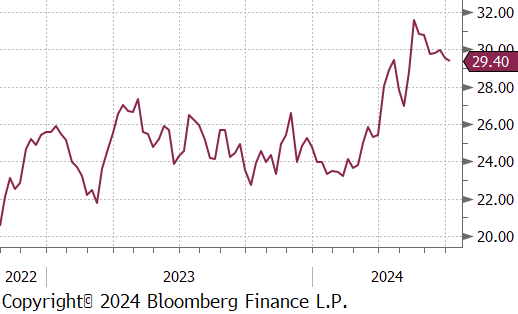
Silver fell by $0.38 or -1.3% to $29.56, ending a two-day rally as investors evaluated the Federal Reserve’s monetary policy outlook amid signs of cooling U.S. inflation. On Friday, data revealed that U.S. PCE prices, the Fed’s preferred inflation gauge, continued to decline toward the central bank’s 2% target in May, as anticipated. Despite this, Fed officials urged caution before considering rate cuts, with Fed Governor Michelle Bowman expressing openness to a further rate hike if inflation progress stalls or reverses. Additionally, demand uncertainties in China, the top silver consumer, pressured prices after an official report indicated a second consecutive month of manufacturing decline in June. In contrast, a private survey showed the fastest manufacturing sector growth in three years.
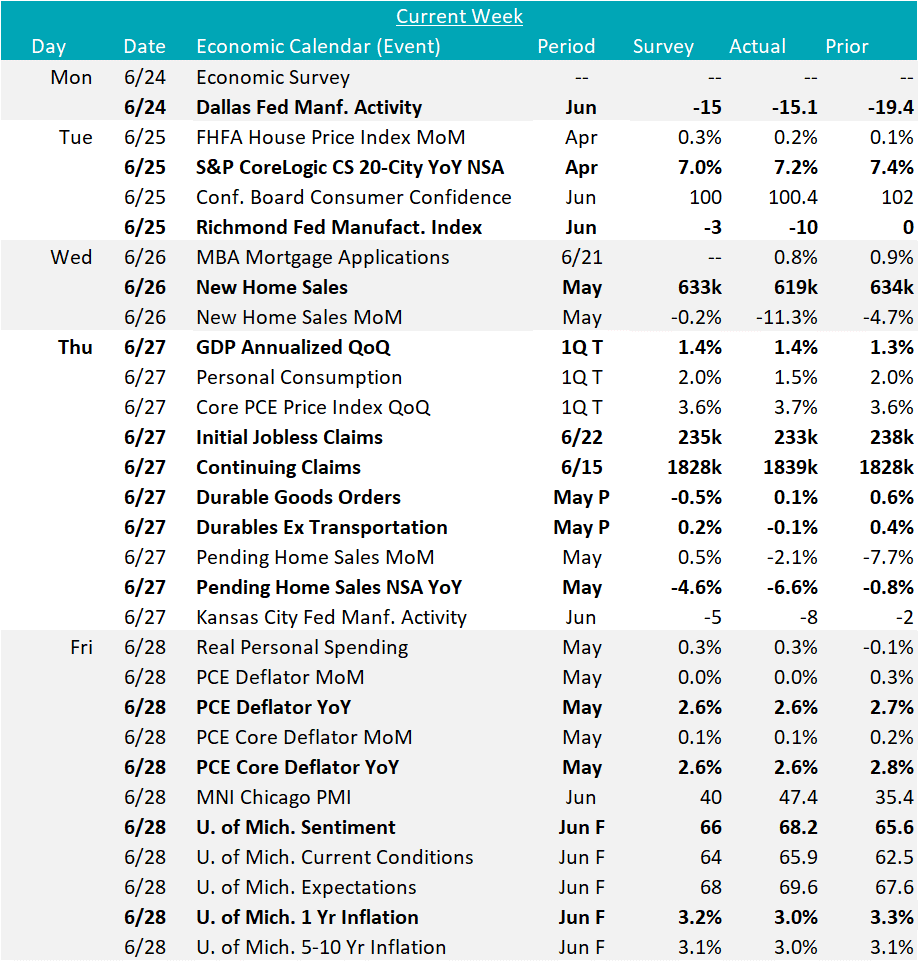
Now that the month is all but over, we have the full set of June FED manufacturing surveys to look for insight into how next week’s ISM Manufacturing PMI may print. Dallas (-15.1, up 4.3 MoM), Richmond (-8, down 6 MoM), and K.C. (-10, down 10 MoM) all remain in contraction with the latter two coming in below expectations and joining Empire (NY) with negative prints. Philly is currently the only regional survey in expansion territory. Taking a broad view of the data, this would suggest next week’s ISM will likely remain in contraction territory for the third straight month, and for 18 of the last 19 months. At the same time, preliminary May Durable Goods New Orders came in better than expectations up 0.1%, versus the expected -0.5%. This was driven by transportation sector, with (ex. Transportation) turning negative, down -0.1%, vs 0.1% expected.
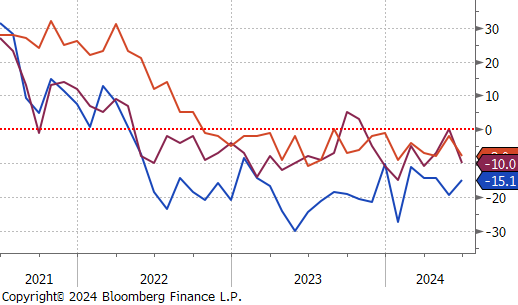
New home sales and pending home sales both disappointed this week on a YoY basis, down 11.3%, and 6.6%, respectively, with affordability noted as a consistent primary concern.
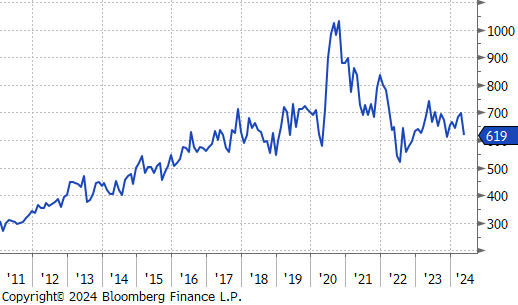
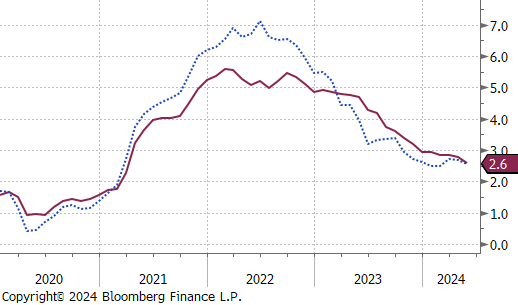
Finally, this week’s Inflation data came with a sigh of relief, as May’s Core PCE YoY (the FED’s preferred reading) printed in line with expectations at 2.6%, down from the April reading of 2.8%. This was also the reading for Topline PCE, down from April’s 2.7% print. Looking more closely, there were two very important signals within the data. First, goods disinflation was strong for the second month in a row, after it had been positive Jan-Mar. Second, this was the lowest MoM reading for Core PCE since November 2020. Furthermore, today’s final June U. of Michigan 1yr Inflation Expectations came in well below the median forecast, and down to 3% (the lowest reading since March).