Flack Capital Markets | Ferrous Financial Insider
March 7, 2025 – Issue #474
March 7, 2025 – Issue #474
Overview:
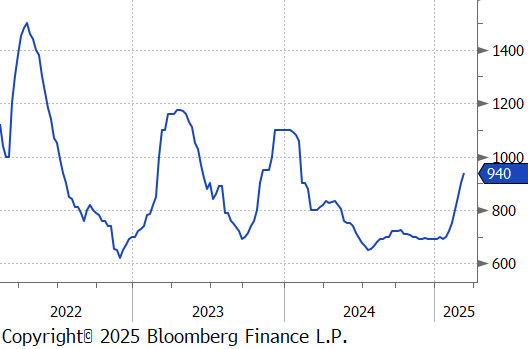
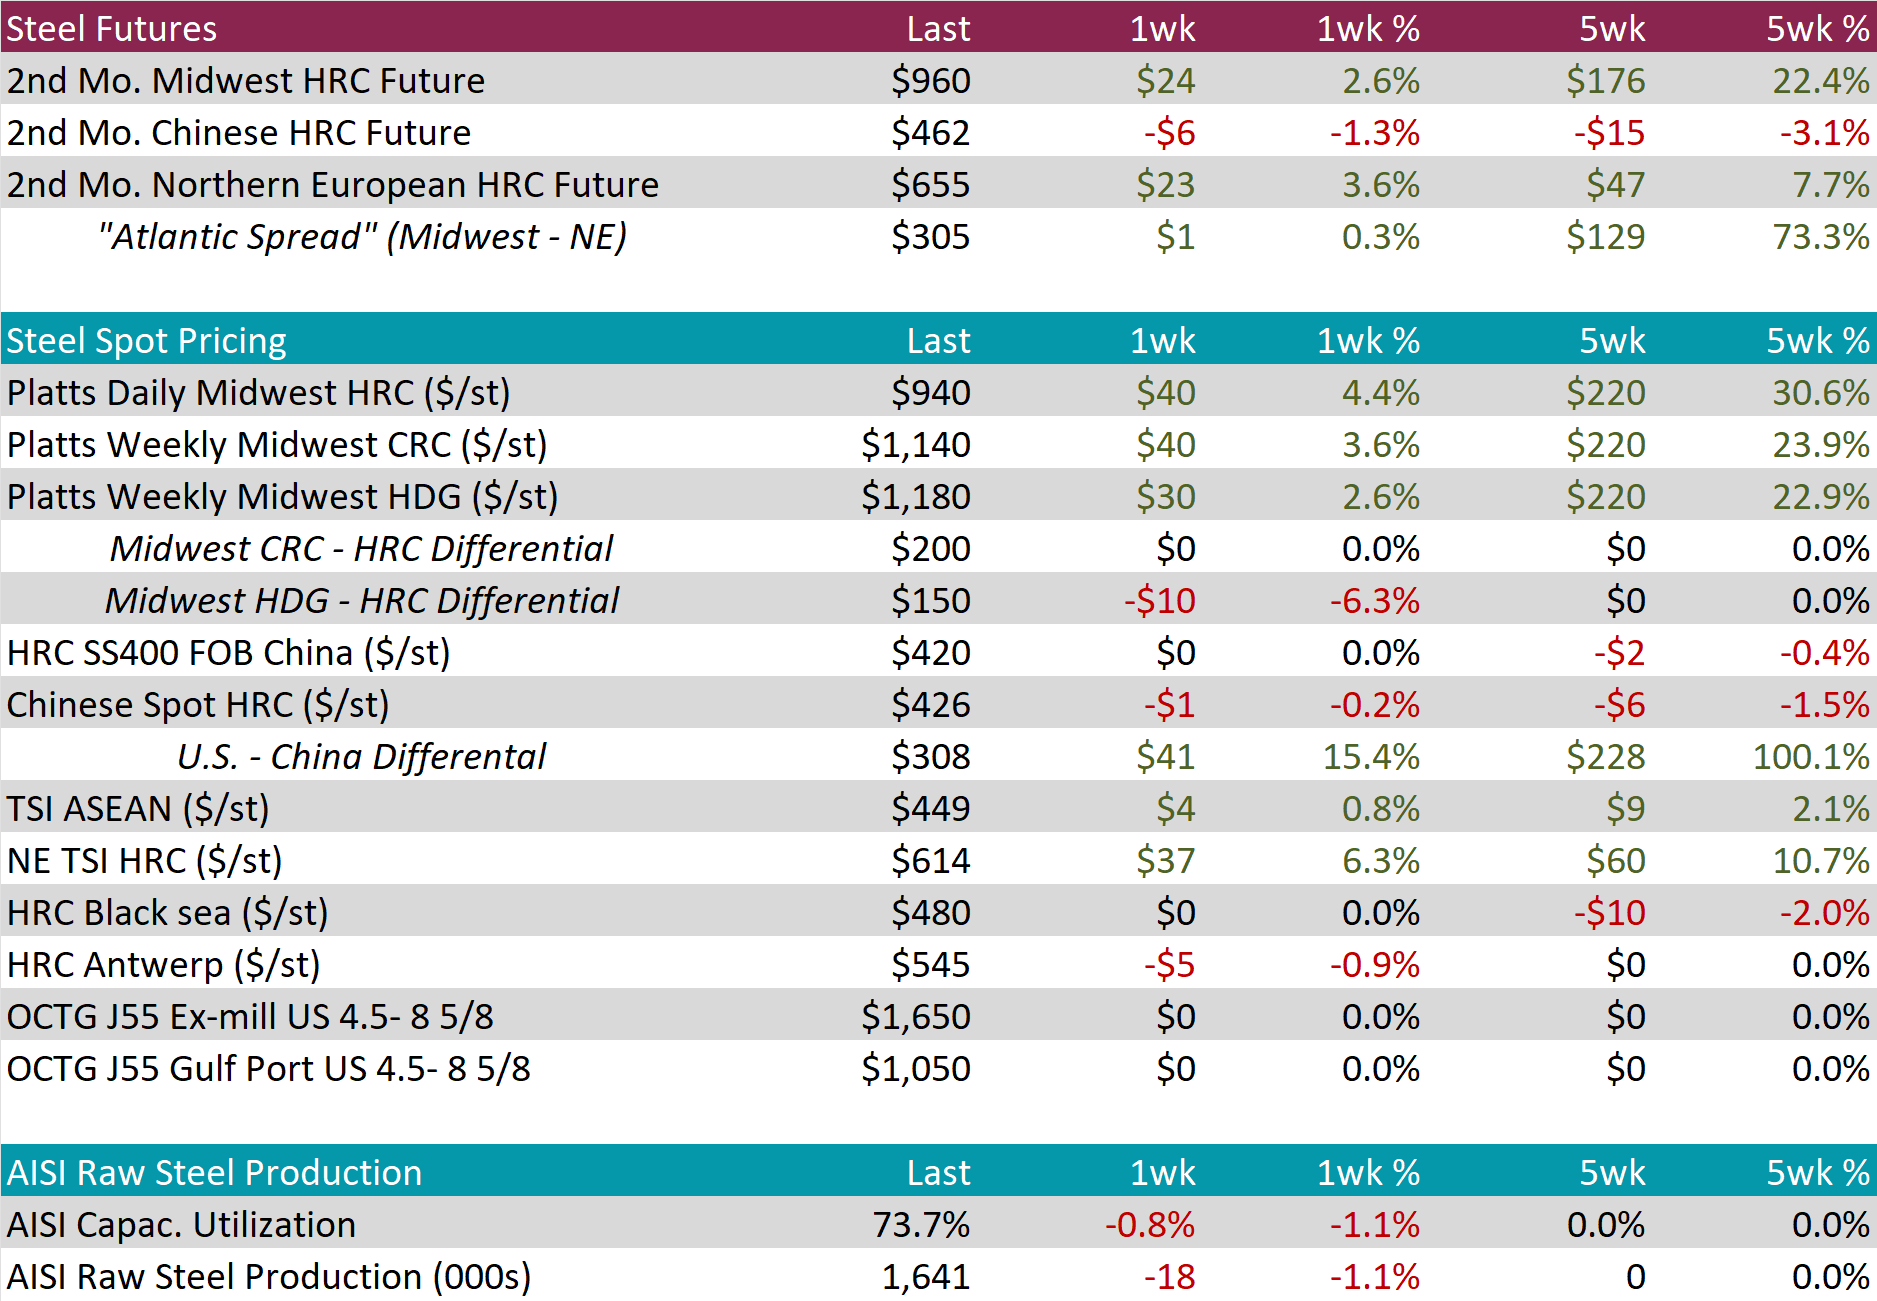
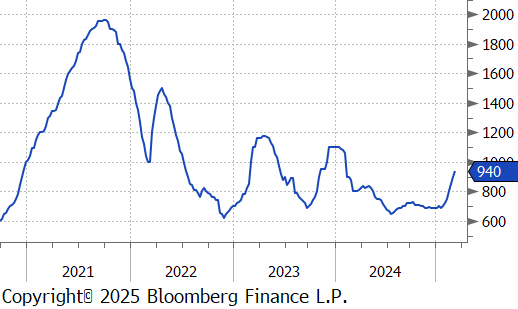
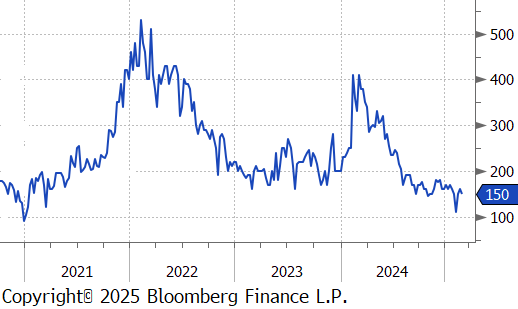
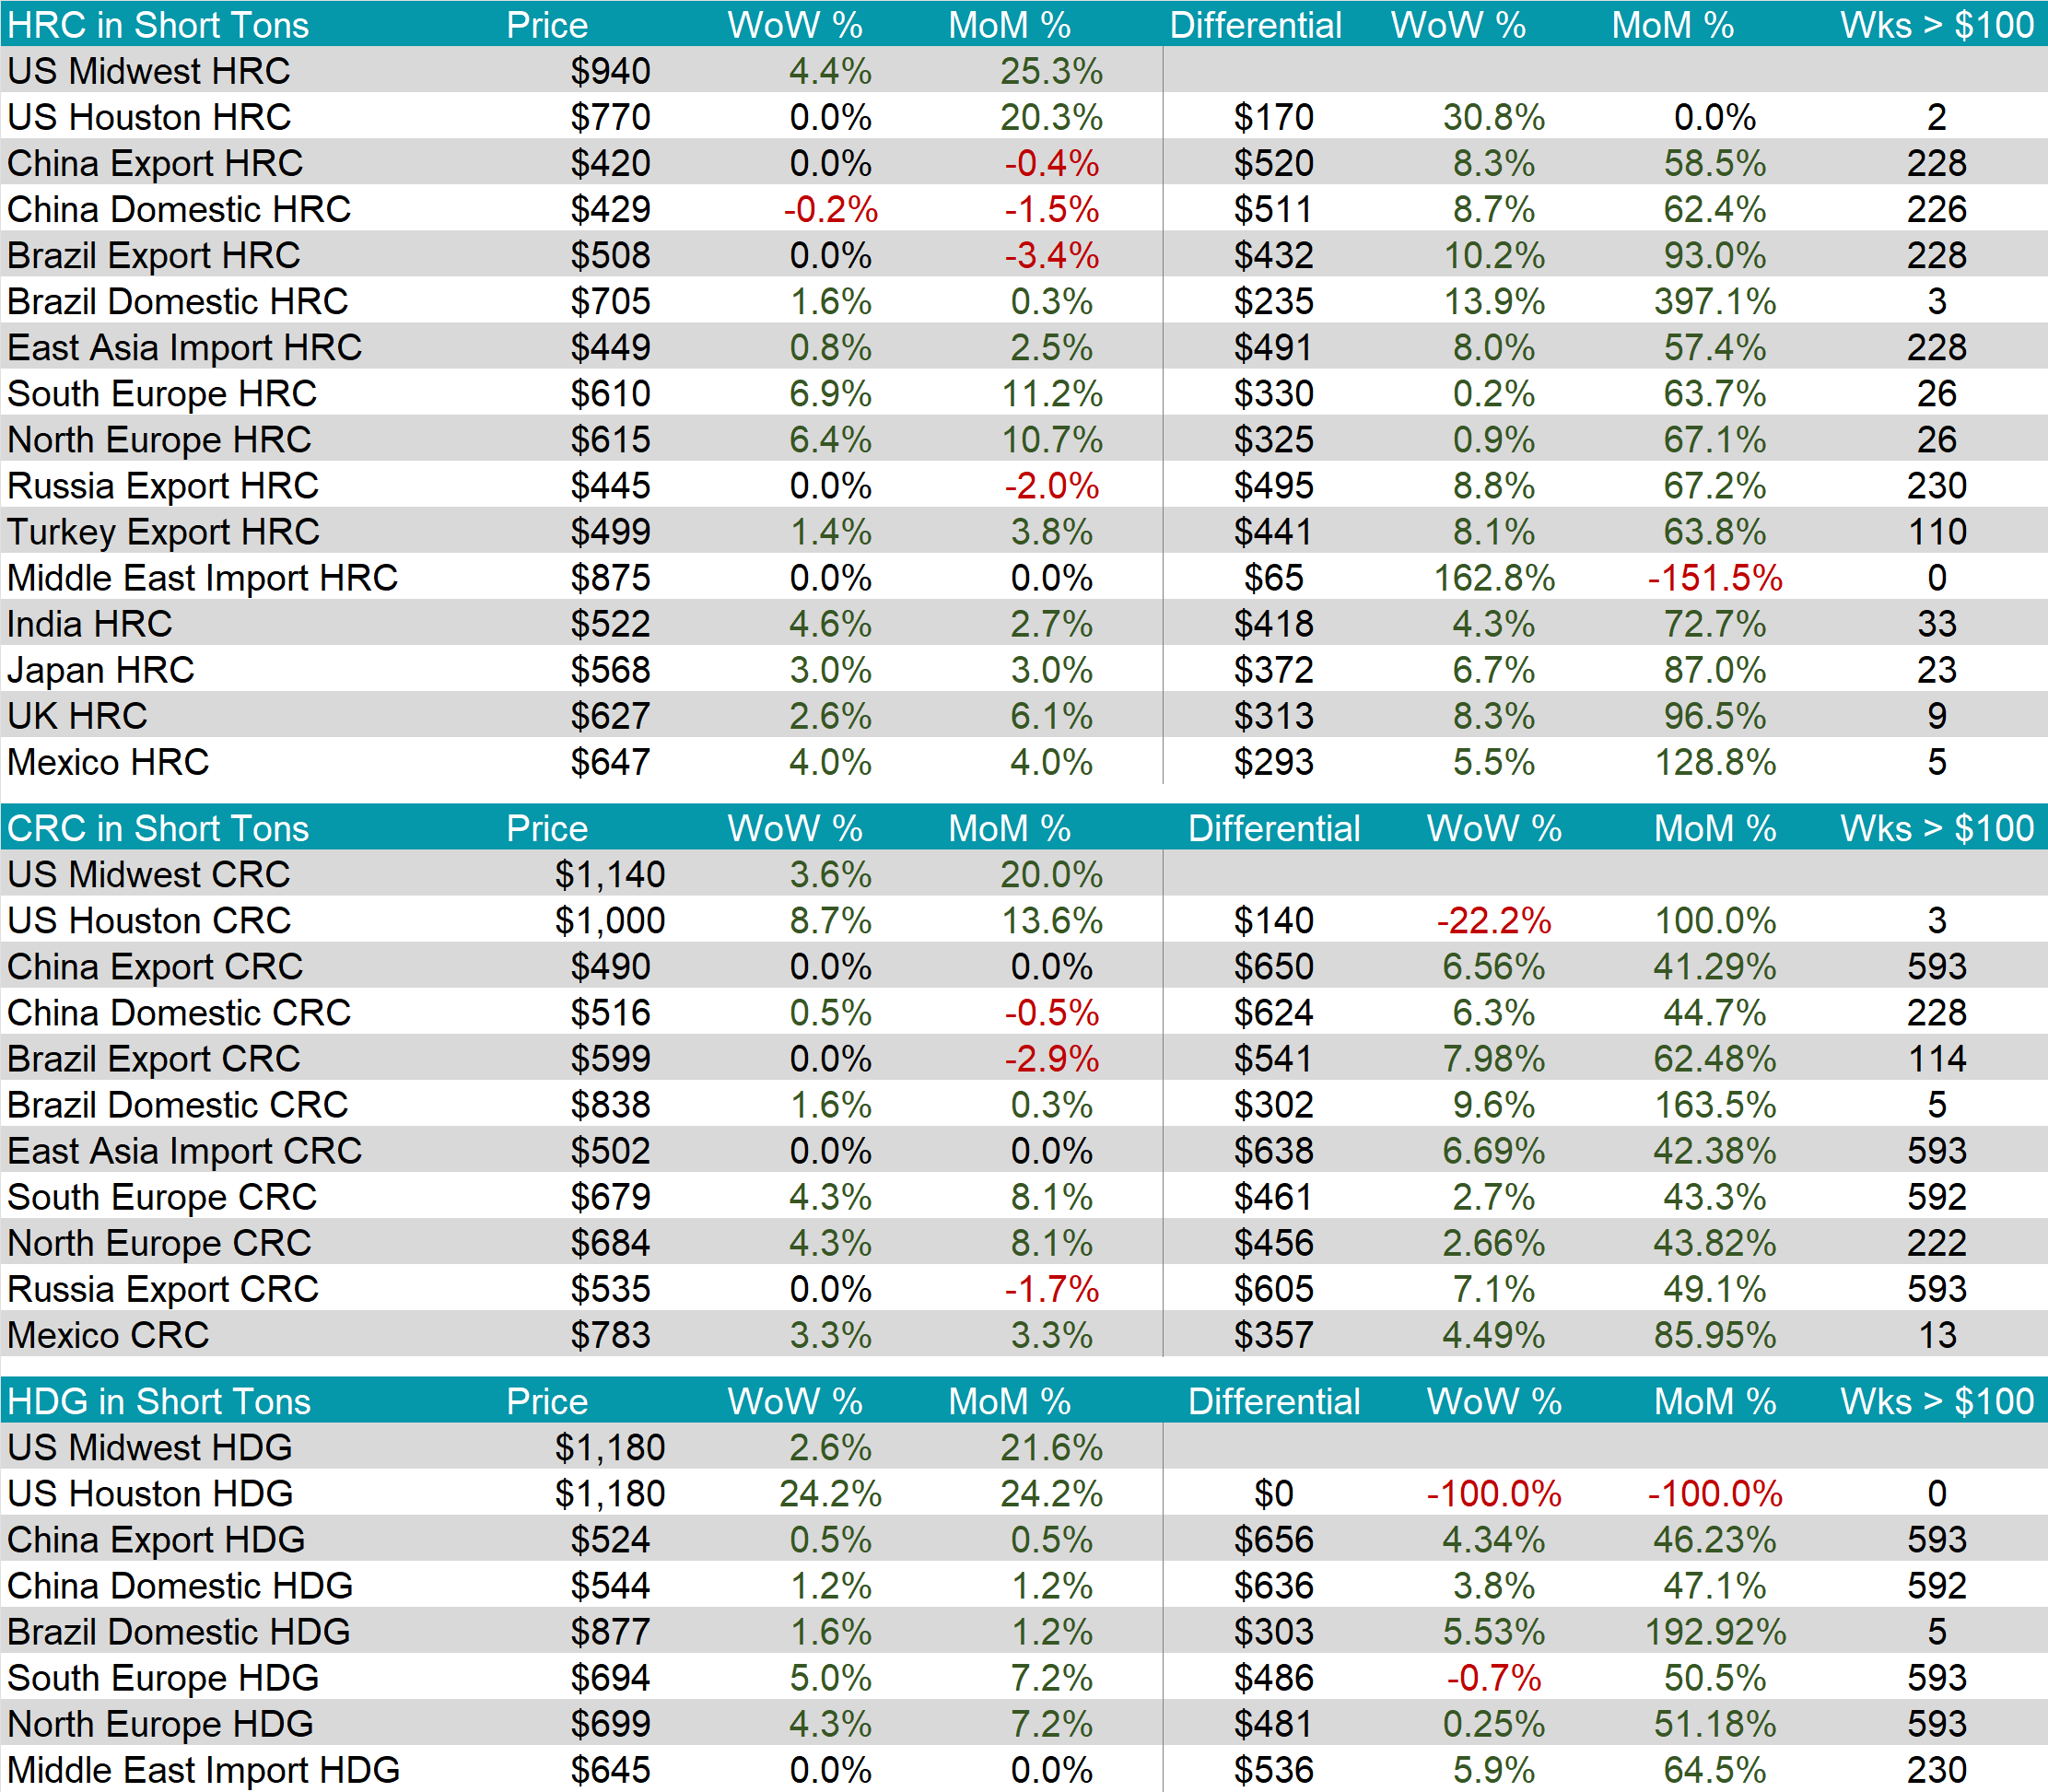
The HRC spot price increased for the seventh consecutive week, rising by $40 or 4.4% to $940. At the same time, the HRC 2nd month future rose by $24 or 2.6% to $960, the highest since January 2024.
Tandem products both made gains, CRC up by $40 and HDG up by $30, resulting in the HDG – HRC differential to slump by $10 or -6.3% to $150.
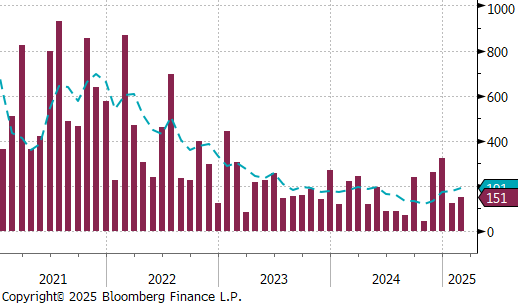
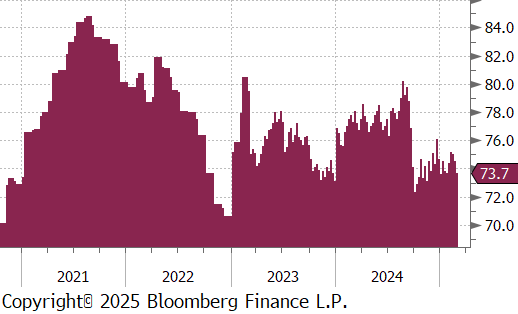
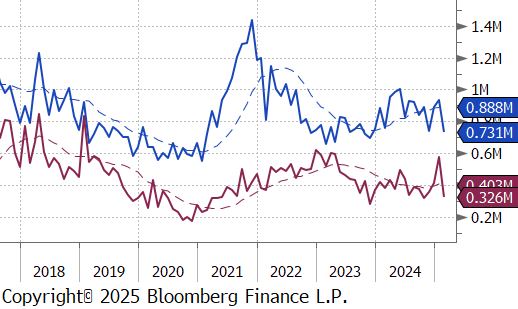
Mill production eased further, with capacity utilization ticking down by -0.8% to 73.7%, bringing raw steel production down to 1.641m net tons.
February Projection – Sheet 731k (down 205k MoM); Tube 326k (down 254k MoM)
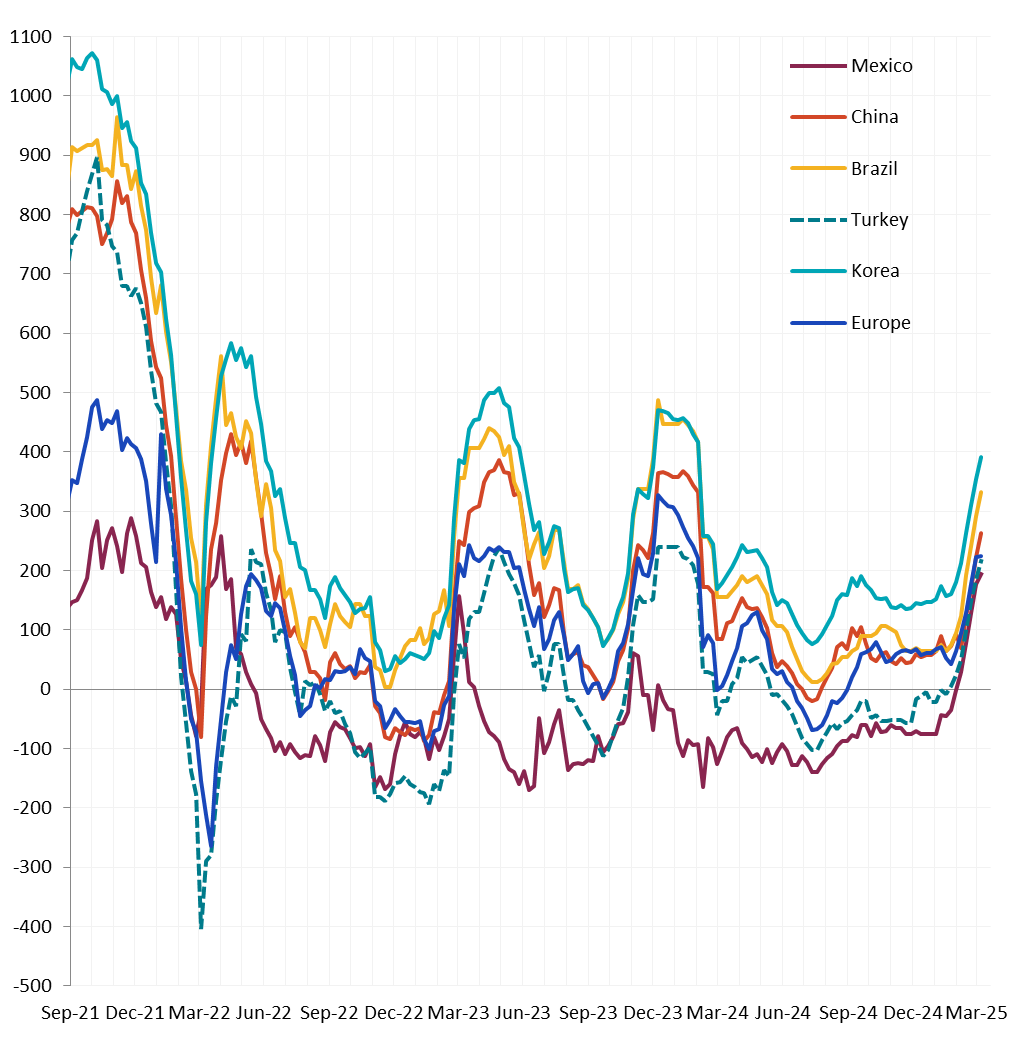
Global differentials expanded further, with price changes being notable in North Europe (+6.4%), Tukey (+1.4%), Mexico (+4.0%), India (+4.6%), and Japan (+3.0%).
Scrap
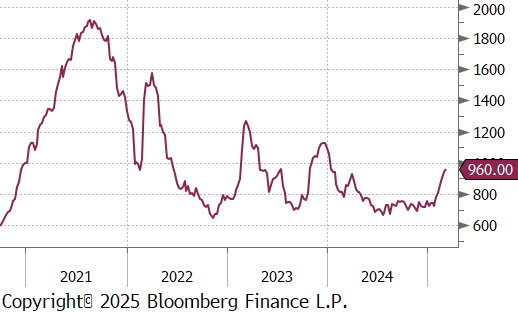
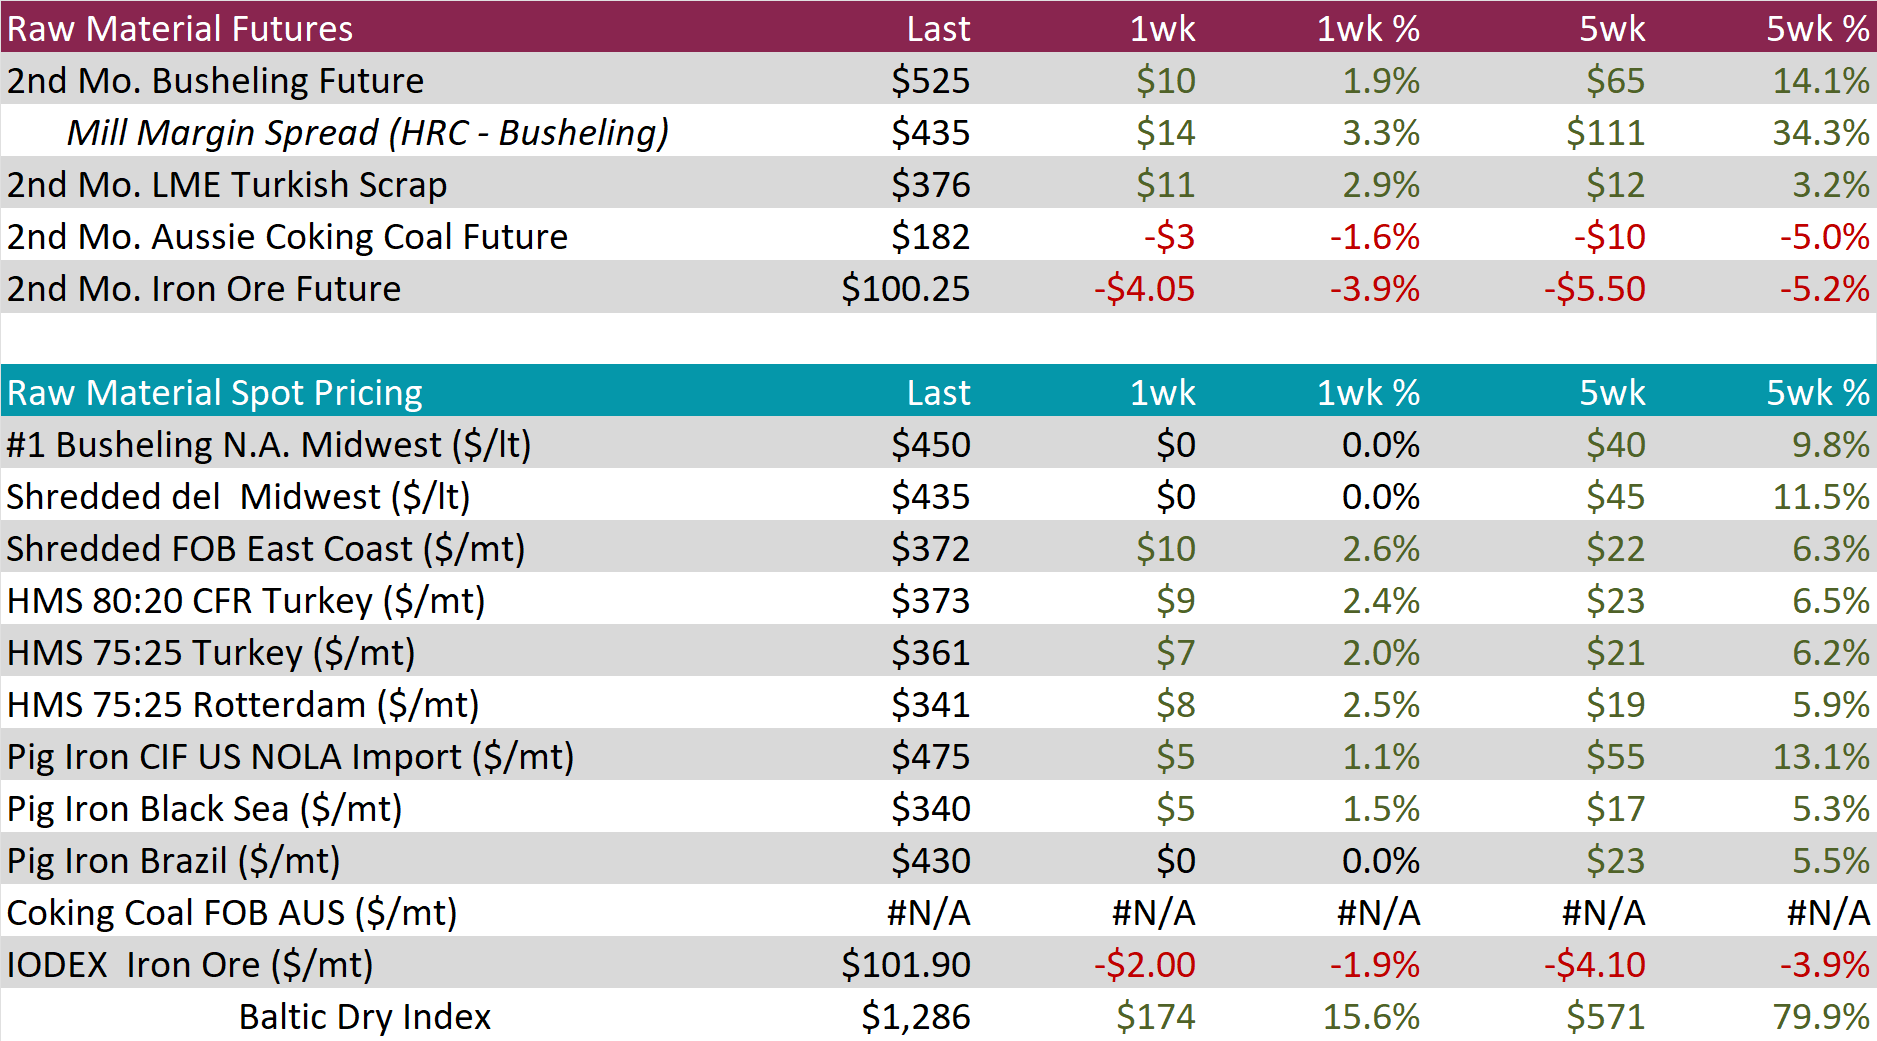
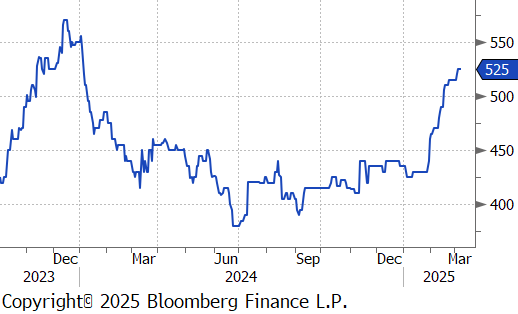
The 2nd month busheling future inched up by $10 or 1.9% to $525, reaching the highest level since December 2023.
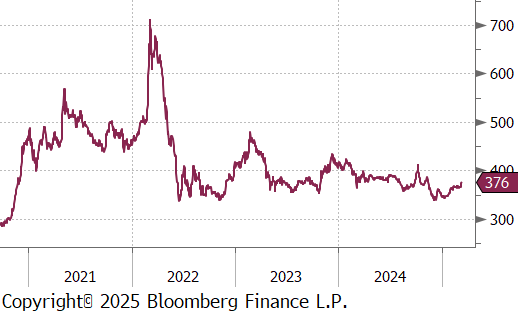
The LME Turkish scrap 2nd month future increased by $11 or 2.9% to $376, rebounding to the highest price since November 2024.
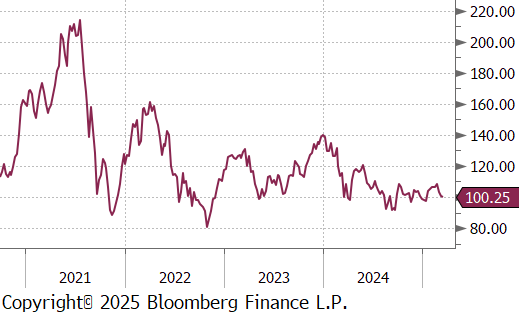
The iron ore 2nd month future declined by $4.05 or -3.9% to $100.25, falling for the second consecutive week.
Dry Bulk / Freight
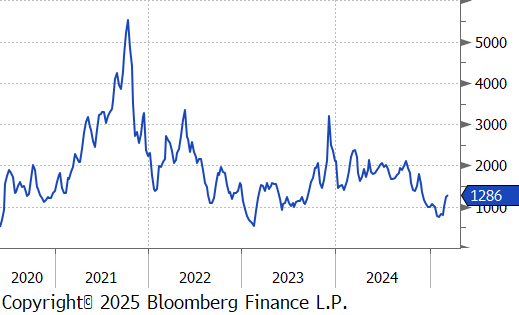
The Baltic Dry Index rose by $174 or 15.6% to $1,286, its third consecutive week of increases and the highest level since November 2024.
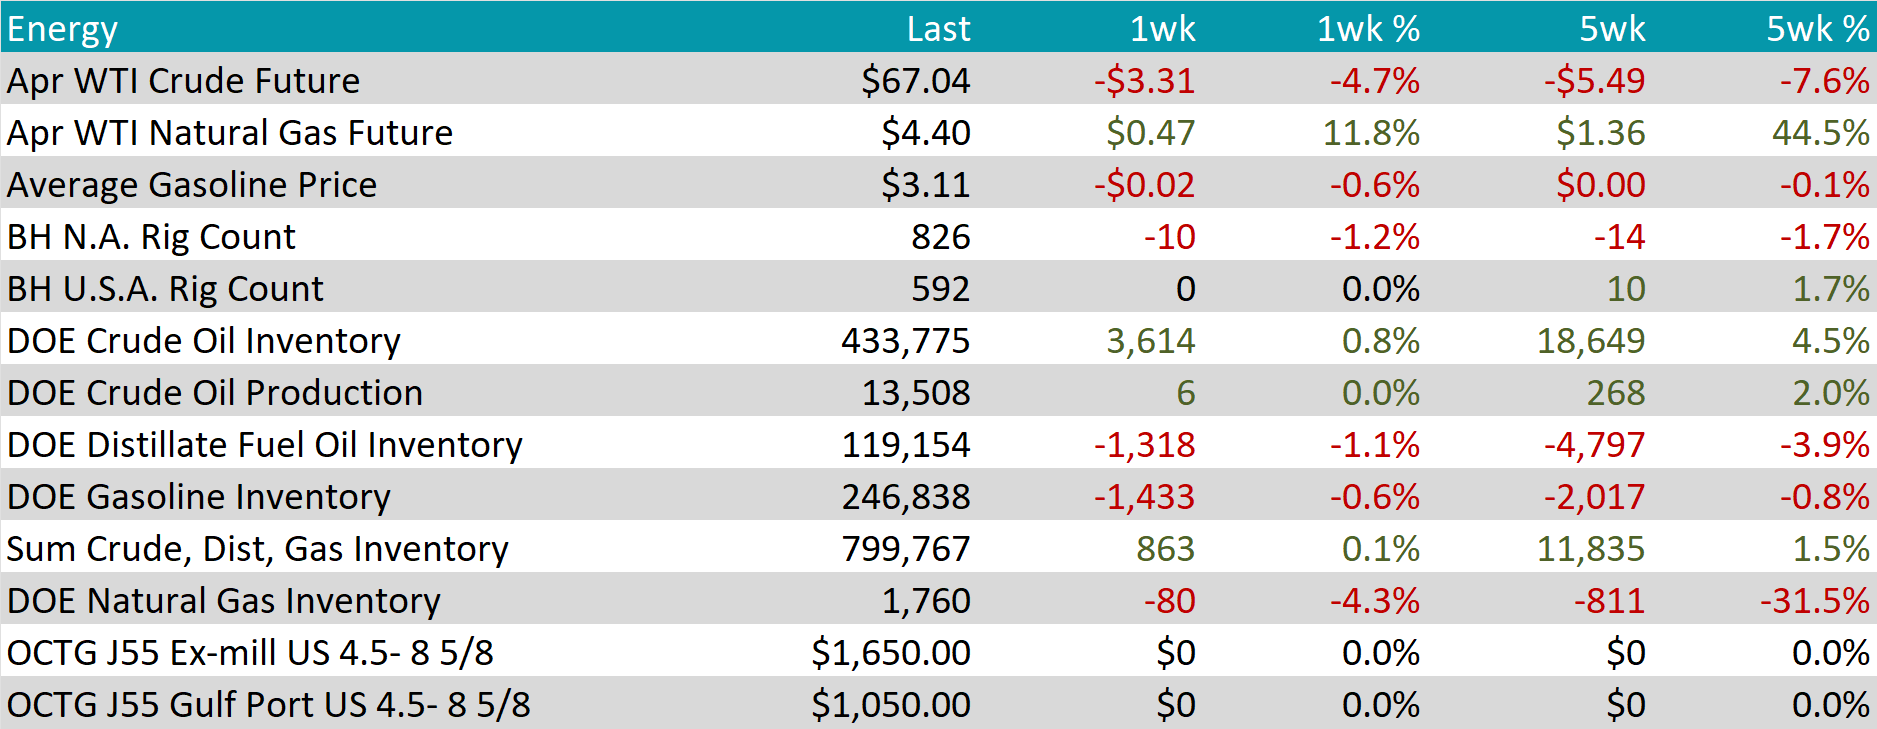
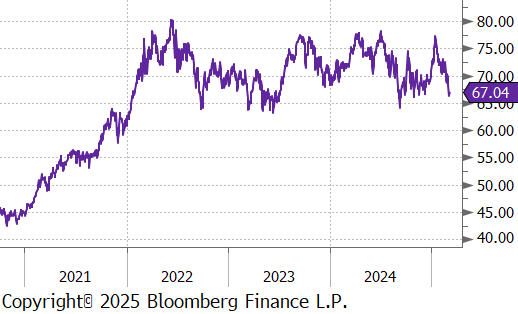
WTI crude oil future lost $3.31 or -4.7% to $67.04/bbl.
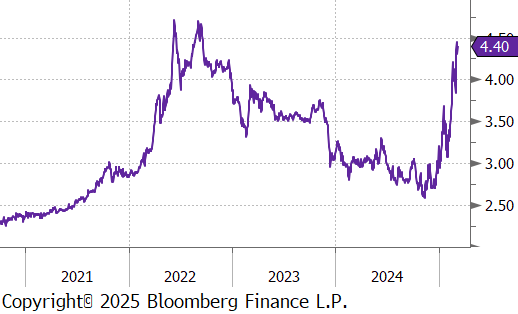
WTI natural gas future gained $0.47 or 11.8% to $4.40/bbl.
The aggregate inventory level experienced an increase of 0.1%.
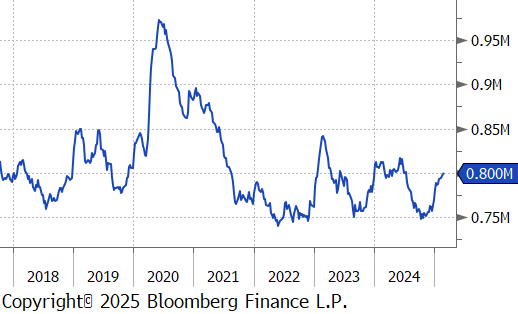
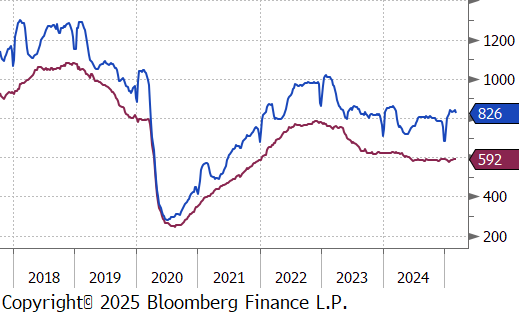
The Baker Hughes North American rig count reduced by 10 rigs, bringing the total count to 826, while the US rig count held steady at 592.
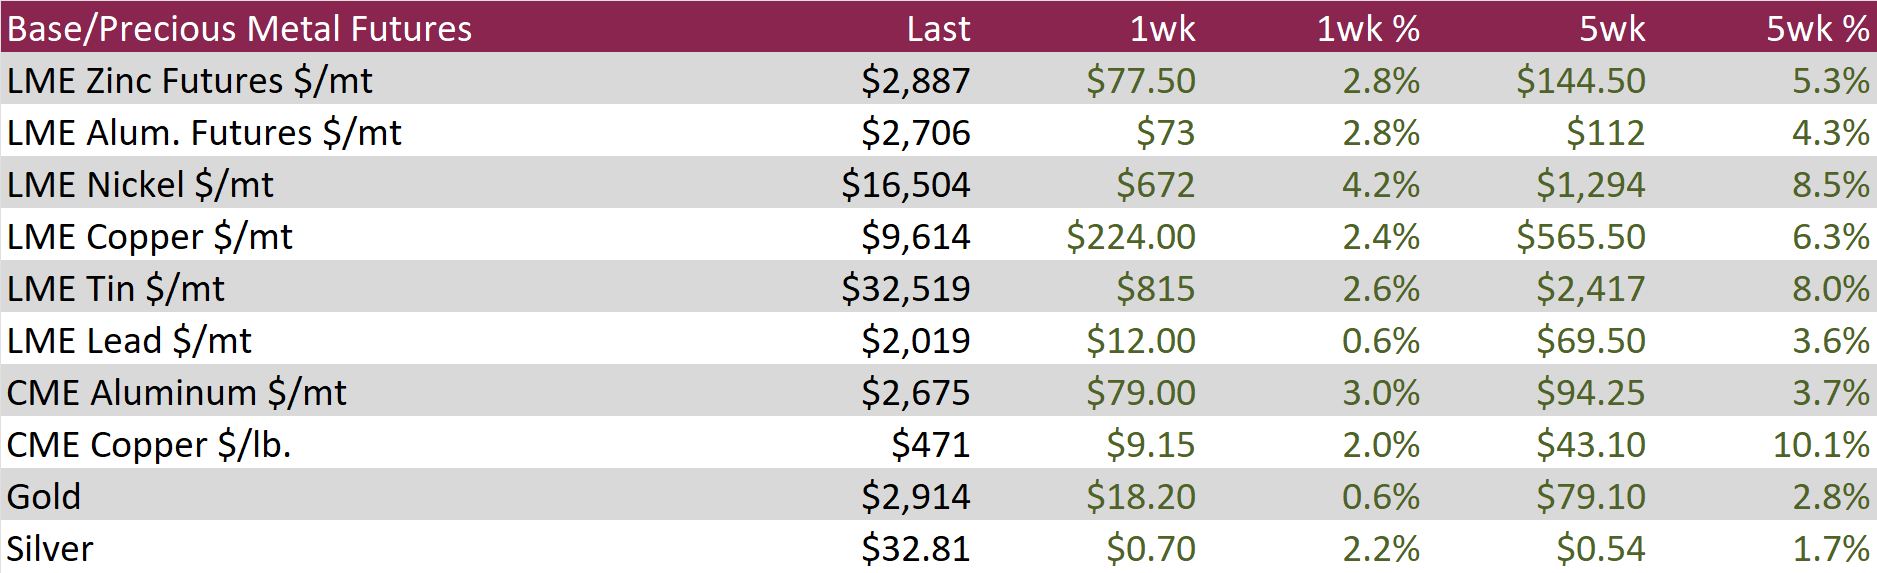
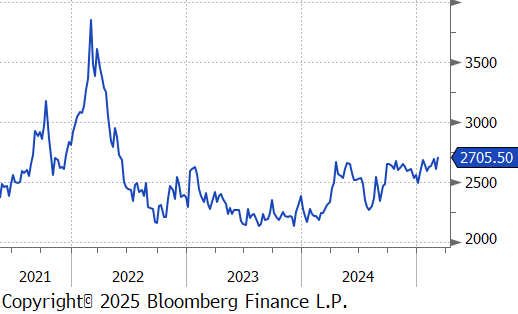
Aluminum futures jumped by $73 or 2.8% to $2,706, approaching the nine-month peak of $2,730, as supply constraints from key producers reinforced expectations of stronger demand. Despite record-high aluminum output of 44 million tons in 2024, China faces a production slowdown this year due to long-standing government caps. Beijing’s 2017 limit of 25 million tons, aimed at curbing oversupply and reducing carbon emissions, suggests a necessary pullback in smelting activity. Meanwhile, fresh trade data indicates that Chinese aluminum exports have remained subdued following the removal of tax rebates on overseas shipments. This shift has tightened global supply, pushing up prices in foreign markets as domestic producers prioritize local sales. On the demand side, Beijing’s decision to expand its budget deficit to a record level signals a ramp-up in infrastructure spending, with increased issuance of special bonds expected to boost economic momentum—potentially driving higher aluminum consumption in construction and manufacturing.
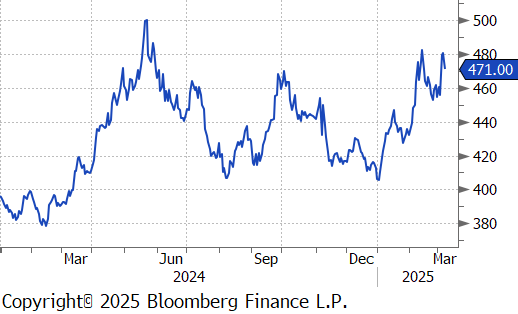
Copper futures rose by $9.15 or 2.0% to $471. Over the weekend, reports showed declines in both consumer and producer prices for February, reinforcing concerns about deflationary pressures in the world’s largest copper consumer. While Beijing has emphasized its ability to implement stimulus measures, the country’s economic outlook remains clouded by sluggish domestic demand and growing trade tensions with the United States. Last week, copper prices rallied to multi-month highs following former U.S. President Donald Trump’s proposal to impose a 25% tariff on copper imports. Such a policy shift could drive greater reliance on domestic production, but with the U.S. importing nearly half of its copper supply and operating only two major smelters, supply constraints could limit the effectiveness of reshoring efforts. This uncertainty adds volatility to copper markets, as traders weigh geopolitical risks against broader economic headwinds.
Precious Metals
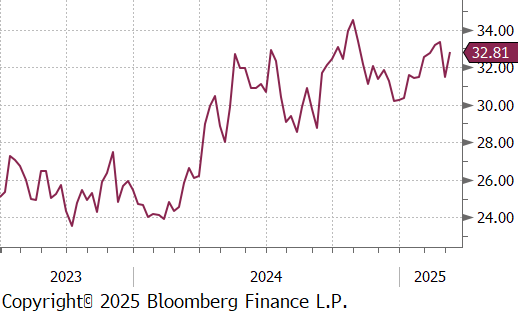
Silver increased by $0.70 or 2.2% to $32.81, as investors monitored ongoing trade tensions and awaited U.S. inflation data for clues on the Federal Reserve’s next moves. Market uncertainty escalated after former U.S. President Donald Trump signaled that Canada could soon face reciprocal tariffs on dairy and lumber. This follows the U.S. decision to delay the implementation of 25% tariffs on various Canadian and Mexican goods for a month, while Canada’s retaliatory measures remain in place and China’s tariffs on select U.S. agricultural products took effect. Meanwhile, Fed Chair Jerome Powell reiterated on Friday that policymakers see no immediate justification for cutting interest rates, despite mounting economic uncertainty. As markets weigh the Fed’s stance against geopolitical developments, silver remains a focal point for investors seeking a hedge against volatility.
At the beginning of any new presidential administration the question arises, when a new set of policies start impacting the data – historical analysis suggests initial volatility in surveys should be taken with a grain of salt for the first couple of months in year (say Q1), while hard data takes approximately 6 months (2H). In this case, however, Trump II will likely be different given the facts that (1) it is a return to the presidency, and (2) the policies are aimed to significantly reshape the structure of the economy in a unique way. Because of this we view hard data dated in April as the starting point for Trump II.
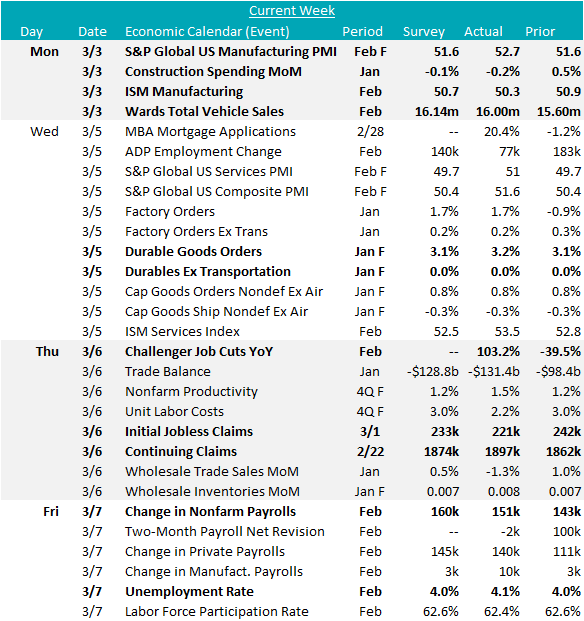
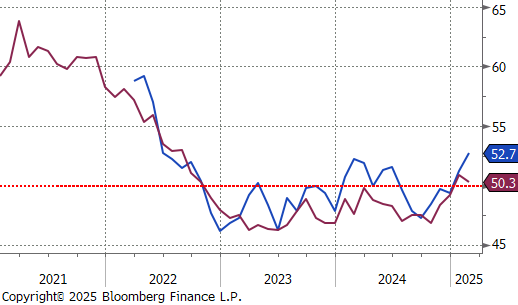
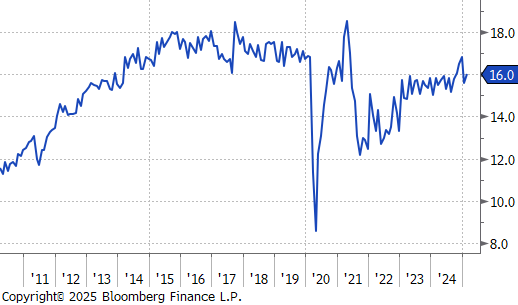
In the manufacturing sector, we saw continued expansion from February readings in both the S&P Global, and US ISM Manufacturing PMIs rising to (52.7, above the expected 51.6), and (50.3, below the expected 50.7), respectively. Underlying activity was mixed between the two but continues to suggest that manufacturing should continue improving well into the 2nd quarter. Final data for January durable goods new orders shows continued activity, up 3.2%, however, this was driven primarily by auto, with ex. Transportation coming in flat, at 0.0%. To that effect, February auto sales rebounded to 16m units sold (SAAR) after a disappointing decline in January at 15.6m, however, this was slightly below the expected 16.14m. From the underlying data, January showed a 41-month low for auto production, and a 17-month low for auto inventories.
The labor market provided the most interesting data this week. To start, ADP employment data (which may become a more important leading indicator going forward) came in at 77k jobs added, well below the expected 140k. Additionally, Challenger Job Cuts surged to their highest level since 02/2009 (ex. COVID). Finally, Nonfarm payrolls came in just below expectations at 151k jobs added in February. Of those, 140k were from the private sector, and 10k were from manufacturing. Finally, the unemployment rate ticked higher to 4.1%, from 4% in January.